
You can access both of our platforms from a single Saxo account.

Up on average, down by weight - Options Brief - 30 October 2026

Summary: Most stocks rose on Thursday and the S&P 500 still fell, dragged down by its largest names. After the close Amazon and Intel added to the damage. One option gauge now points the other way.
Most stocks rose on Thursday and the S&P 500 still fell, because the losses sat in its largest names, and after the close Amazon and Intel added to them.
MARKET REGIME: TRANSITIONING | VIX 17.20 | TERM STRUCTURE: CONTANGO | SKEW: ELEVATED (151.03) | FRONT-MONTH VIX FUTURES: 19.210
Today in brief
Thursday split the market by weight. The S&P 500 fell 0.30% to 7,720.39 while its equal-weighted version rose 1.21%, because the losses sat in a handful of the largest names. Alphabet fell 12.64% on its results, and after the close Amazon fell about 7% and Intel about 23%. Options indicatively price 0.64% for today’s expiry, about 1.9 points below what time decay alone would have left from Wednesday’s reading, so in our view the option market took a little premium out of the week after Alphabet’s gap rather than adding to it.
Alphabet shows what the options were pricing. It was priced for 5.5% and moved 12.6%, the largest multiple of the season on our scorecard, and its implied-volatility rank then fell 43.2 points, in our view because the event was over. Amazon went into its own report priced for 7.7%, and its late-trade fall of about 7% was close to that, before today’s session.
The reading that cuts the other way is correlation. Implied correlation, a gauge of how closely stocks are expected to move together, rose 7.24% to 13.78, the 96th percentile of our store, while dispersion, which prices how far index members are expected to move apart, fell back to its median. In our view the market may now price the next surprise to travel across the index more than it did on Thursday.
The headline volatility gauge rose to 17.20. The index has used 71% of the range priced for this week, down from 88% a session earlier, with one session left. Single-name volatility drained further, yesterday’s single-name flow carried no readable direction, and Treasuries rallied despite third-quarter growth of 3.4%.
That is the whole brief in one read. The sections below hold the detail behind each paragraph, with the charts, the full set of readings and the sources, for when you want to go deeper on one part.
Headline driver
Most of the index rose on Thursday and the index still fell. The S&P 500 lost 0.30% to 7,720.39 while its equal-weighted version gained 1.21% and small caps 0.97%. The difference was a handful of the largest names.
Alphabet fell 12.64% on results showing negative free cash flow of 9.1 billion dollars, and Amazon slid 4.25% into its own report. After the close Amazon fell about 7% on elevated spending and negative free cash flow, and Intel about 23% on a weak outlook.
The data ran the other way. Third-quarter growth came in at an annualised 3.4%, the fastest in a year, and September’s personal consumption expenditures price index rose 3.6% on the year, yet Treasuries rallied along the curve as tech sold off. The European Central Bank held rates, and this morning the Bank of Japan held at 1.25% while raising its inflation forecasts.
Market snapshot
- US (Thursday 29 October close): S&P 500 7,720.39, down 0.30%. Nasdaq 100 29,402.51, down 1.38%. Dow Jones Industrial Average 52,348.24, down 0.25%. The equal-weighted S&P 500 rose 1.21%, health care 2.40%, while software fell 3.52% and Caterpillar nearly 10%.
- Europe: the Stoxx 600 rose 0.77% to 649.12, the DAX 1.31% to 26,039.68 and the CAC 40 1.05%. The FTSE 100 rose 0.3%. Haleon fell as much as 15% after cutting its growth outlook.
- Asia (Friday morning): the Kospi fell 4.64% to 5,662.14 by 05:00 CET while the Hang Seng rose 1.64%. Tech names took the brunt of the Intel and Amazon results.
- Commodities and rates: WTI traded at 103.21. Gold eased to 4,003.40 and silver to 51.35. The two-year Treasury yield fell ten basis points on Thursday to 4.60% and a further two overnight, and the ten-year trades at 4.92%, while high-yield spreads widened 10 basis points to 323. Bitcoin traded near 77,700.
- Overnight (05:00 CET Friday): Nasdaq 100 futures 28,957.25, down 2.05%, and S&P 500 futures 7,679.25, down 0.97%.
- Market regime: transitioning, the VIX at 17.20, the cash curve in contango and SKEW elevated at 151.03.
Index levels and volatility readings from the watchlist export taken at 05:00 CET on 30 October 2026, which carries Thursday’s US closes; rates, oil and single-stock detail from the same-morning Saxo Market Quick Take. Past performance is not indicative of future results. Source: Saxo, Bloomberg, CBOE.
Volatility surface
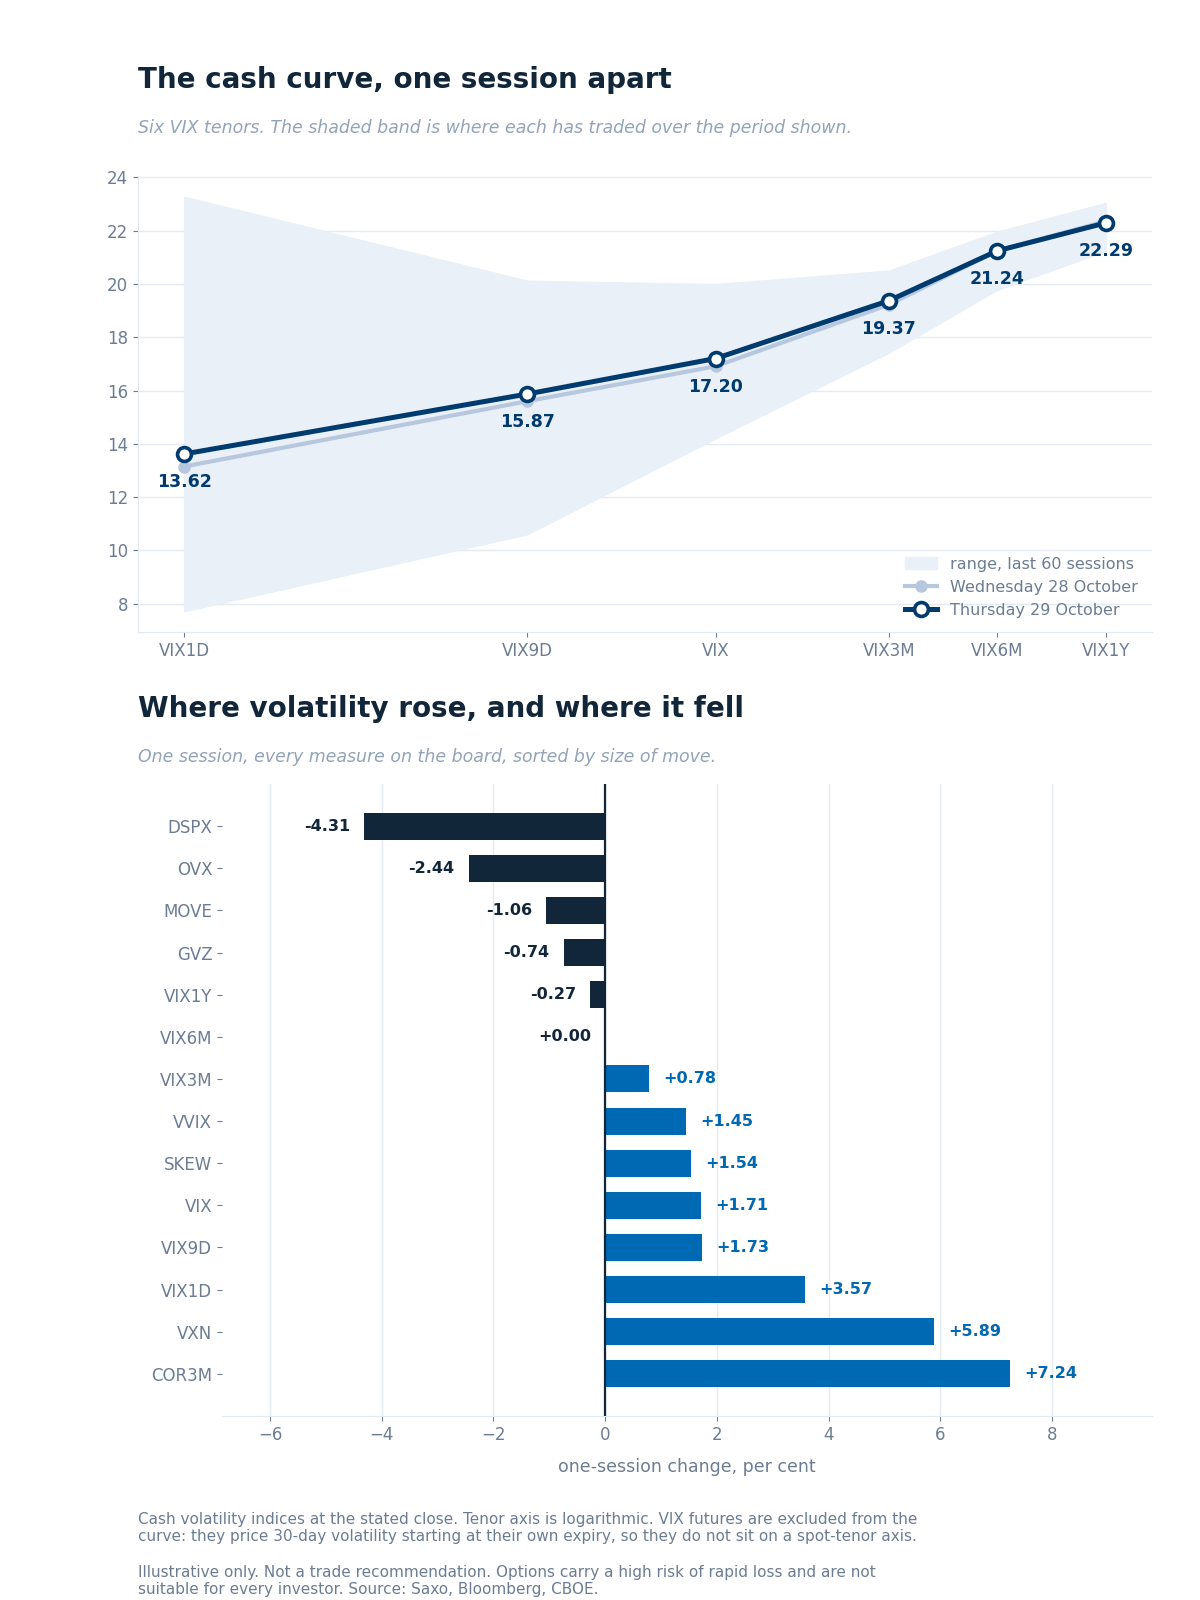
The cash curve against the previous session over each tenor’s 60-session range, with the one-session change across every measure. Illustrative only. Past performance is not indicative of future results. Source: Saxo, Bloomberg, CBOE.
The equity measures rose and the cross-asset ones eased. Implied correlation, a gauge of how closely stocks are expected to move together, gained 7.24% to 13.78, the 96th percentile of the 107 sessions in our store. The Nasdaq gauge rose 5.89% to 25.18. Dispersion, which prices how far index members are expected to move apart, fell 4.31% to 36.63, back to its median. In our view that pairing may be the day in one line: the spread between names that options had paid for arrived in Alphabet, and the premium for it came out once it had.
The headline gauge added 1.71% to 17.20, the 77th percentile, and the front day 3.57% to 13.62. The bond gauge eased 1.06% to 93.55, and gold volatility at 22.73 sits at the 11th percentile.
Ratios. VIX3M/VIX holds at 1.13, so the curve stays in contango. VXN/VIX rose to 1.46 from 1.41, and VIX1D/VIX to 0.79.
VIX futures. November reads 19.21 in overnight trade, above December at 19.01, which on that quote inverts the front of the futures curve. Put-call parity on the 18 November options, read later in the night, returns 18.66, below December. These are two timestamps, not a roll, so we draw no session comparison.
Tails. SKEW rose 1.54% to 151.03, above its 145.70 median.
Single-name volatility
The index measures above rose, but the names drained further. On a common set of 523 underlyings the median implied-volatility rank fell to 39.3 from 44.0 and the mean to 41.4 from 47.0, with the median percentile at 49.2. The comparison spans two sessions, because no reading was collected on the morning of 29 October.
Alphabet lost 43.2 points of rank to 24.4 and Microsoft 25.0 to 23.9. Both reported on Wednesday evening. One share price fell 12.64% and the other 0.16%, yet the ranks fell almost together. In our view what the options had been pricing was the event, and the event was over.
Amazon went the other way, up 5.8 points to 79.2, the 98th percentile of its year. That reading was taken at Thursday’s close, before its results.
At the index end the broad market fund sits at a rank of 13.2 and the small-cap fund at 11.6, against 40.7 for the Nasdaq 100 fund. By group, energy is richest at a median of 59.0 and metals cheapest at 17.7.
Implied-volatility rank and percentile from the Saxo screener, read at 02:23 CET on 30 October 2026. Source: Saxo.
Options flow sentiment
Based on end-of-day Thursday 29 October, yesterday’s positioning, not today’s price action.
- Single-name flow carried no readable direction. Alphabet dominated, as a structure in which buying and selling offset, which in our view may reflect an existing book being moved rather than a fresh view.
- Sector and ETF flow was readable in one place only, demand for long-dated Treasury exposure. Nine of the ten categories showed no direction.
Where the week's range sits
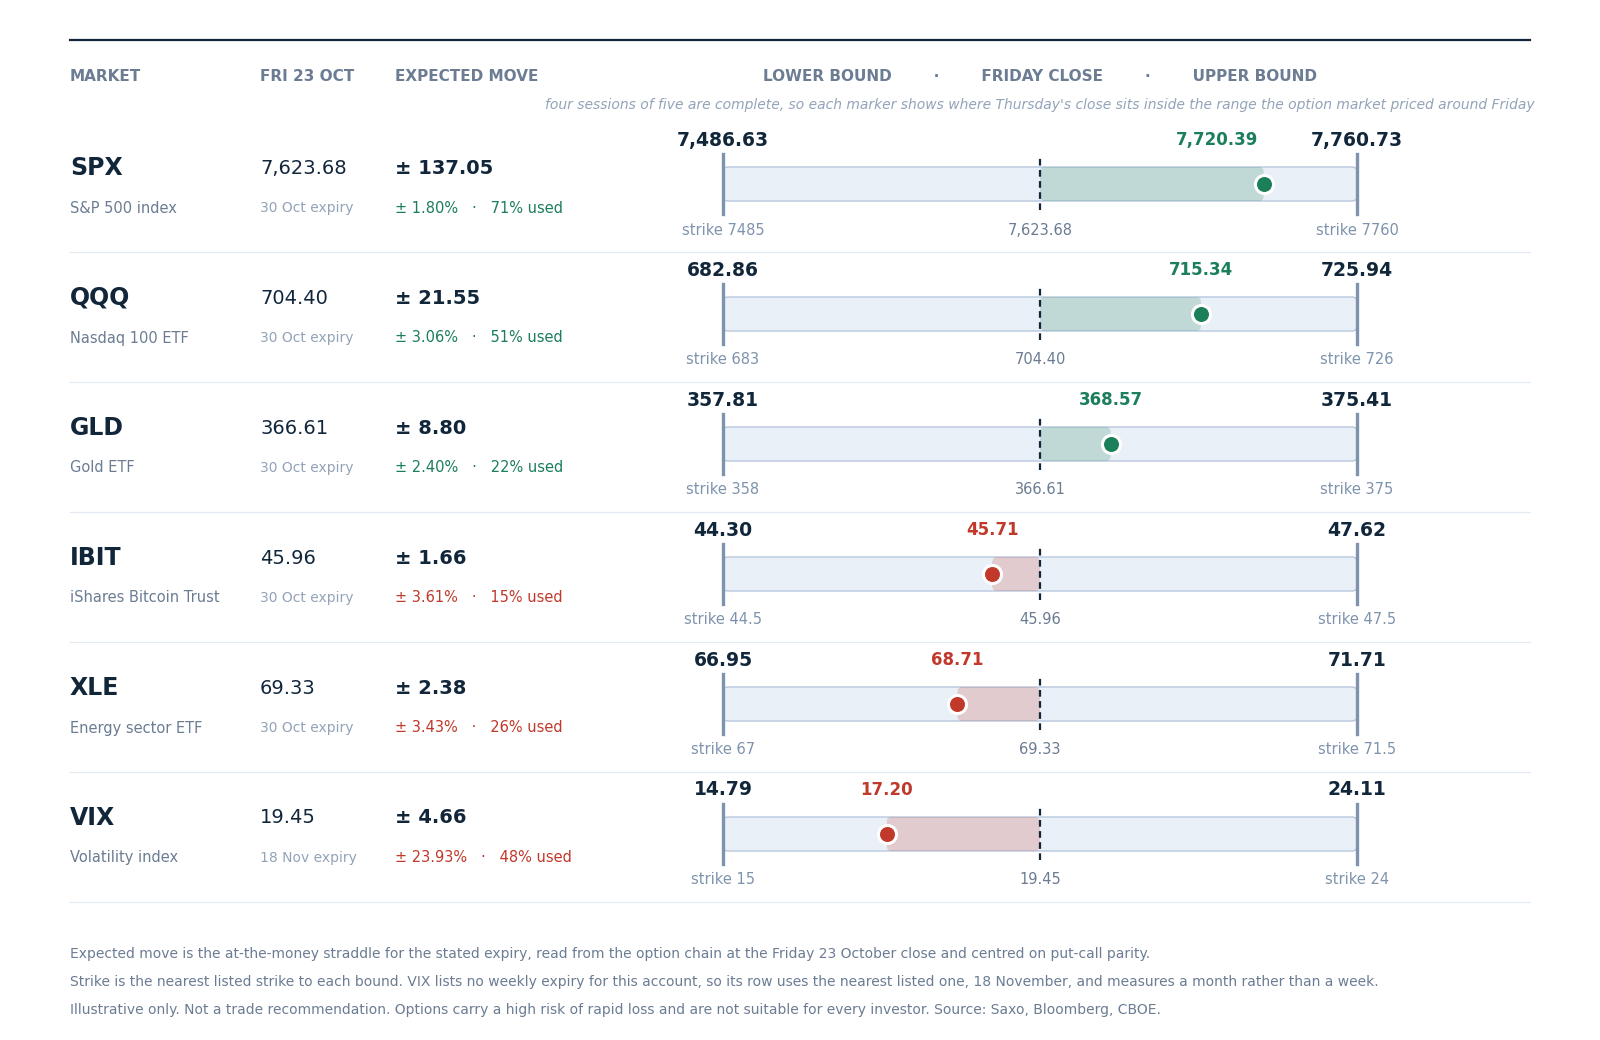
The range priced for the week around Friday 23 October’s close for six markets, with the nearest listed strike at each bound and where Thursday’s close sits inside it. Illustrative only. Past performance is not indicative of future results. Source: Saxo, Bloomberg, CBOE.
The Friday-close snapshot priced 137.05 points for the S&P 500 this week, 1.80% around Friday’s 7,623.68, a band from 7,486.63 to 7,760.73. Four sessions of five are done. Thursday’s close at 7,720.39 has used 71% of that band upward, down from 88% a session earlier, and the parity forward on today’s expiry, 7,683.80, would put it nearer 44%.
The Nasdaq 100 fund has given back more, 51% used from 98%. Gold has used 22% upward, energy 26% downward and the bitcoin fund 15% downward. The volatility row uses the 18 November expiry, so it measures a month rather than a week, and sits 48% below its anchor.
One session remains, and the top of the band sits 40 points above Thursday’s close. Options carry a high risk of rapid loss and are not suitable for every investor. Costs and charges apply and vary by account and venue; check the rates applicable to you.
Today's catalysts
- 10:00 CET German third-quarter growth, then at 11:00 CET euro-zone third-quarter growth and Italian October inflation.
- 13:30 CET Canadian growth, and at 14:00 CET German October inflation.
- 14:45 CET the Chicago purchasing managers’ index.
- Earnings today: Exxon Mobil, Chevron, AbbVie, AstraZeneca, BP, General Dynamics, Tokyo Electron and Kioxia.
- Next week: Apple and Palantir on Monday, AMD on Tuesday, Novo Nordisk on Wednesday, the 3 November vote and payrolls.
The US stays on summer time until Sunday, so today’s cash session runs 14:30 to 21:00 CET and today’s expiry settles at that close. Today is also the last session of October.
Earnings scorecard
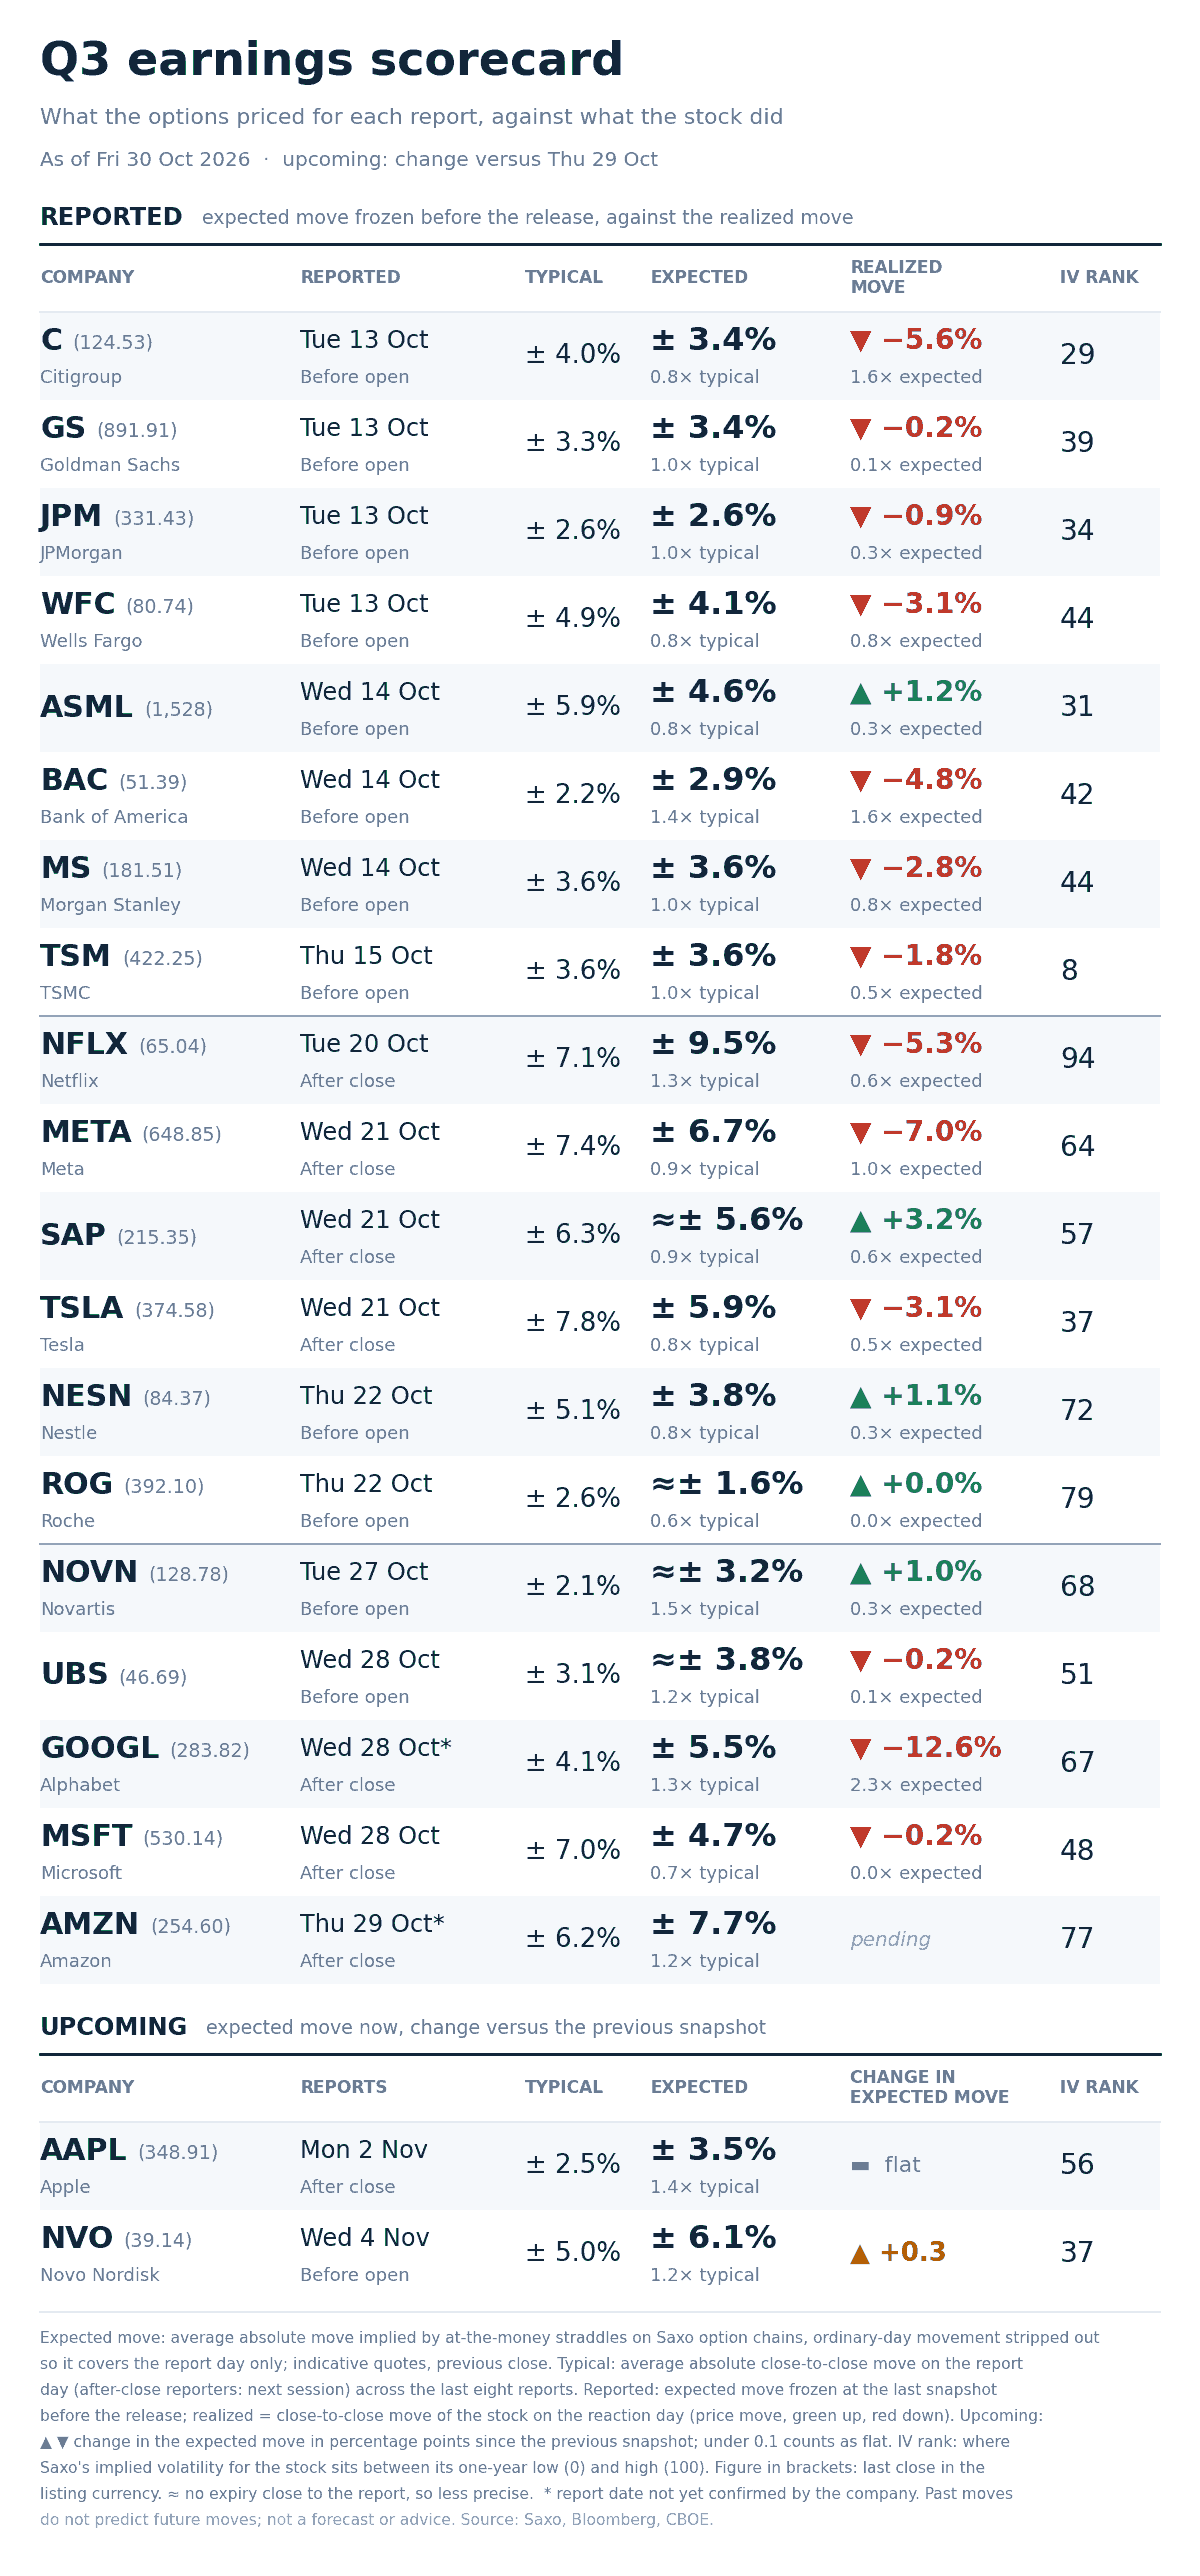
Option-implied expected move for each report day against the stock’s average move after its last eight reports, across the twenty-one names tracked this season. Past performance is not indicative of future results. Source: Saxo, Bloomberg, CBOE.
Nineteen of the twenty-one names have reported, and Wednesday evening produced both ends of the table. Alphabet was priced for 5.5% and moved 12.6%, 2.3x what the options expected and the largest multiple of the season. Microsoft was priced for 4.7% and moved 0.2%.
Amazon was priced for 7.7% against an eight-report average of 6.2%. It was down about 7% in late trade after its results, close to the priced move; its scorecard figure lands after today’s session.
Two names remain. Apple reports on Monday priced for 3.5% against 2.5%, 1.4x its own history and the richest on the board, on a rank of 56, so in our view its volatility is ordinary for its year while its event premium is not. Novo Nordisk reports on Wednesday at 6.1% against 5.0%, up 0.3 points overnight.
Options carry a high risk of rapid loss and are not suitable for every investor. Costs and charges apply and vary by account and venue; check the rates applicable to you.
What the market is pricing
- Session implied range: S&P 500 options price 49.10 points, 0.64%, for today’s expiry, which settles at the 21:00 CET close. Read before the US open, so indicative. The one-day gauge at 13.62 implies about 0.86%, a one-sigma figure rather than an expected move, so in our view the two do not disagree.
- Event repricing: on Wednesday the same expiry priced 88.30 points with three sessions to run, and decay alone would have left about 51.0. Today’s 49.10 sits about 1.9 points below that, so the option market took a little premium out of the week after Alphabet’s gap rather than adding to it.
- Next week: the same-morning Quick Take puts about 1.64% on the 6 November expiry, a window holding Apple, the 3 November vote and payrolls. The parity forward on today’s expiry, 7,683.80, already sits about 0.47% below Thursday’s close, which in our view may mean much of the late-trade reaction to Amazon and Intel is in the index before the open.
- Correlation read: implied correlation rose 7.24% to 13.78, the 96th percentile of our store, while dispersion fell back to its median. In our view the market may now price the next surprise to travel across the index more than it did on Thursday, when the equal-weighted index rose 1.21% against the headline’s fall.
In our view today tests whether Thursday’s split survives a second day: an equal-weighted market that rose while the largest names fell, and an option market that, on the correlation gauge, now leans the other way. Options carry a high risk of rapid loss and are not suitable for every investor. Costs and charges apply and vary by account and venue; check the rates applicable to you. Past performance is not indicative of future results.
| More from the author |
|---|