
Für den Zugriff auf die beiden Plattformen können Sie jeweils dasselbe Saxo-Konto verwenden.

Seventeen names where option premium stood out at September expiry
Options

Summary: One name’s options sat at the very top of their one year range while another’s sat effectively at the floor, and the cheap looking one was not cheap at all. Seventeen readings from the September expiry, and what a volatility number still cannot tell you.
A high IV rank is a statement about the price of optionality, not about which way the underlying is going.
Using the Saxo API, I set up a collector that records implied volatility, IV rank and IV percentile every night, one row per option underlying: the S&P 100 constituents plus 50 liquid ETFs in the US, and every euro-denominated stock option root in Saxo’s catalogue in Europe. It is not the whole market and it is not a signal service - it is a record of where option premium sat, one day at a time. This first edition covers the close of Friday 18 September 2026, which was also September monthly expiry (Source: Saxo platform, recorded 19 September 2026). Past performance is not indicative of future results.
The list is organised by what the two numbers were doing, not by conviction. Nothing here is a view on direction, and nothing here is a trade recommendation. Options carry a high risk of rapid loss and are not suitable for every investor.
Reading the two numbers together
IV rank places today’s implied volatility between the lowest and highest reading of the past year. IV percentile counts the share of days in that year when it closed below today’s level. The gap carries the information: rank far above percentile means one spike set the top of the range; rank far below percentile means an old extreme stretched the range while today’s reading is still higher than most days. Neither says anything about direction.
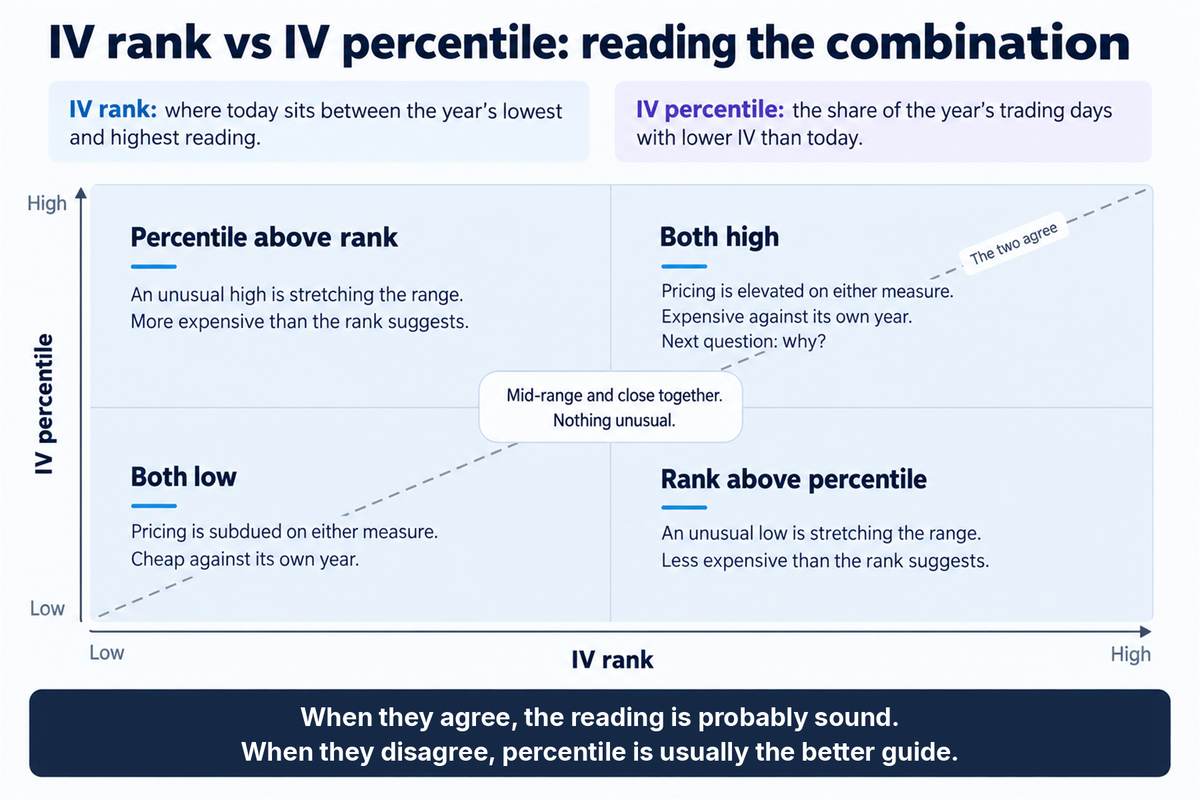 How IV rank and IV percentile measure different things. Source: SaxoTrader
This chart is illustrative and for educational purposes only; it is not predictive. Past performance is not indicative of future results.
All implied volatility, rank and percentile figures below: Source: Saxo platform, as of the 18 September 2026 close. Past performance is not indicative of future results.
Seventeen readings, grouped by what the two numbers were doing:
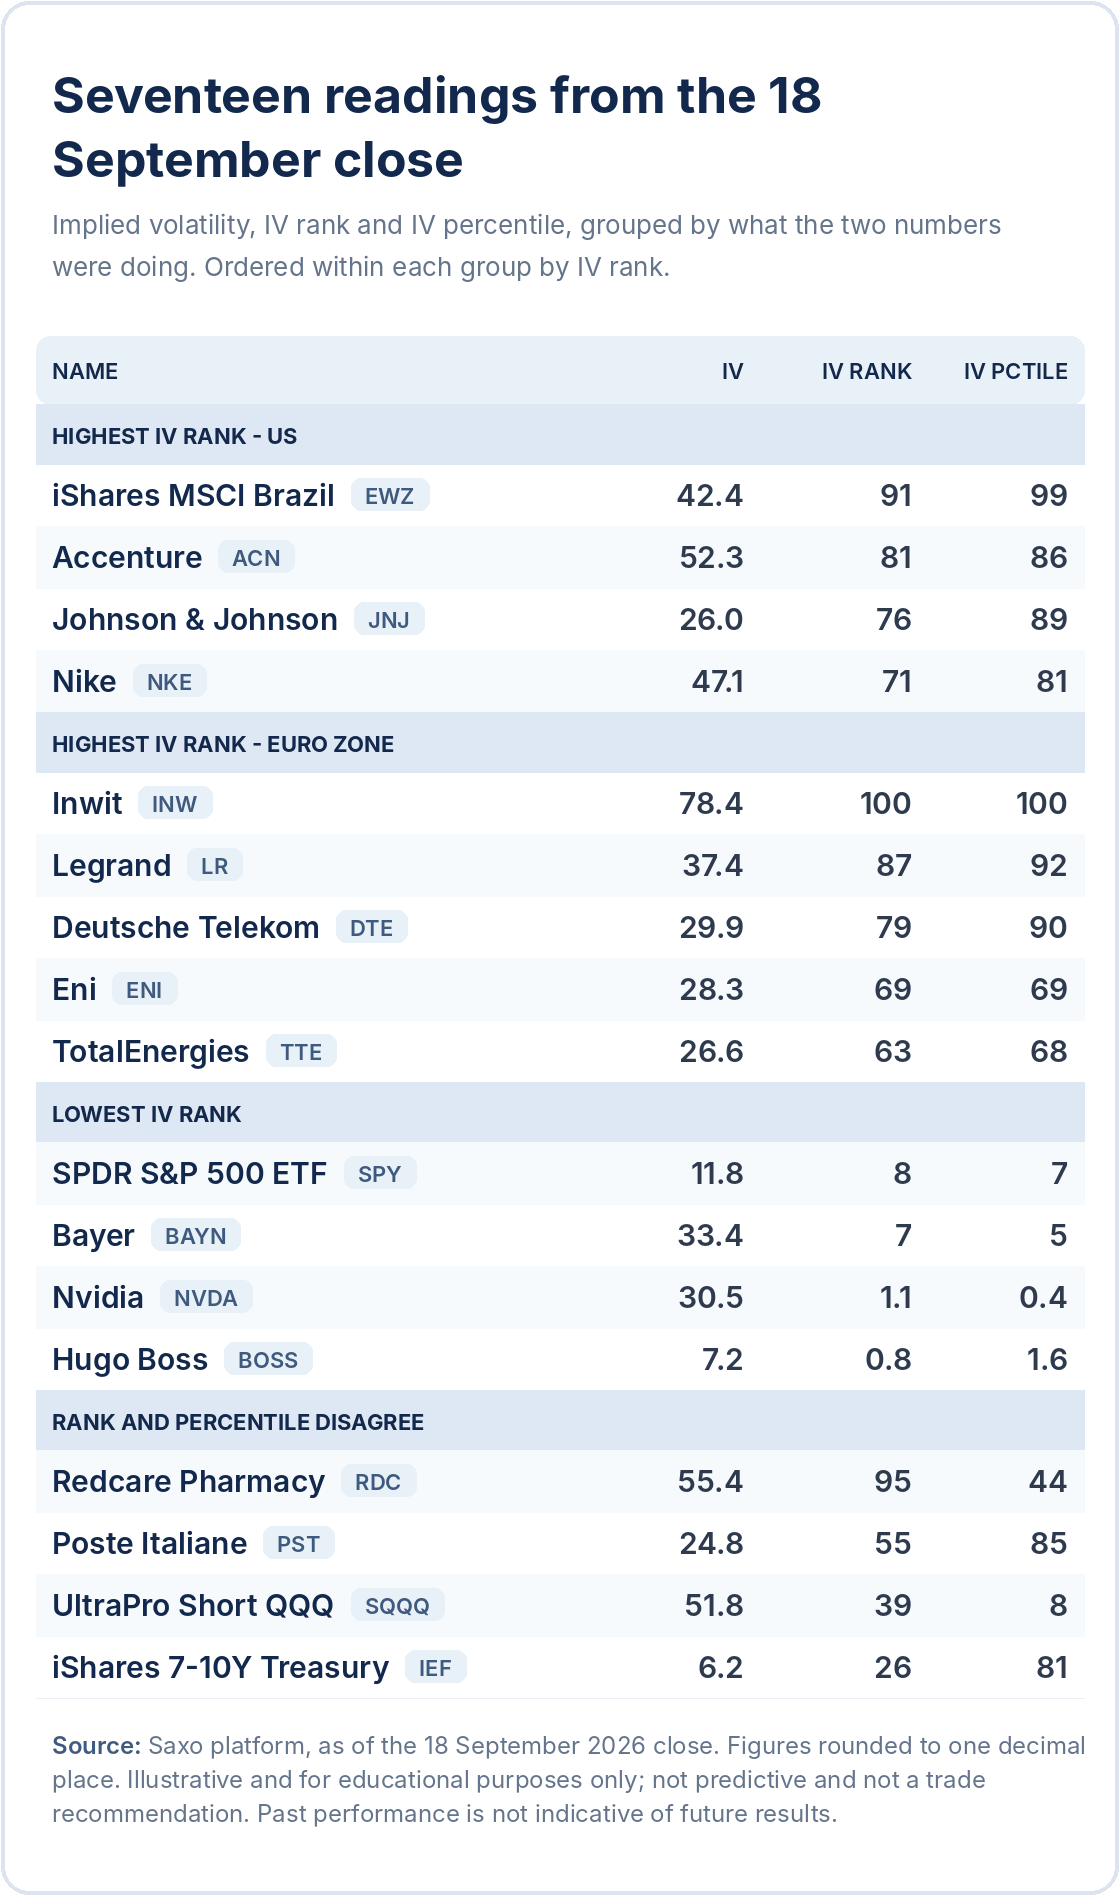 Implied volatility, IV rank and IV percentile for seventeen underlyings, 18 September 2026 close. Source: Saxo platform
This table is illustrative and for educational purposes only; it is not predictive and not a trade recommendation. Past performance is not indicative of future results.
Where implied volatility sat highest - US
The four US underlyings whose option premium sat nearest the top of its own one-year range.
Illustrative only, not trade recommendations. Options carry a high risk of rapid loss and are not suitable for every investor.
- iShares MSCI Brazil ETF (EWZ) - IV 42.4, rank 91, percentile 99. Rich on both measures, which in our view may point to a premium that has been building rather than one that a single session set. Brazil’s general election is scheduled to hold its first round on 4 October, with a runoff on 25 October if required (Source: Brazil’s official electoral calendar). Costs and charges apply; see Saxo pricing for full details.
- Accenture (ACN) - IV 52.3, rank 81, percentile 86. Scheduled to report full-year fiscal 2026 results before the open on 1 October 2026 (Source: company announcement).
- Johnson & Johnson (JNJ) - IV 26.0, rank 76, percentile 89. Low in absolute terms, yet higher than roughly nine days in ten of the past year.
- Nike (NKE) - IV 47.1, rank 71, percentile 81. Scheduled to report after the close on 1 October 2026 (Source: company announcement), the same day as Accenture, which puts two of these four events on one date.
Where implied volatility sat highest - euro zone
The euro-zone side, filtered to names carrying at least seven listed expiries and already elevated two sessions before the September expiry - with Inwit the deliberate exception on both counts.
Illustrative only, not trade recommendations. Options carry a high risk of rapid loss and are not suitable for every investor.
- Inwit (INW) - IV 78.4, rank 100, percentile 100. The highest reading in the screen. Implied volatility rose roughly 27 points in three sessions while the share price moved about one percent (Source: Saxo platform, as of the 18 September 2026 close). Only five listed expiries, so the quoted level rests on a thin book and should be read with that in mind.
- Legrand (LR) - IV 37.4, rank 87, percentile 92. High and consistent on both measures, which in our view appears to reflect a persistent premium rather than an event spike.
- Deutsche Telekom (DTE) - IV 29.9, rank 79, percentile 90. Elevated on both measures and already above its median two sessions earlier, so the level does not rest on a single day.
- Eni (ENI) - IV 28.3, rank 69, percentile 69. Rank and percentile almost identical, in our view the cleanest of these readings, with no distortion from an old spike.
- TotalEnergies (TTE) - IV 26.6, rank 63, percentile 68. Together with Eni, and Repsol at rank 66, European energy premium sat consistently above its own one-year median rather than in one name alone.
Where implied volatility sat lowest
A low reading is not an invitation to buy options. It may simply reflect an absence of scheduled catalysts, and implied volatility can stay low for long stretches.
Illustrative only, not trade recommendations. Options carry a high risk of rapid loss and are not suitable for every investor.
- SPDR S&P 500 ETF (SPY) - IV 11.8, rank 8, percentile 7. Index-level premium sat near the bottom of its one-year range into expiry. Costs and charges apply; see Saxo pricing for full details.
- Bayer (BAYN) - IV 33.4, rank 7, percentile 5. A high absolute number, yet near the bottom of this name’s own range - a reminder that rank is always relative to the underlying’s own history, not to the market’s.
- Nvidia (NVDA) - IV 30.5, rank 1.1, percentile 0.4. Effectively the floor of its own one-year range. Its next results are not expected until November, which leaves the front two expiries without a scheduled company catalyst.
- Hugo Boss (BOSS) - IV 7.2, rank 0.8, percentile 1.6. The lowest reading in the euro-zone set with a reasonably complete expiry list.
When rank and percentile disagree
These four are here precisely because the two numbers point in opposite directions. The gap between them, rather than the level of either, is where the information sits.
Illustrative only, not trade recommendations. Options carry a high risk of rapid loss and are not suitable for every investor.
- Redcare Pharmacy (RDC) - IV 55.4, rank 95, percentile 44. Near the top of its range while only slightly above its median day, which may indicate a high set recently rather than one the name has lived at.
- Poste Italiane (PST) - IV 24.8, rank 55, percentile 85. The mirror image, and a reminder that a mid-table rank can still mean premium is historically full.
- UltraPro Short QQQ (SQQQ) - IV 51.8, rank 39, percentile 8. A mid-range rank on a range set by an earlier spike, while the reading itself sat below roughly eleven days in twelve. Leveraged and inverse ETFs are complex products and are not suitable for every investor. Costs and charges apply; see Saxo pricing for full details.
- iShares 7-10 Year Treasury Bond ETF (IEF) - IV 6.2, rank 26, percentile 81. A modest rank, but implied volatility above roughly four days in five. Costs and charges apply; see Saxo pricing for full details.
What this screen does not tell you
Four limitations bound everything above.
- It says nothing about direction. A high IV rank is consistent with the market pricing a large move up, a large move down, or simply an uncertain one.
- It is a single day. The store began collecting on 17 September 2026, so no five-day rank momentum exists yet. Comparisons across the 18 September expiry are awkward too: for most euro-zone names the previous reading came off a contract expiring that same day, so a jump across that boundary should not be read as a volatility event without corroborating news. Every euro-zone name above was checked for whether it was already elevated two sessions earlier; those that were not are left out.
- It does not measure liquidity. Bid-offer width, open interest and the number of listed expiries decide whether any of this is tradeable, and none appear in a rank number. The euro-zone names above carry at least seven listed expiries, Inwit excepted.
- It is not always a comparison of like with like. The screen records one headline implied volatility per underlying, and the front expiry ranged from two days to ninety on this date. Air Liquide’s sat against a December contract while most of the book sat on October, so it was excluded rather than compared.
Building your own record
The readings in this article come from Saxo’s OpenAPI, which returns implied volatility, rank and percentile for option underlyings - for traders who want to pull them into their own tools, for instance to keep a daily record of how a rank has moved. We will cover that route in the webinar Using AI and OpenAPI to elevate your Saxo platform experience on 4 November 2026 at 13:00 CET.
Final thoughts
The value of a screen like this is not that it finds trades, but that it separates two questions traders routinely collapse into one: how much a market is moving, and how much movement is already in the price.
A reading near the top of its range says optionality is expensive relative to the past year - and expensive things can become more expensive, which is why a high rank is not a sell signal. Cheap premium, equally, can stay cheap for months. In our view the screen’s real use is as a filter for which names deserve a closer look at the chain itself, where bid-offer spread, open interest and the catalyst calendar do the actual work.
Options carry a high risk of rapid loss and are not suitable for every investor. Future outcomes are uncertain and may result in losses. See Saxo pricing for costs and applicable charges: https://www.home.saxo/rates-and-conditions/pricing-overview
| Related articles/content |
|---|
| Finding unusually expensive or cheap options in the Saxo screener | 18 Sep 2026 Implied volatility rank what it measures and what it misses | 11 Sep 2026 Nine prints later what Q2 earnings season taught us | 11 Aug 2026 Defined risk is not small risk what the contract multiplier decides | 12 Aug 2026 What IV crush really means in practice reviewed version | 9 April 2026 Trading earnings with defined | 31 Mar 2026 -- Cheap at the money dear in the tail - Options Brief - 21 September 2026 Front vol empties correlation cracks - Options Brief - 18 September 2026 |
| More from the author |
|---|