
Für den Zugriff auf die beiden Plattformen können Sie jeweils dasselbe Saxo-Konto verwenden.

Correlation returns, the index follows - Options Brief - 19 October 2026
Options 10 minutes to read

Summary: The index fell one per cent on Friday while the equal-weighted version fell four tenths. Index volatility set a sixty-session high anyway, and the typical stock barely moved. Something other than risk repriced.
Index volatility set a sixty-session high; the typical stock did not.
MARKET REGIME: NEUTRAL / CHOP | VIX 19.99 | TERM STRUCTURE: CONTANGO | SKEW: ELEVATED (168.59) | FRONT-MONTH VIX FUTURES: 18.50
Key findings
- Correlation did the work, not breadth. Implied correlation rose 16.11% to 13.98, a sixty-session high, while the equal-weighted S&P 500 fell 0.40% against the index’s 1.09%.
- The index repriced, its components did not. VIX rose 21.45% to 19.99; median one-year implied volatility across an identical set of 187 US names moved from 33.38% to 33.70%.
- Seven measures set sixty-session highs, all index-level. The bond, gold and oil gauges did not.
- Widest earnings premium against own history: UBS 2.0x, Apple 0.6x.
Headline driver
Chipmakers recorded their longest losing streak since 2008 as investors questioned the scale and the financing of artificial-intelligence infrastructure spending, capping Wall Street’s worst week in months. The Nasdaq 100 fell 2.50%, the S&P 500 1.09% and the Dow 0.34%.
Two macro releases cut the other way. Federal Reserve Chair Warsh said hotter inflation had not changed his outlook, which was read as reducing the odds of an increase on 28 October. September industrial production rose 0.7% on the month against 0.4% expected, the most in five months, with capacity utilisation at 76.9%.
In our view the session was not a growth scare but a concentration event. Money left the chipmakers for European defensives, energy and utilities, and the index fell anyway because the part that moved carries the most weight. Options carry a high risk of rapid loss and are not suitable for every investor.
Market snapshot
Levels are as of the 06:00 CET snapshot on 19 October 2026. US and European figures are the Friday 16 October close; Asian figures are Monday’s session.
- US (Friday 16 October close): S&P 500 7,659.44, down 1.09%. Nasdaq 100 29,187.55, down 2.50%. Dow 52,007.21, down 0.34%. The equal-weighted S&P fell 0.40% and the Russell 2000 fund 1.69%. Meta fell 3.72%, Alphabet 2.47% and Nvidia 1.43%; Apple rose 0.43%. The software fund lost 4.80%, semiconductors 3.41%. Energy rose 2.52%, utilities 1.34%.
- Europe (Friday 16 October close): Stoxx Europe 600 up 0.72% to 644.75, its strongest week against the S&P 500 since April 2025. The DAX rose 0.95% and the Euro Stoxx 50 0.58%, led by banks.
- Asia (Monday session): the Nikkei 225 narrowed its loss to about 0.7% and the Kospi recovered to 0.6% higher after Chinese third-quarter growth of 4.5% beat. Hong Kong was closed.
- Commodities and rates: Brent trades near 108 after a five-month high around 110 last week on Middle East supply disruption. Spot gold is 0.2% higher near 4,175. The 10-year Treasury yield rose 2.4 basis points to 5.087% on Friday and reads 5.065% now, the 2-year 4.721%. S&P 500 futures were 0.80% higher at the snapshot, easing to about 0.5% by 08:40 CET.
- Market regime: Neutral and choppy. VIX 19.99, 20-day realised volatility 10.19% and stable, the index 0.61% below its 50-day average.
Past performance is not indicative of future results. Source: Saxo, Bloomberg, CBOE.
Volatility surface
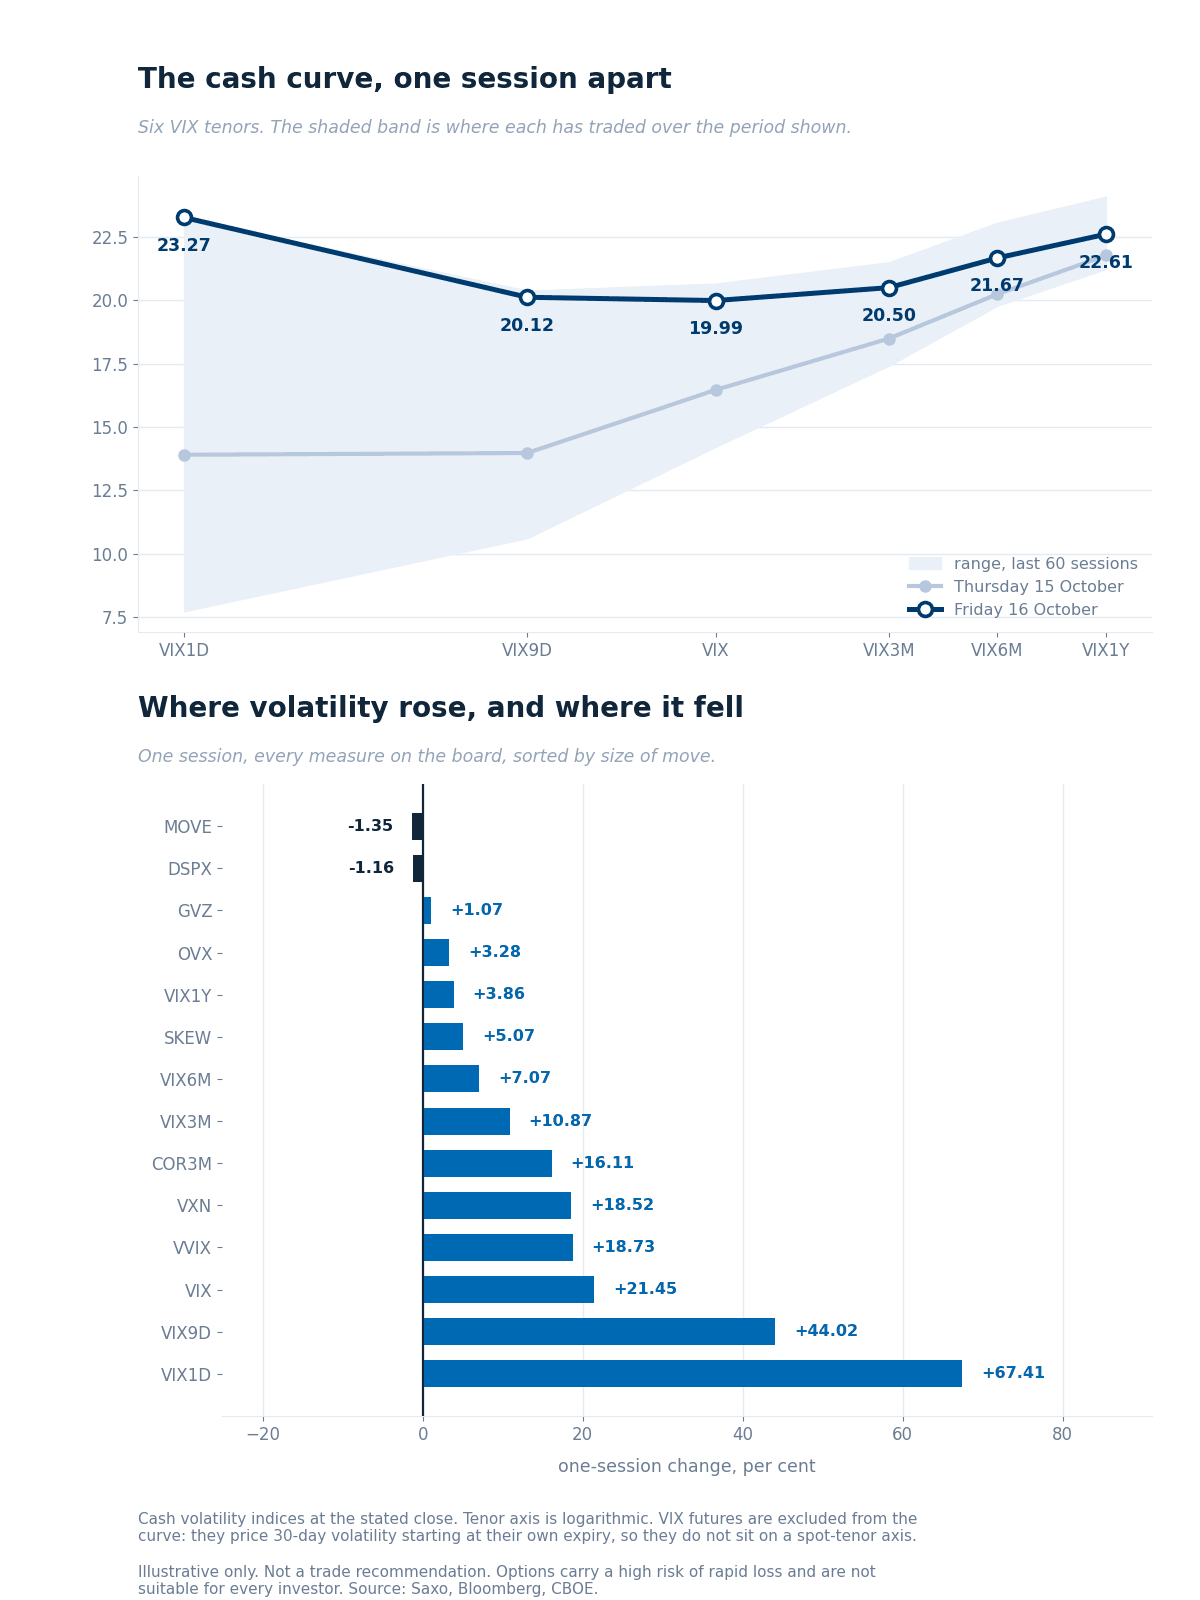
The cash curve against the previous session, over each tenor’s 60-session range, with the one-session change across every measure on the board. Source: Saxo, Bloomberg, CBOE.
The front end inverted and the back end barely noticed. VIX1D rose 9.37 to 23.27 and the nine-day measure 6.15 to 20.12, both above the 30-day 19.99, while the one-year added 0.84 to 22.61. Four of the six cash tenors set sixty-session highs, as did VVIX at 109.91.
Ratios. VIX1D/VIX sits at 1.16, the inversion in one number. VIX3M/VIX fell to 1.03 from 1.12 as the front caught the back. VXN/VIX eased to 1.36, and the Nasdaq gauge at 27.13 is the one index measure not at a new high.
VIX futures. The October contract reads 18.50 this morning against spot at 19.99, having closed Friday at 19.24 after adding 1.32 while spot added 3.53. Spot rising faster than the future is what inverts the basis. The 21 October option expiry gives a parity forward of 19.87, consistent to 0.05 across the five nearest strikes, read on indicative pre-open quotes; a session ago the same expiry gave 17.47 at a premium to spot of 1.01, against a discount of 0.12 now.
Rates and correlation. The bond gauge eased 1.35% to 101.11 and gold volatility sits near its sixty-session floor, so nothing outside equities repriced. Three-month implied correlation rose 16.11% to 13.98, a sixty-session high, while dispersion fell 1.16% to 36.61.
Single-name volatility
Saxo’s one-year implied-volatility ranks, read at Friday’s close across 187 US names, show a distribution that shifted up without the levels moving much.
- The rank moved, the level did not. On an identical set of names, so the comparison needs no caveat, the median rank rose to 49.2 from 43.9 while the median implied volatility moved only from 33.38% to 33.70%. Rank measures distance from the year’s extremes, so a small absolute move lifts many names at once when they have been sitting in a narrow band.
- Both ends shifted the same way. Names below rank 20 fell from 15.0% of the set to 10.2%, and names above 70 rose from 14.4% to 19.8%. That is the whole distribution sliding up, not the tails fattening.
- The gap against the index is the point. Index implied volatility rose 21.45% on the session. The typical single name rose under 1%. Almost all of the index move is therefore in the correlation term rather than in what the components cost.
- Europe went the other way. Across 337 names on an identical set the median rank fell to 43.5 from 46.2 and the median implied volatility eased to 32.13% from 32.58%, which fits a session European markets closed higher and before the US selloff deepened.
Past performance is not indicative of future results. Source: Saxo.
Options flow sentiment
Based on end-of-day 16 October, yesterday’s positioning, not today’s price action.
All ten reports read as structure rather than conviction: expiry rolls, paired legs and mid-market prints, with both calls and puts bought and sold across the large technology names. Treat it as neutral.
One line is worth naming because it is the only readable index-level side: buyer-initiated put protection in the Nasdaq 100 fund, mostly spread-financed. That is hedging demand, not a directional bet.
Where the week's range sits
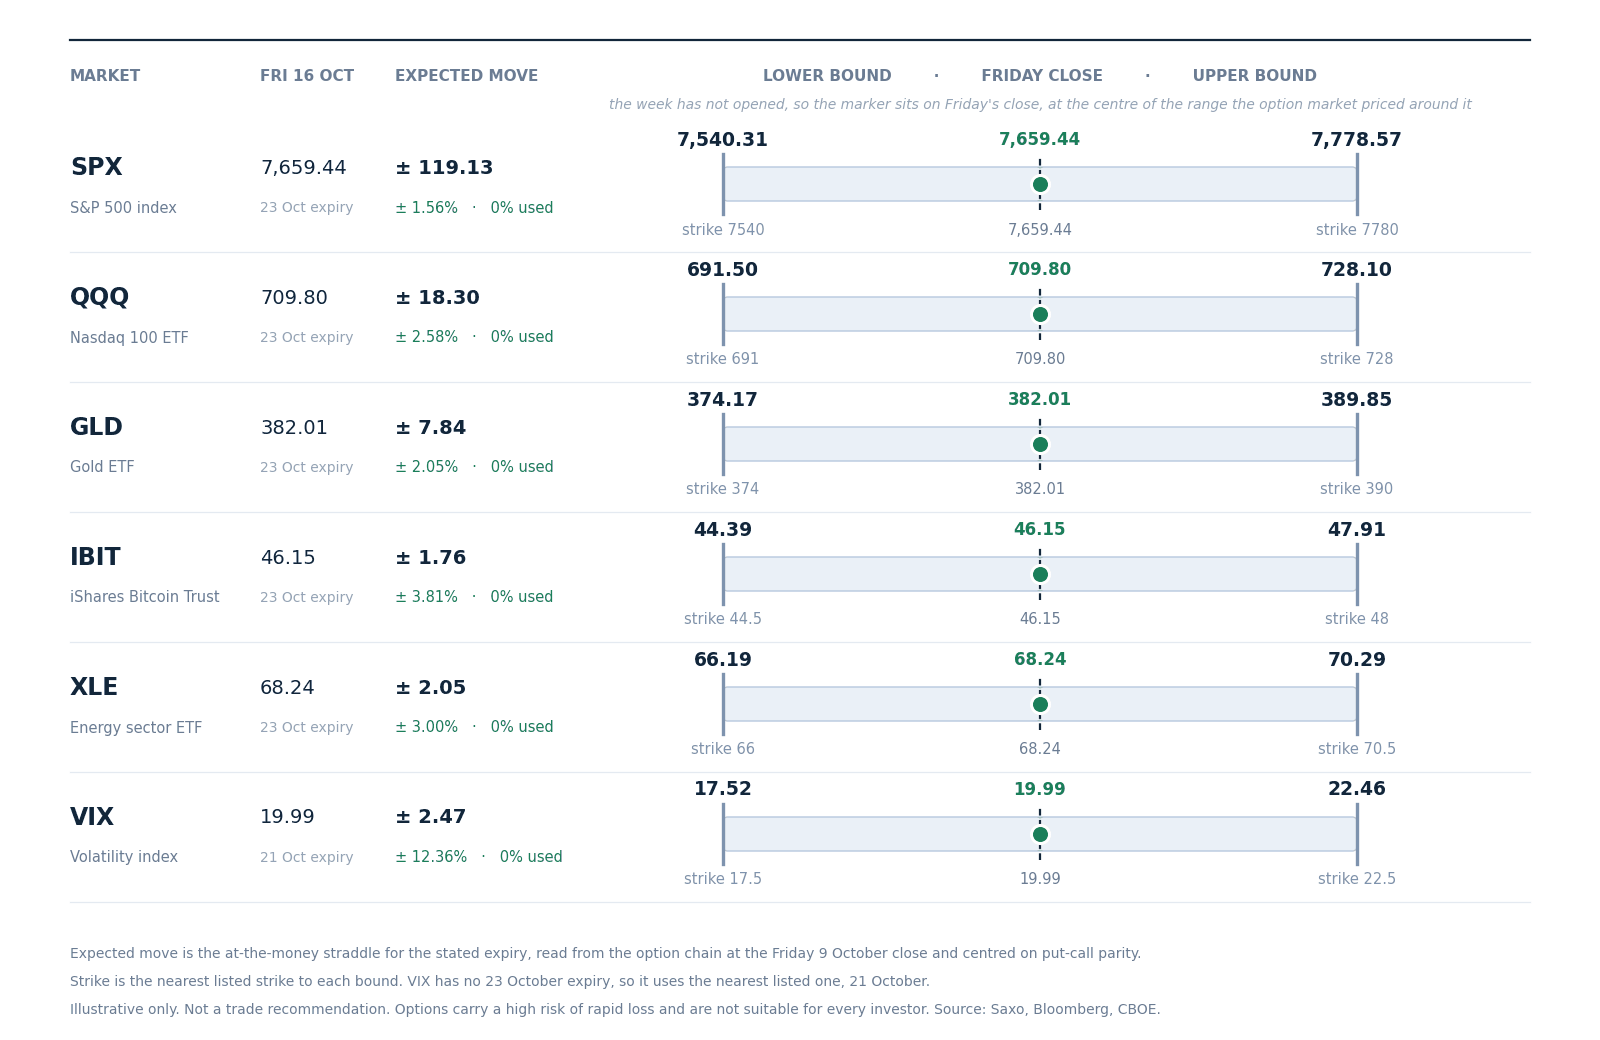
The range the option market priced for this week around Friday 16 October’s close, with the nearest listed strike at each bound. The week has not opened, so the marker sits on Friday’s close. Figures are at-the-money straddles read from the Saxo chain at Friday’s close and centred on put-call parity. Illustrative only, not a trade recommendation. Source: Saxo, Bloomberg, CBOE.
The week opens with a wider band than the last one. The S&P 500 carries 119.13 points, 1.56%, against 82.80 points and 1.06% a week ago, so the priced week is 47% wider on the same six markets and the same method. The Nasdaq 100 fund is priced for 2.58%, gold for 2.05%, energy for 3.00% and bitcoin’s fund for 3.81%.
Two features matter. The 23 October expiry stops before the 28 October Federal Reserve decision, so none of this band pays for the meeting, and the VIX row uses the 21 October expiry, the nearest listed, covering only the week’s first three sessions.
Options carry a high risk of rapid loss and are not suitable for every investor. Costs and charges apply and vary by account and venue; check the rates applicable to you before entering any position.
Today's catalysts
- Canadian September consumer prices at 14:30 CET, the only scheduled release of note, with the US housing market index at 16:00.
- No US data of consequence, which leaves the session to the earnings run-in and to whether the chip selloff stabilises.
- Earnings today: Fifth Third Bancorp and Steel Dynamics, before a heavy week.
- The week ahead: Netflix, GE Aerospace and General Motors on Tuesday, then Meta, Tesla, SAP, IBM and Texas Instruments on Wednesday, with the Federal Reserve decision on 28 October.
Earnings scorecard
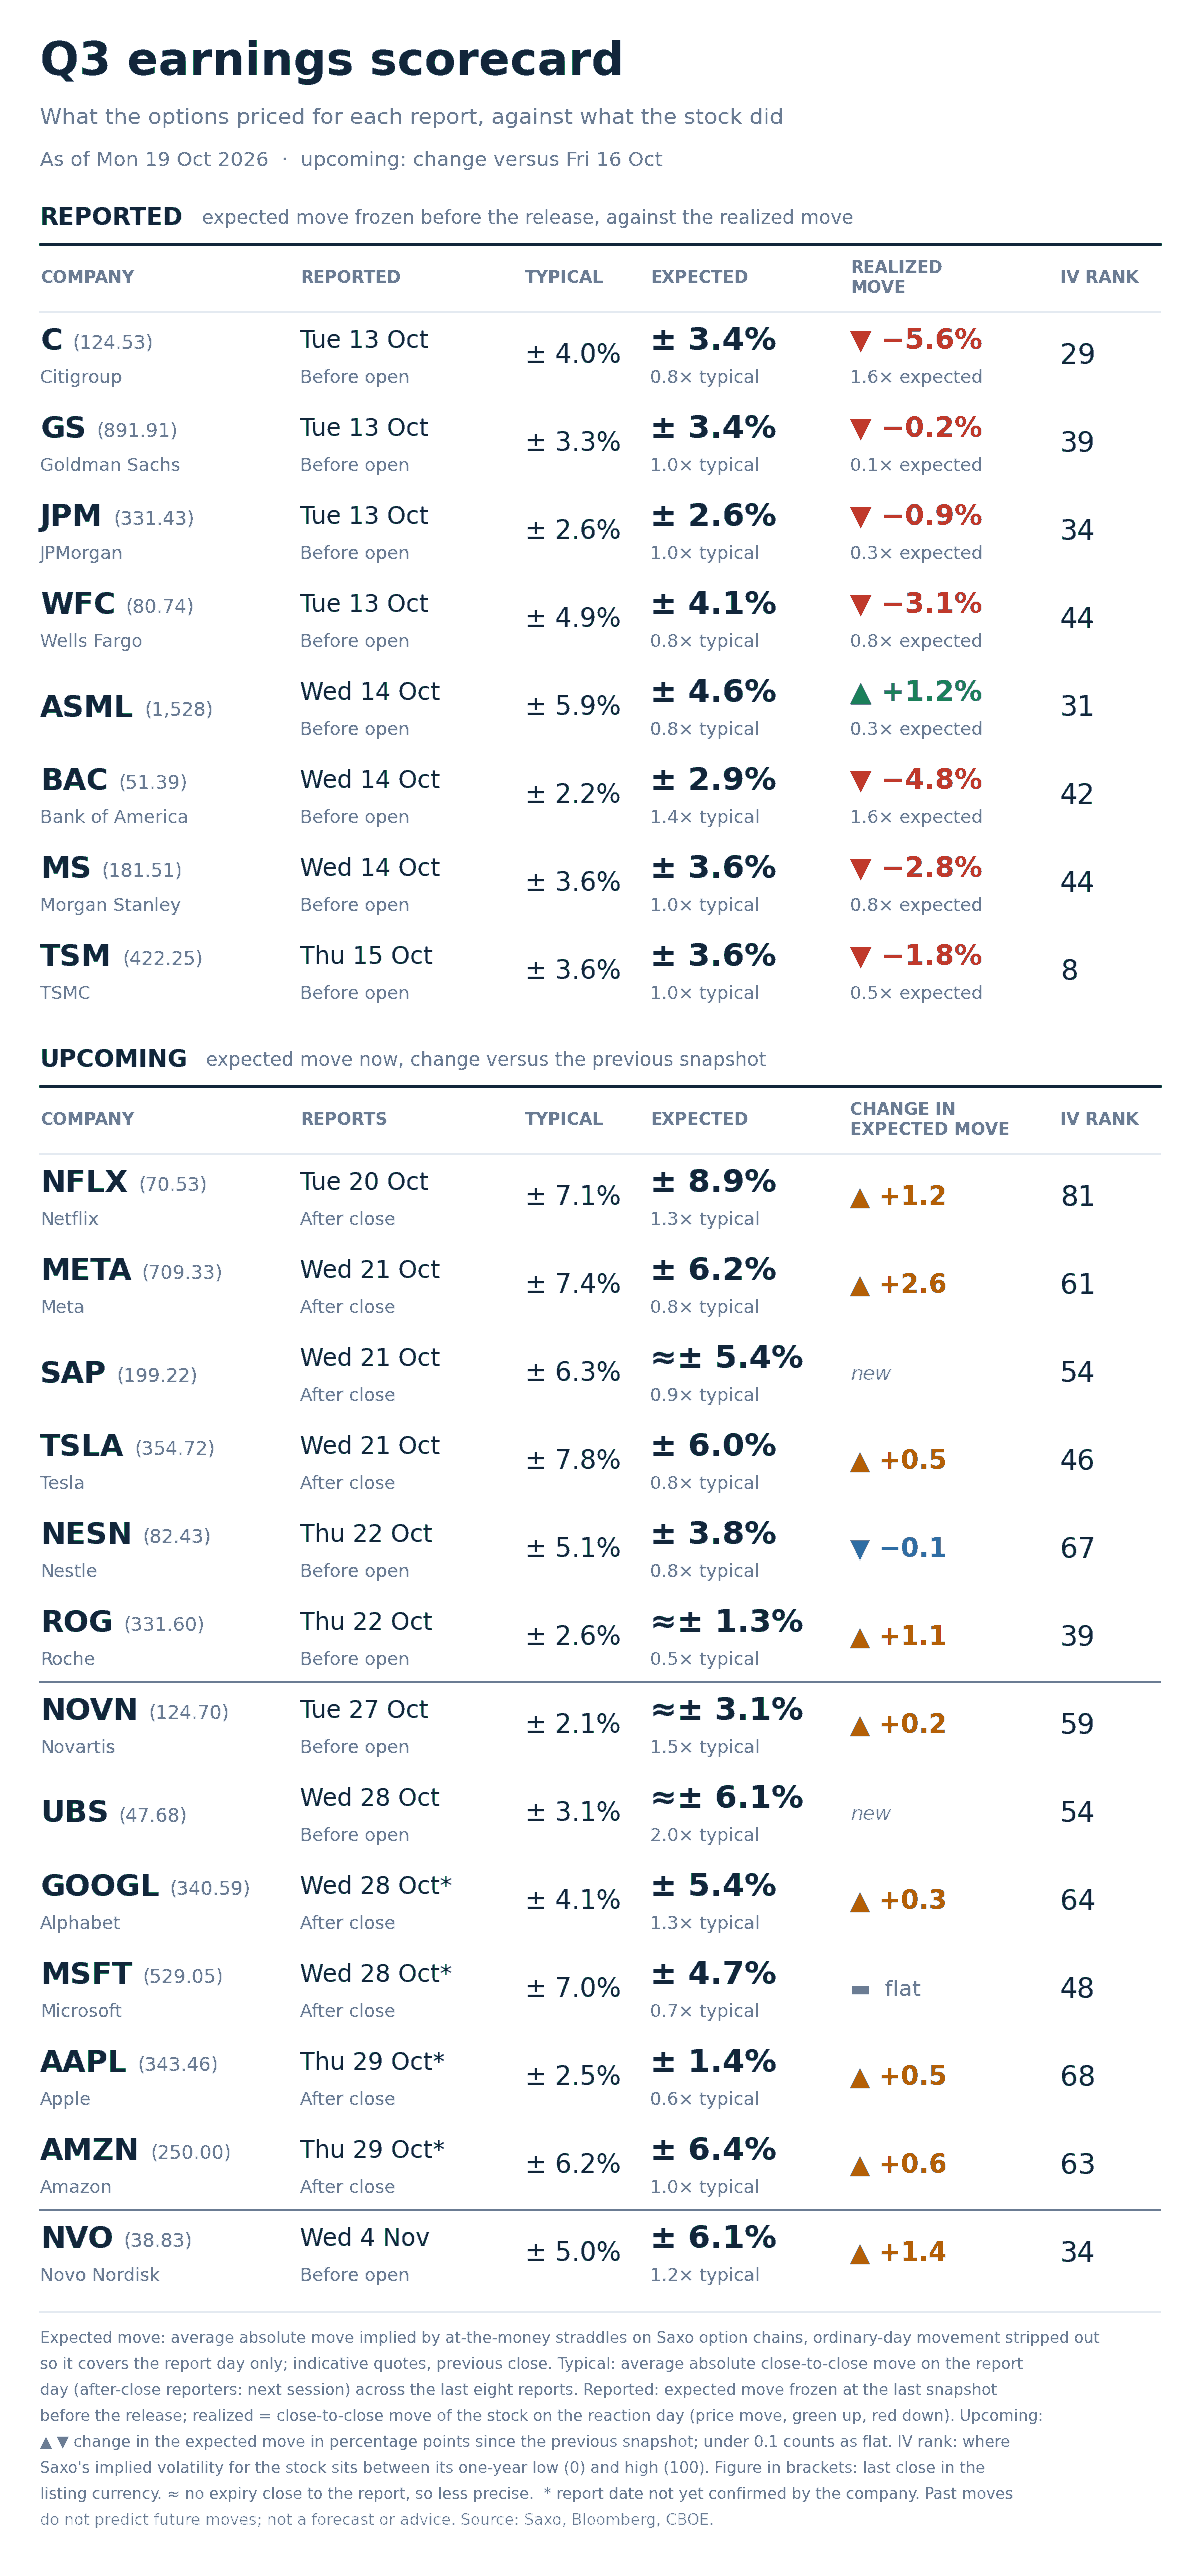
Option-implied expected move for each report day against the average move after the last eight reports, as of 19 October 2026. Illustrative only, not a trade recommendation. Source: Saxo, Bloomberg, CBOE.
- The widest premiums against own history are the European banks and Alphabet. UBS prices about 6.1% against a 3.1% eight-report average, 2.0x, and Alphabet 5.4% against 4.1%. At the other end Apple prices 1.4% against 2.5%, 0.6x.
- Rank and event premium answer different questions. Netflix carries an implied-volatility rank of 81 and prices the board’s highest expected move, 8.9%. Apple carries 68 and prices 1.4%. Rank measures the level against the name’s own year; the expected move measures what one day costs.
What the options market taught us: ASML
Ahead of ASML’s results on 14 October, we looked at the move its options were pricing. The results came and went quietly. The days around them did not.
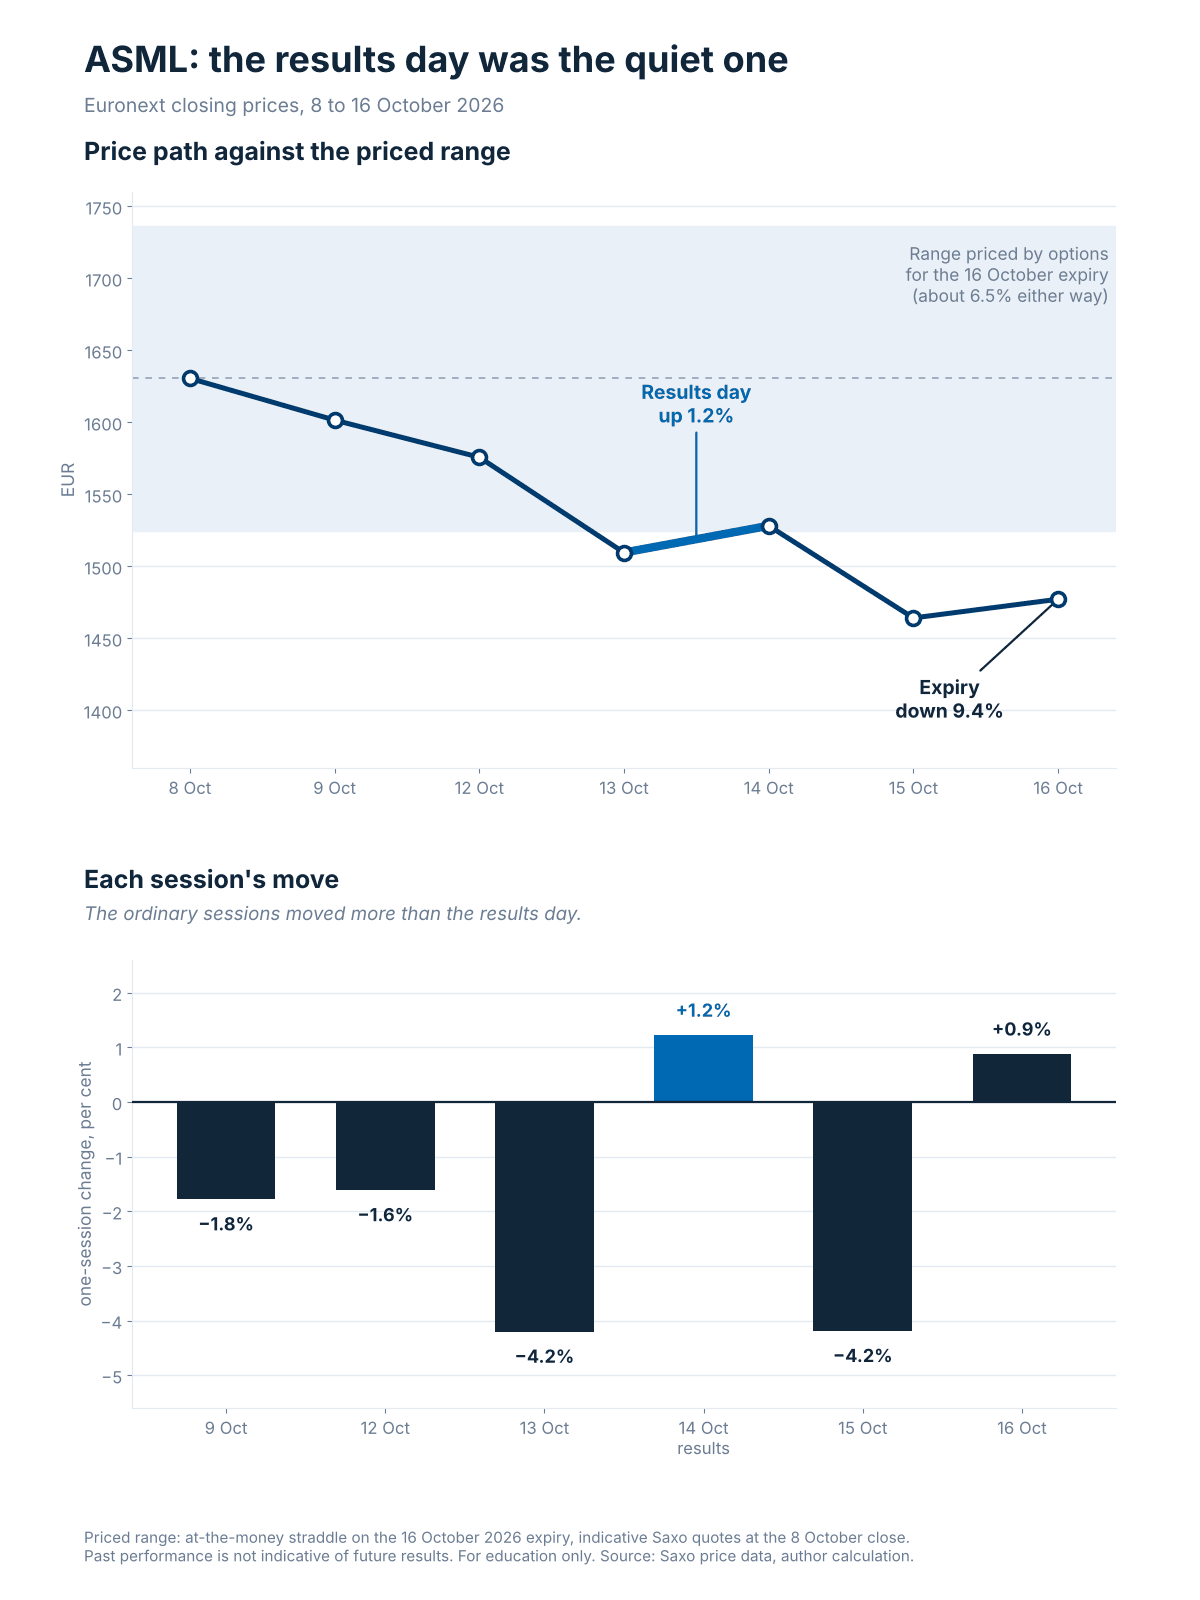
ASML closing prices from 8 to 16 October 2026 against the range priced by options for the 16 October expiry, and each session’s move. Past performance is not indicative of future results. For education only. Source: Saxo price data, author calculation.
- What the options priced: a move of about 6.5% by the 16 October expiry.
- The results day itself: up 1.2%.
- The full stretch to expiry: down 9.4%, most of it in the sessions before and after the report, as chip stocks sold off.
The lesson is in what that 6.5% measured. An option does not know which day the news arrives; its price covers every trading day until expiry. Here the report was the calm part and ordinary days did the moving. So when reading a priced earnings move, it helps to count the days it covers and ask what else happens in them.
- Next up: Netflix on 20 October, Meta, SAP and Tesla on 21, Nestle and Roche on 22.
Options carry a high risk of rapid loss and are not suitable for every investor. Costs and charges apply and vary by account and venue; check the rates applicable to you before entering any position.
What the market is pricing
- Session implied range: today’s expiry prices 61.5 index points, 0.80%. Friday’s priced 41.65 points, 0.54%.
- Event implied range: the 23 October expiry prices 118.3 points, 1.54%. It priced 100.25 points on Friday with six sessions to run and has five now, where decay alone leaves about 91.5, so roughly 27 points went in beyond what the clock explains.
- Correlation read: implied correlation rose 16.11% to 13.98 while dispersion fell 1.16% to 36.61, the mirror of Thursday. Six-month realised correlation across S&P names sits at 0.01, the lowest since 2001, so index volatility had an unusually low base to reprice from.
- Tail risk signal: SKEW rose 5.07% to 168.59, above all 60 stored sessions, and the tail-risk gauge 48.98%. Far downside protection got dearer alongside the whole front end.
In our view the question is whether the components keep moving together. Index volatility at 19.99 against 20-day realised volatility of 10.19% suggests the option market may be paying for correlation the tape has not yet delivered, and a sixty-session high leaves correlation less room to rise. This week’s expiry stops before the Federal Reserve decision, so the band pays for earnings and the chip trade, not the meeting.
Options carry a high risk of rapid loss and are not suitable for every investor. Costs and charges apply and vary by account and venue; check the rates applicable to you before entering any position. Past performance is not indicative of future results.
This material is produced for informational and educational purposes only and does not constitute investment advice or a recommendation to buy or sell any instrument. Options involve significant risk and are not suitable for all investors. Figures quoted are derived from option-implied pricing at the stated snapshot times and may change rapidly.
| More from the author |
|---|