
You can access both of our platforms from a single Saxo account.

Selling the expected move: a Novo Nordisk earnings case study

Summary: Good news looks priced in, yet Novo’s Q2 has a habit of gapping the stock lower. With the options market pricing an approx. 8% move into the 5 August print, which side of that range would you sell?
Earnings are a scheduled uncertainty – the date is known, the outcome is not. The craft is in pricing the move and choosing a structure that fits a view.
Every quarter a company reports and its stock gaps. The market has already priced how far it might move, and that price sits in the options chain before the event – so trading earnings well starts with reading that price, not forecasting the result.
This piece uses Novo Nordisk, reporting before the US open on 5 August 2026 (Source: Novo Nordisk Investor Relations, corroborated by Bloomberg, as of 24 July 2026). One wrinkle: Novo’s primary listing is in Copenhagen (NOVOB), but the listed options trade on the US ADR, NVO, which last traded near $48.77 (Source: Saxo, as of 24 July 2026 close) – holding above its rising 50- and 200-day moving averages but far below its 200-week, a short-term base within a still-broken trend, with elevated near-dated implied volatility into the report.
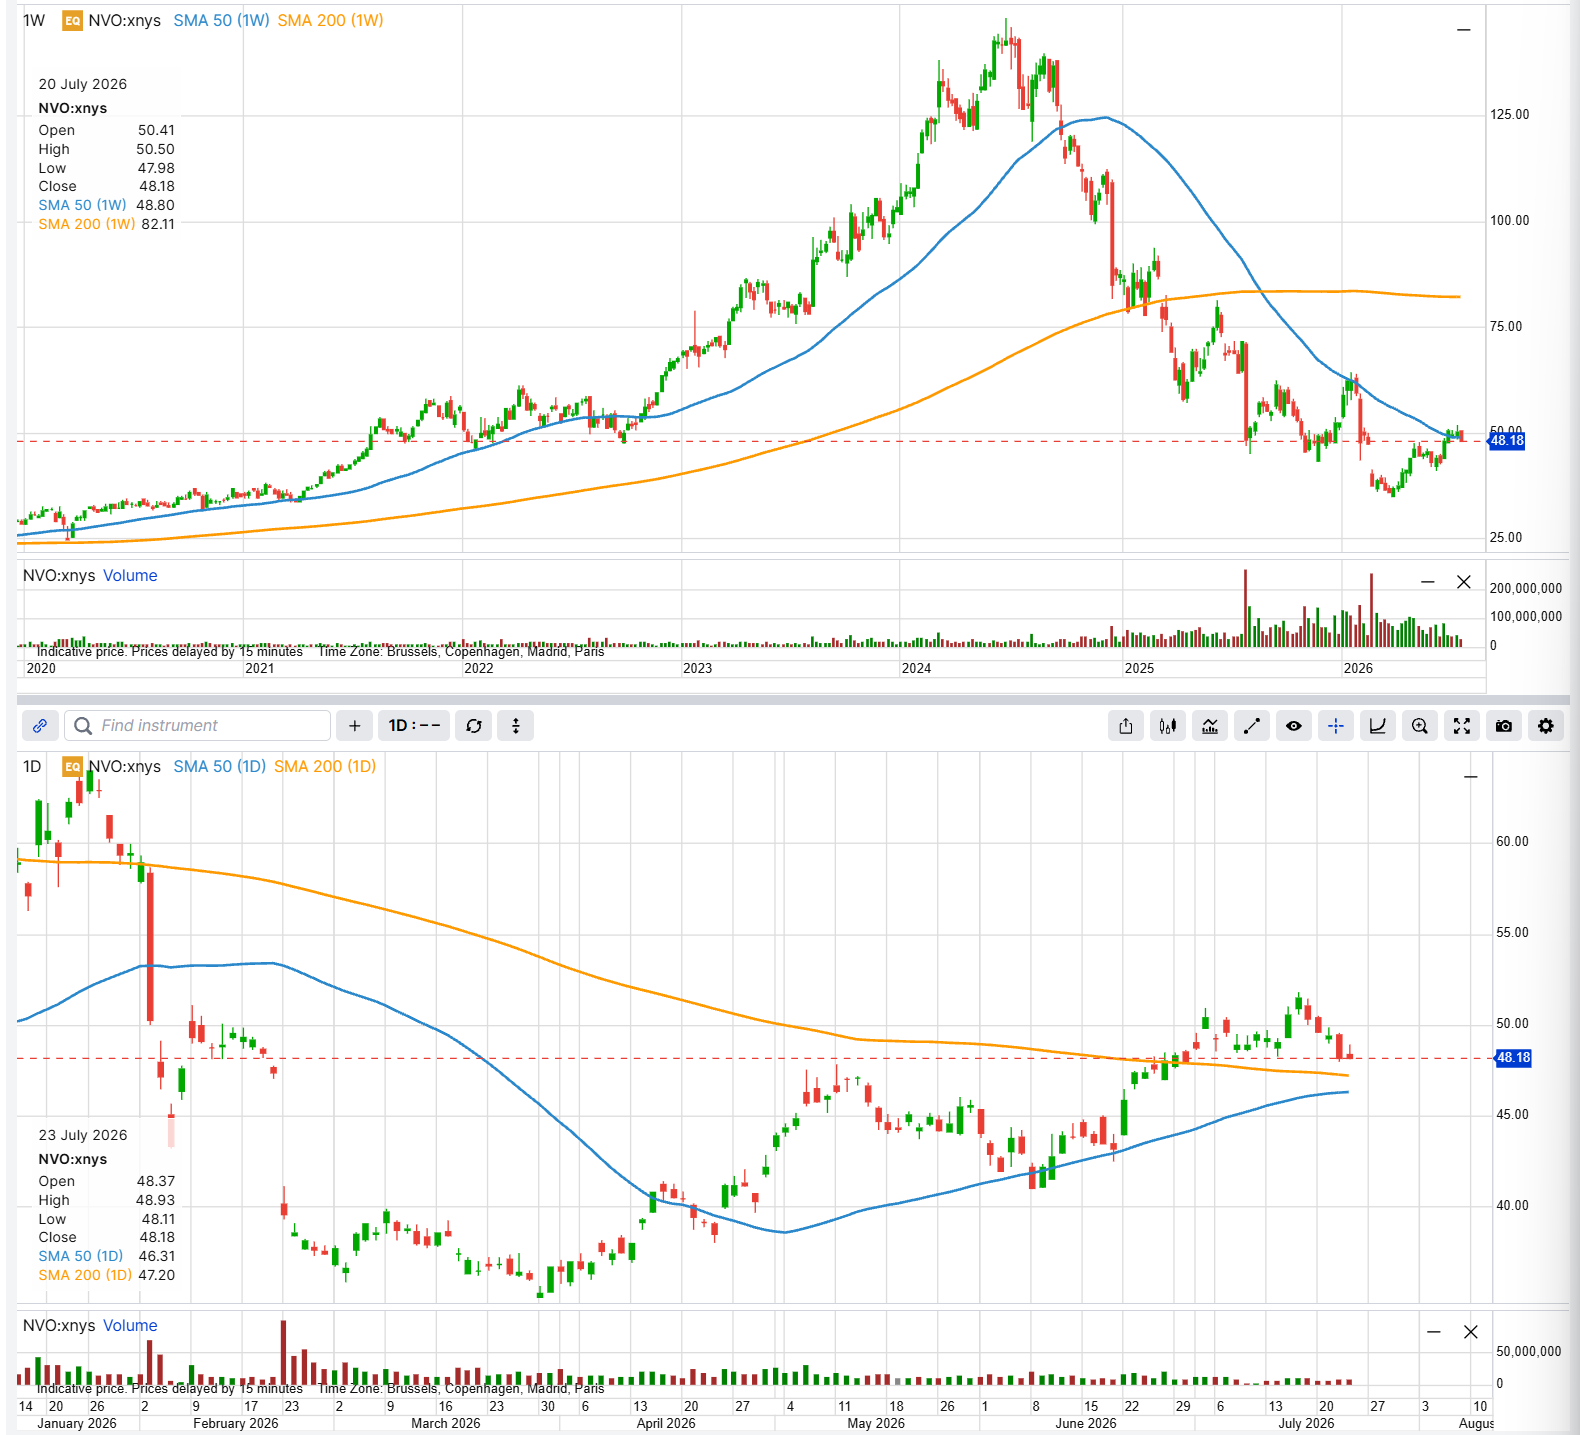 NVO heads into earnings near $48, holding above its rising 50- and 200-day moving averages after basing off its 52-week low, but still far below its 200-week average from the 2024 peak. Source: SaxoTrader, as of 23 July 2026.
Past performance is not indicative of future results; this chart is illustrative and for educational purposes only, and is not predictive.
Step one: read the expected move
Add the at-the-money call and put premiums for the expiry that captures the event; that straddle price is a rough proxy for the move option buyers are paying for.
For Novo, the 7 August weekly is the expiry that matters – the company reports on 5 August, two sessions before it expires. At the money the straddle priced at roughly $3.85 (Source: Saxo option chain, indicative as of 24 July 2026 close). Against ~$48.77 that is roughly an 8% expected move, an implied range of about $44.90 to $52.60 – the yardstick for every structure below.
That ~8% is the move to expiry, folding in the event plus a couple of days of drift; the historical one-day reaction has been smaller and lumpier – Novo’s last two Q2 prints moved –6.7% and –5.4% on the day (Source: Bloomberg, as of 24 July 2026).
Step two: respect the volatility crush
Into the event, near-dated implied volatility is bid up; once the result is out it collapses regardless of direction – the “IV crush.” A long option can lose even with direction right, while net-selling structures are built to benefit from that same crush.
Two caveats before leaning on it. Novo’s 30-day IV sits only around the middle of its 12-month range (an IV Rank in the mid-40s%, well below the ~65% October-2025 peak; Source: Bloomberg, as of 24 July 2026), so in our view the event premium is fair, not fat. And the ADR trades a few volatility points richer than the Copenhagen line because of the DKK/USD layer.
Important note: The strategies and examples provided in this article are purely for educational purposes. They are intended to assist in shaping your thought process and should not be replicated or implemented without careful consideration. Every investor or trader must conduct their own due diligence and take into account their unique financial situation, risk tolerance, and investment objectives before making any decisions. Remember, investing in the stock market carries risk, and it’s crucial to make informed decisions.
The earnings backdrop – the facts, neutrally
For a trader picking a side of the move, the context the market is reacting to, stated plainly:
- The ADR is up roughly 8.7% since its Q1 release; a full-year guidance upgrade is widely expected and, per sell-side commentary, appears largely priced in.
- Consensus Q2 EPS has been revised down ~24% over the past year (to about DKK 5.02), lowering the bar for a beat.
- Q2 has historically been Novo’s softest quarter: the last two Q2 prints fell –6.7% (2024) and –5.4% (2025) on the day.
- Competitive read-through: Eli Lilly posted positive Phase 3 topline for retatrutide on 23 July, while Novo’s oral Wegovy has held ~89% of US oral-GLP-1 volume since its January launch.
Source: Bloomberg Intelligence, Bloomberg News and analyst research (UBS, Barclays, Citi, Deutsche Bank), via Bloomberg Terminal, as of 24 July 2026.
In our view this mix – good news largely priced against a history of soft Q2 prints – may argue for giving the downside at least as much respect as the upside. That is a lens, not a forecast; it is why the neutral example carries more room on the downside. Options carry a high risk of rapid loss and are not suitable for every investor.
Bullish view: getting paid to define a floor
For a view that Novo holds up – or at least does not fall far – a bull put spread (put credit spread) sells a put spread below the market rather than buying a call at peak volatility, collecting premium that decays as the crush sets in, with the loss capped by a long put beneath it. The following figures are hypothetical and for education only.
Example structure (illustrative only – not a trade recommendation)
- Sell 1 NVO 7 August 2026 $45 put
- Buy 1 NVO 7 August 2026 $43 put
- Net credit: approximately $0.29 ($29 per spread) = about $0.55 collected on the short $45 put minus about $0.26 paid for the long $43 put
- Maximum loss: approximately $1.71 ($171) – the $2 width minus the credit – if NVO closes at or below $43; maximum profit approximately $0.29 ($29) if NVO holds at or above $45
- Break-even at expiry: approximately $44.71
- All figures are hypothetical and for education only.
Risk first: the most this loses is about $171 – the width minus the credit – if NVO falls through $43, against a best case of the $29 credit kept if it holds above $45; the short put carries early-assignment risk. Costs and charges apply to each leg; see Saxo pricing for full details.
The short $45 put sits ~8% below spot, under the 46 open-interest shelf a bullish trader would call support. Its edge is time decay and the crush; its enemy is a gap below the long strike. Options carry a high risk of rapid loss and are not suitable for every investor.
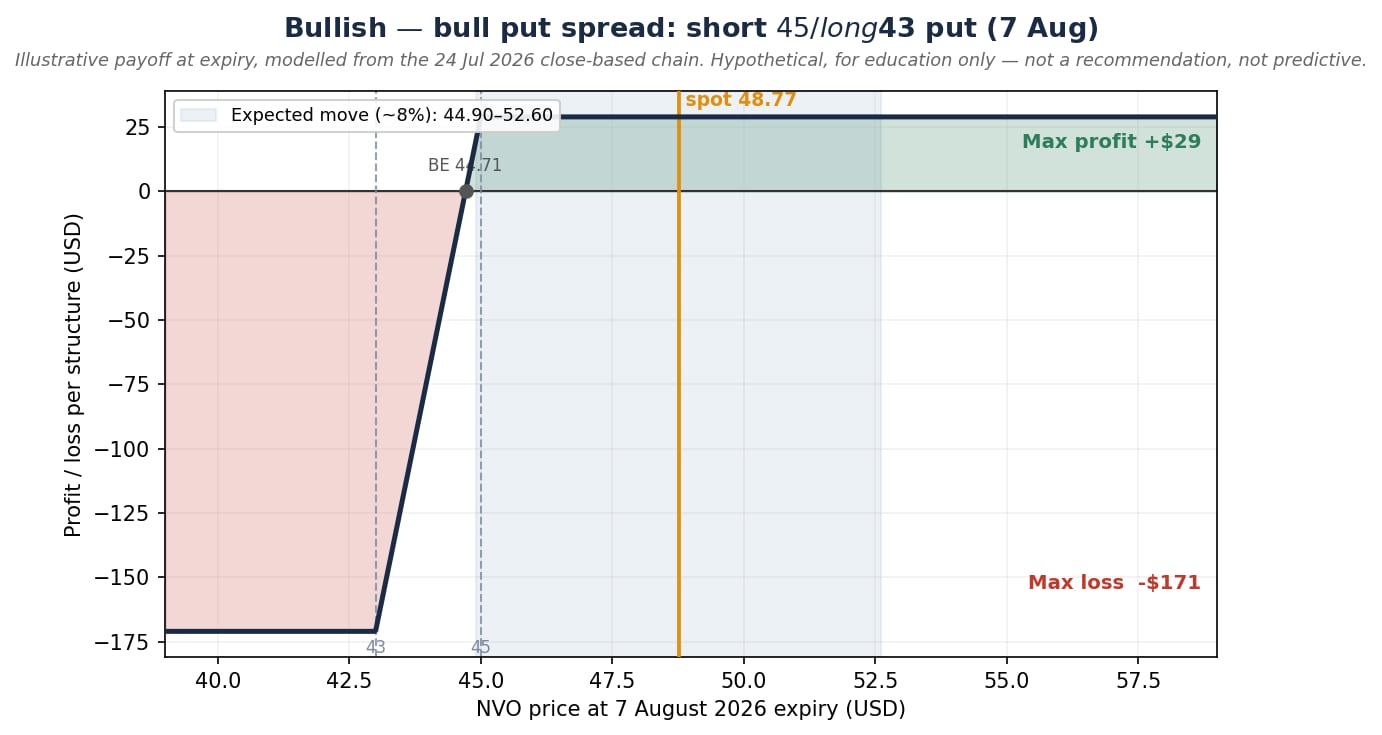 Bull put spread (short $45 / long $43 put), profit/loss at the 7 August expiry – max profit ~$29 above $45, max loss ~$171 below $43, break-even ~$44.71. Illustrative, modelled from the 24 July close; educational only – not a trade recommendation, and not predictive.
Past performance is not indicative of future results; figures are illustrative and not predictive.
Neutral view: selling the expected move, with more room below
For a view that the market is over-pricing the move, a short iron condor sells a put spread below the market and a call spread above it, reaching maximum profit if the stock finishes inside the range. Reflecting the backdrop, the put side is set a strike lower than the bullish example to give the downside more room.
Example structure (illustrative only – not a trade recommendation)
- Sell 1 NVO 7 August 2026 $44 put, buy 1 NVO 7 August 2026 $42 put
- Sell 1 NVO 7 August 2026 $52 call, buy 1 NVO 7 August 2026 $54 call
- Net credit: approximately $0.57 ($57 per condor) = about $0.20 from the $44/$42 put spread plus about $0.37 from the $52/$54 call spread
- Maximum loss: approximately $1.43 ($143) – the $2 wing width minus the credit – if NVO settles beyond $42 or $54; maximum profit approximately $0.57 ($57) between $44 and $52
- Break-evens at expiry: approximately $43.43 (down) and $52.57 (up)
- All figures are hypothetical and for education only.
Risk first: the most this loses is about $143 – the wing width minus the credit – if NVO settles beyond either long strike, against a best case of the $57 credit; the short legs carry early-assignment risk. Costs and charges apply to each leg; see Saxo pricing for full details.
The asymmetry is deliberate: the downside break-even (~$43.43) sits about 11% below spot versus about 8% above (~$52.57) – more cushion beneath the market, the negative-skew lens translated into strikes. Options carry a high risk of rapid loss and are not suitable for every investor.
The condor versus the butterfly. A tighter cousin, the iron butterfly, sells the at-the-money $48 straddle against $43 / $53 wings: illustratively it collects far more (around $3.04) but with a narrower profit band (break-evens ~$44.96 and ~$51.04) that pays fully only if Novo pins $48. More reward, lower probability, most exposed to a gap through a wing – which is why, on a serial gapper, the condor is the built example and the butterfly the noted alternative.
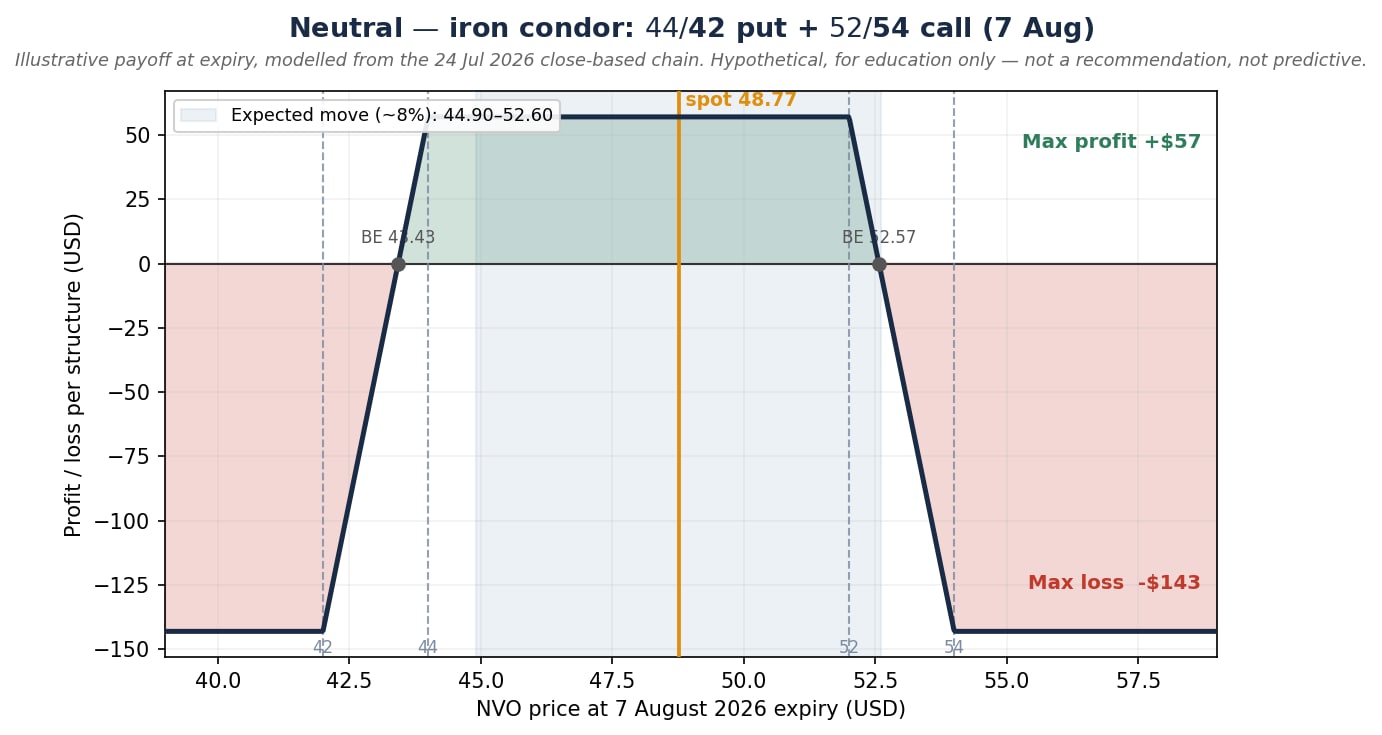 Short iron condor with the put side ($44/$42) set lower than the call side ($52/$54) to add downside room – max profit ~$57 between $44 and $52, max loss ~$143, break-evens ~$43.43 / ~$52.57. Illustrative, modelled from the 24 July close; educational only – not a trade recommendation, and not predictive.
Past performance is not indicative of future results; figures are illustrative and not predictive.
Bearish lean: fading the priced-in upside, cheaply
For a directional-down view that prefers not to buy a naked put at peak volatility, a bear call spread (call credit spread) sells a call spread above the market, profiting if the stock stays below the short strike – a way to lean against an upside the market may have already priced.
Example structure (illustrative only – not a trade recommendation)
- Sell 1 NVO 7 August 2026 $52 call
- Buy 1 NVO 7 August 2026 $54 call
- Net credit: approximately $0.37 ($37 per spread) = about $0.79 collected on the short $52 call minus about $0.42 paid for the long $54 call
- Maximum loss: approximately $1.63 ($163) – the $2 width minus the credit – if NVO closes at or above $54; maximum profit approximately $0.37 ($37) if NVO holds at or below $52
- Break-even at expiry: approximately $52.37
- All figures are hypothetical and for education only.
Risk first: the most this loses is about $163 – the width minus the credit – if NVO rallies through $54, against a best case of the $37 credit kept if it stays below $52; the short call carries early-assignment risk. Costs and charges apply to each leg; see Saxo pricing for full details.
The short $52 call sits near the top of the implied move, below the 55 open-interest cap. It expresses the view that the expected guidance upgrade is already priced; its edge is the crush and decay, its risk a decisive beat through $54, and it avoids the unlimited risk of a naked short call. Options carry a high risk of rapid loss and are not suitable for every investor.
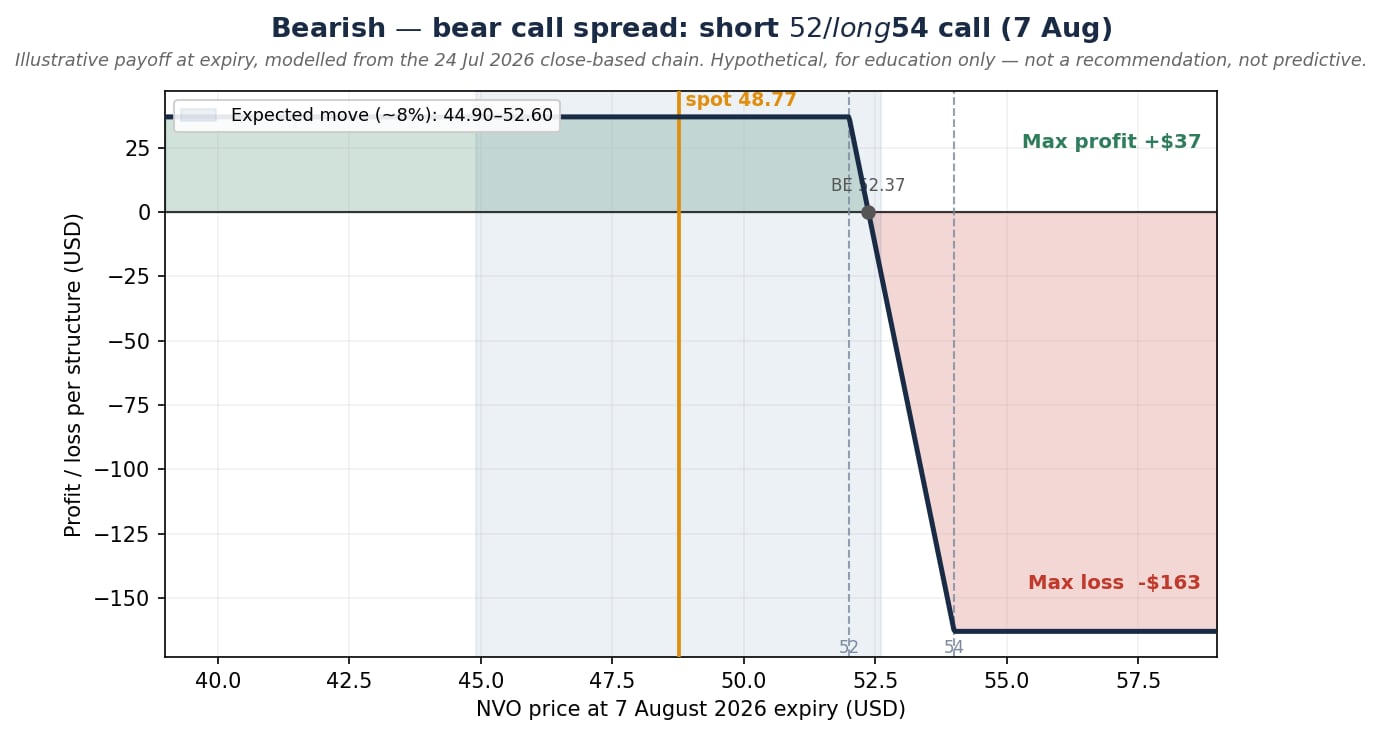 Bear call spread (short $52 / long $54 call), profit/loss at the 7 August expiry – max profit ~$37 below $52, max loss ~$163 above $54, break-even ~$52.37. Illustrative, modelled from the 24 July close; educational only – not a trade recommendation, and not predictive.
Past performance is not indicative of future results; figures are illustrative and not predictive.
All three use the 7 August weekly and are short-volatility, defined-risk credit positions helped by the post-earnings crush – they differ only in where the risk sits: below the market, around it, or above it.
Before placing an earnings trade, check: bid/ask spreads (NVO’s weekly wings are thinner than a mega-cap’s); open interest at the chosen strikes; whether the report is before the open or after the close (it sets which expiry captures the move); implied volatility versus how much the stock usually moves; and an exit plan defined before entry.
Assignment risk: NVO options are American-style, so any short leg can be assigned before expiry if it moves in the money, particularly near expiration. Monitor short options and understand the platform’s assignment process before entering. See Saxo pricing for costs and applicable charges: https://www.home.saxo/rates-and-conditions/pricing-overview
Final thoughts
The method matters more than the ticker: read the expected move, anticipate the crush, match a defined-risk structure to a view. None of the three needed a forecast – each asked whether the priced move was too rich to sell below, around, or above the market. Selling it is no free lunch: with implied volatility only mid-range the premium is fair rather than generous, and Novo’s history of earnings gaps means the realised move can land outside the implied range – which is why each example is defined-risk. Options carry a high risk of rapid loss and are not suitable for every investor.
The author does not hold positions in any of the instruments mentioned in this article.
Sources: Novo Nordisk Q2 2026 earnings date – Novo Nordisk Investor Relations, corroborated by Bloomberg; price, option premiums, implied volatility and open interest – Saxo platform, as of 23–24 July 2026; earnings-history, consensus, guidance and competitive context – Bloomberg Intelligence, Bloomberg News and analyst research (UBS, Barclays, Citi, Deutsche Bank), via Bloomberg Terminal, as of 24 July 2026.
This content is marketing material and should not be regarded as investment advice. Trading financial instruments carries risks and historic performance is not a guarantee of future results.
The Author is permitted to wait at least 24 hours from the time of the publication before they trade the instruments themselves.
The instrument(s) referenced in this content may be issued by a partner, from whom Saxo receives promotional fees, payment or retrocessions. While Saxo may receive compensation from these partnerships, all content is created with the aim of providing clients with valuable information and options.
This content will not be changed or subject to review after publication.
| Related articles/content |
|---|
| What IV crush really means in practice reviewed version | 9 April 2026 Trading earnings with defined | 31 Mar 2026 Amazon into earnings choosing a structure when the move is already priced | 28 July 2026 Hedging a portfolio near the highs four ways to buy insurance while it is cheap | 17 July 2026 Before Alphabet reports reading the expected move and structuring three views | 16 July 2026 How to trade an earnings event with options a Netflix case study | 15 July 2026 ASML how to position with options ahead of Q2 earnings | 13 July 2026 BABA three option strategies for three market views | 9 July 2026 Chips slide index shrugs - Options Brief - 27 July 2026 Options Brief - Twin shock tech tumbles - 24 July 2026 |
| More from the author |
|---|