
You can access both of our platforms from a single Saxo account.

Five earnings reports later: what the options priced, and what the shares did

Summary: In October, five articles previewed the earnings reports of Tesla, Meta, Visa, Microsoft and Amazon. All five have reported. This look-back sets the move the options priced against the move the shares made.
Four of the five reports moved the shares far less than the options charged for. Meta moved almost exactly as much.
In October, five articles in this series looked at an earnings report before it came out:
- Tesla earnings: the median says small, the average says big. What do options price?
- Meta earnings: options price a smaller move than Meta usually makes
- Visa earnings: options price a bigger move than Visa usually makes
- Microsoft earnings: is the options market leaning up or down?
- Amazon earnings: between a typical report and July’s 15% jump
All five expiries have now passed. The aim here is not to score the examples, but to show what a priced move is, and why one closing price rarely tells the whole story.
What the options charge for, and what they do not promise
The priced move is the call plus the put at the strike nearest the share price, on the first expiry after the report, divided by the share price. That pair is a straddle. Its cost is the move, up or down, a buyer of both needs at expiry just to get the money back.
So it is a price, not a forecast. The seller wants to be paid for the risk of a large surprise, and the price says nothing about direction. A report can move the shares less than priced, more, or about the same, without the price having been wrong at the time.
Five reports held against their price
Every move in the chart is measured from the last close before the report, so it shows what the news did.
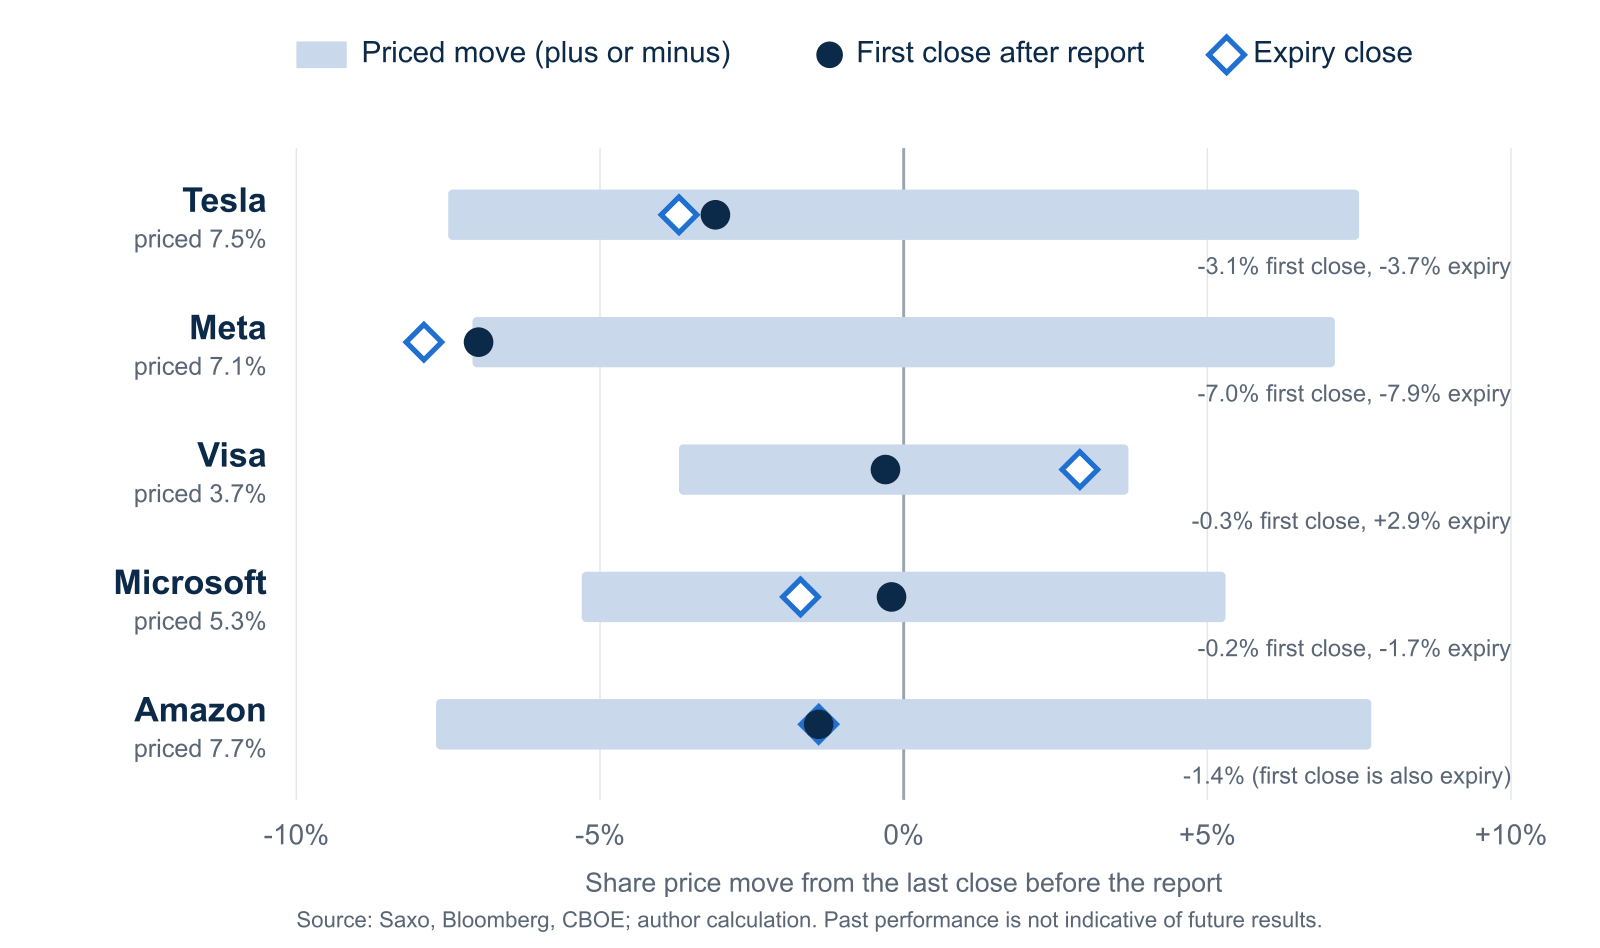 Priced move from each October article’s at-the-money straddle, against the share price move to the first close after the report and to expiry. Past performance is not indicative of future results; figures are illustrative and not predictive. Source: Saxo, Bloomberg, CBOE; author calculation.
Four of the five reports moved the shares much less than the options priced. Microsoft and Visa barely moved on the first session. Amazon and Tesla moved, but by well under half the price. Meta is the exception: the options priced about 7%, and the shares fell almost exactly that much. Past performance is not indicative of future results; figures are illustrative and not predictive.
Important note: The strategies and examples provided in this article are purely for educational purposes. They are intended to assist in shaping your thought process and should not be replicated or implemented without careful consideration. Every investor or trader must conduct their own due diligence and take into account their unique financial situation, risk tolerance, and investment objectives before making any decisions. Remember, investing in the stock market carries risk, and it’s crucial to make informed decisions.
The structures below are the ones from the October articles, each illustrative only, not a trade recommendation. Outcomes are read at intrinsic value at the expiry close, before costs, and are hypothetical, for education only. Options carry a high risk of rapid loss and are not suitable for every investor. Costs and charges apply to each leg and vary by account and venue; check the applicable rates before entering any position.
Meta: the report that matched its price
Meta earnings: options price a smaller move than Meta usually makes set a long straddle, for Meta’s usual large move, against an iron butterfly, for a calmer report. Both sat on the 705 strike.
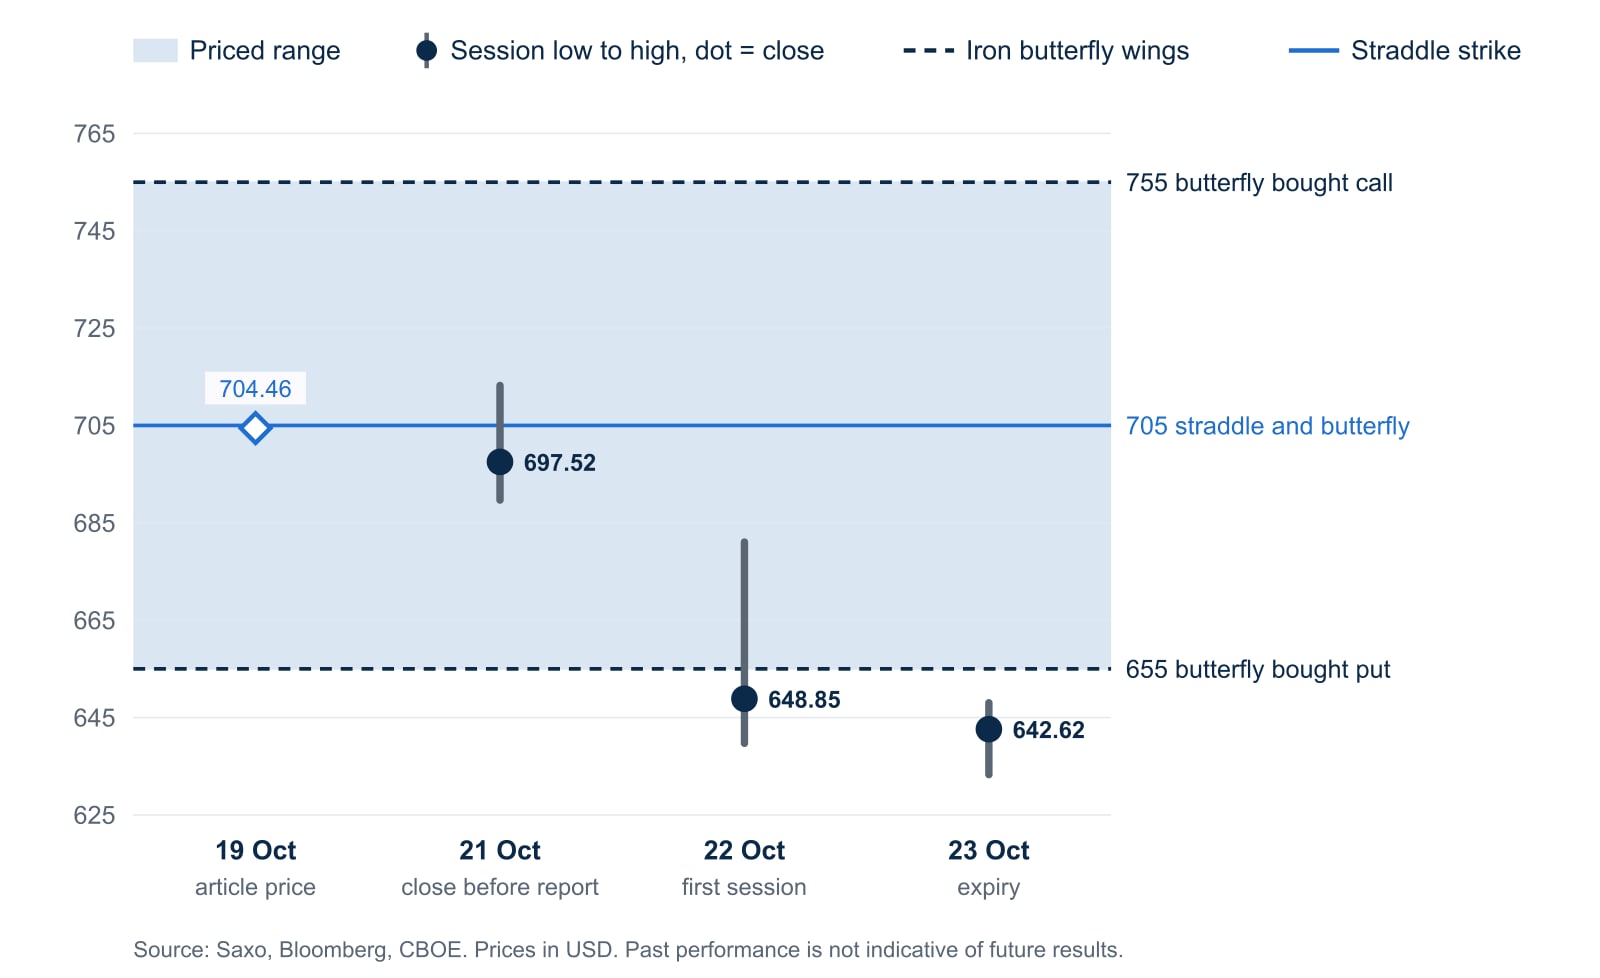 Meta share price, 19 to 23 October 2026: session range and close against the priced range and the October strikes (illustrative only, not a trade recommendation). Past performance is not indicative of future results; figures are illustrative and not predictive. Source: Saxo, Bloomberg, CBOE.
The first-day fall was a fraction under the priced move. The shares had already slipped before the report and kept falling into expiry, which carried them past the straddle’s lower break-even. The long straddle finished in profit before costs; a quieter report would have cost up to its full premium. The iron butterfly lost its maximum, the amount fixed in advance by its wings.
A priced move is not a ceiling. When a report delivers it in full, the structure that sold it takes the loss its bought options were there to cap. In our view, Meta may also show how thin the margin can be: part of the straddle’s result came from where the shares stood before the news.
Takeaway: a priced move is not a cap, so the maximum loss of a structure that sells it may be the first figure worth reading.
Tesla: the starting point moved before the news
Tesla earnings: the median says small, the average says big. What do options price? built its structures on prices from 15 October, almost a week before the report.
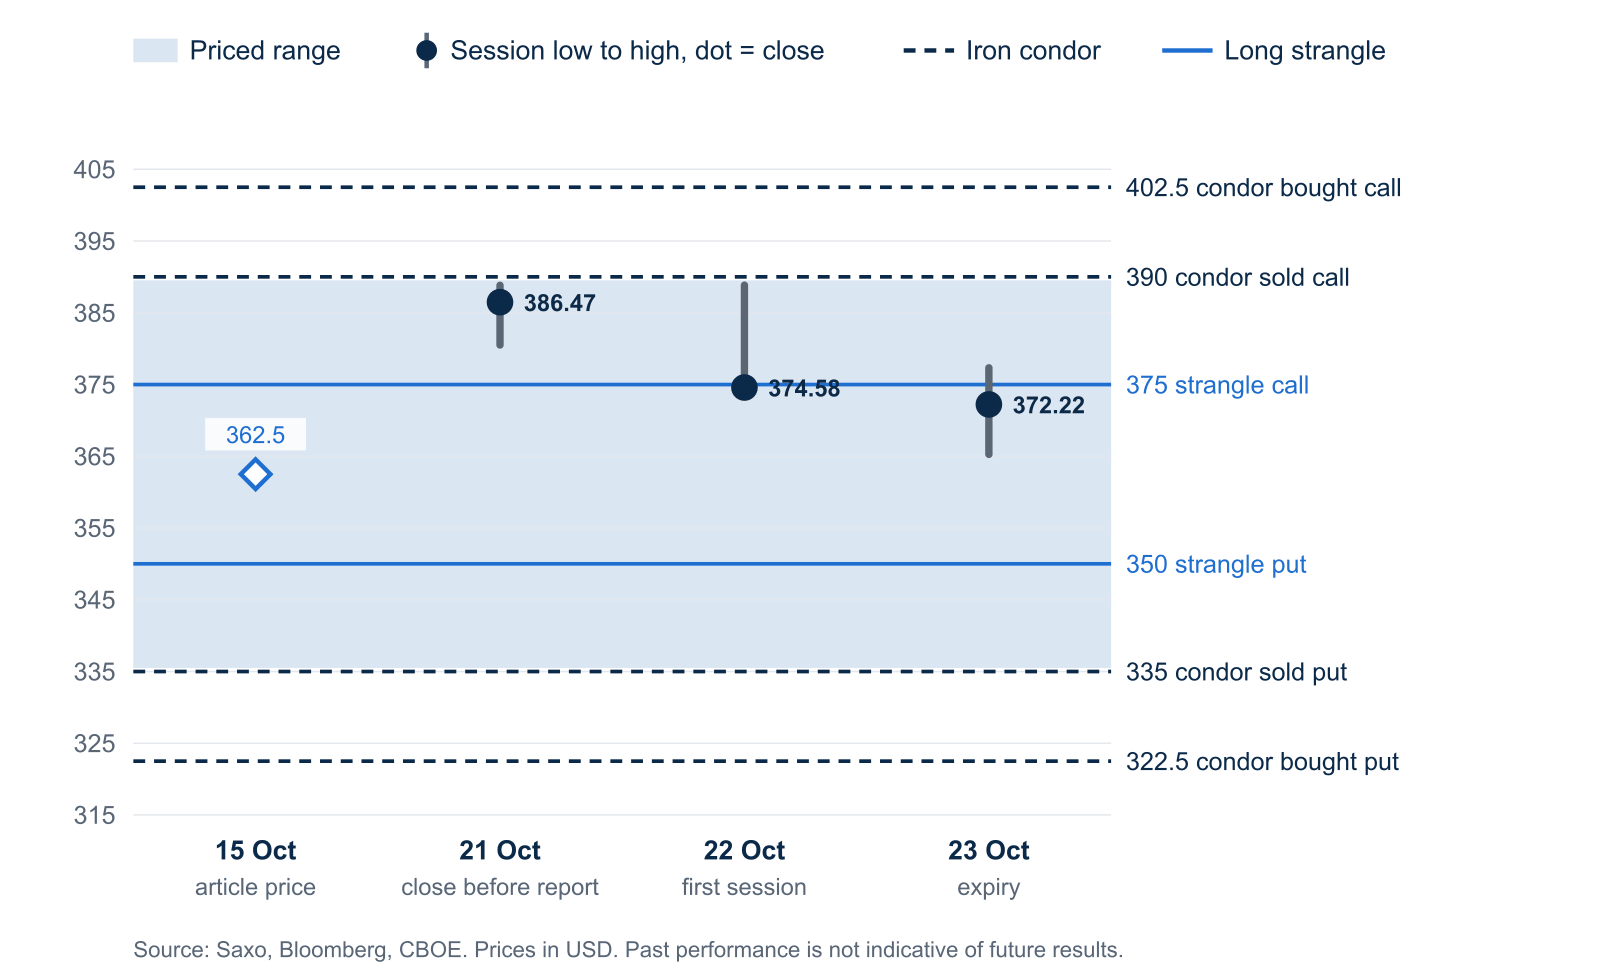 Tesla share price, 15 to 23 October 2026: session range and close against the priced range and the October strikes (illustrative only, not a trade recommendation). Past performance is not indicative of future results; figures are illustrative and not predictive. Source: Saxo, Bloomberg, CBOE.
By the last close before the report, the shares had risen about 6.6%, to just below the iron condor’s short call. Much of the priced range was used up before the news arrived. The report then pulled the shares back inside both structures’ strikes: the iron condor kept its credit, and the long strangle expired worthless.
That hung on direction. A rise of the same size would have taken the shares through the condor’s short call, towards its capped maximum loss, while the strangle’s loss was always limited to its premium. In our assessment, prices taken days before a report describe the position at that moment, and drift before the news may change what a structure is exposed to.
Takeaway: when days pass between pricing and the report, checking the strikes against the share price on report day may show whether a structure is still centred.
The close is not the whole path
Visa, Amazon and Microsoft raise a different timing question: what happens during and after the reaction day.
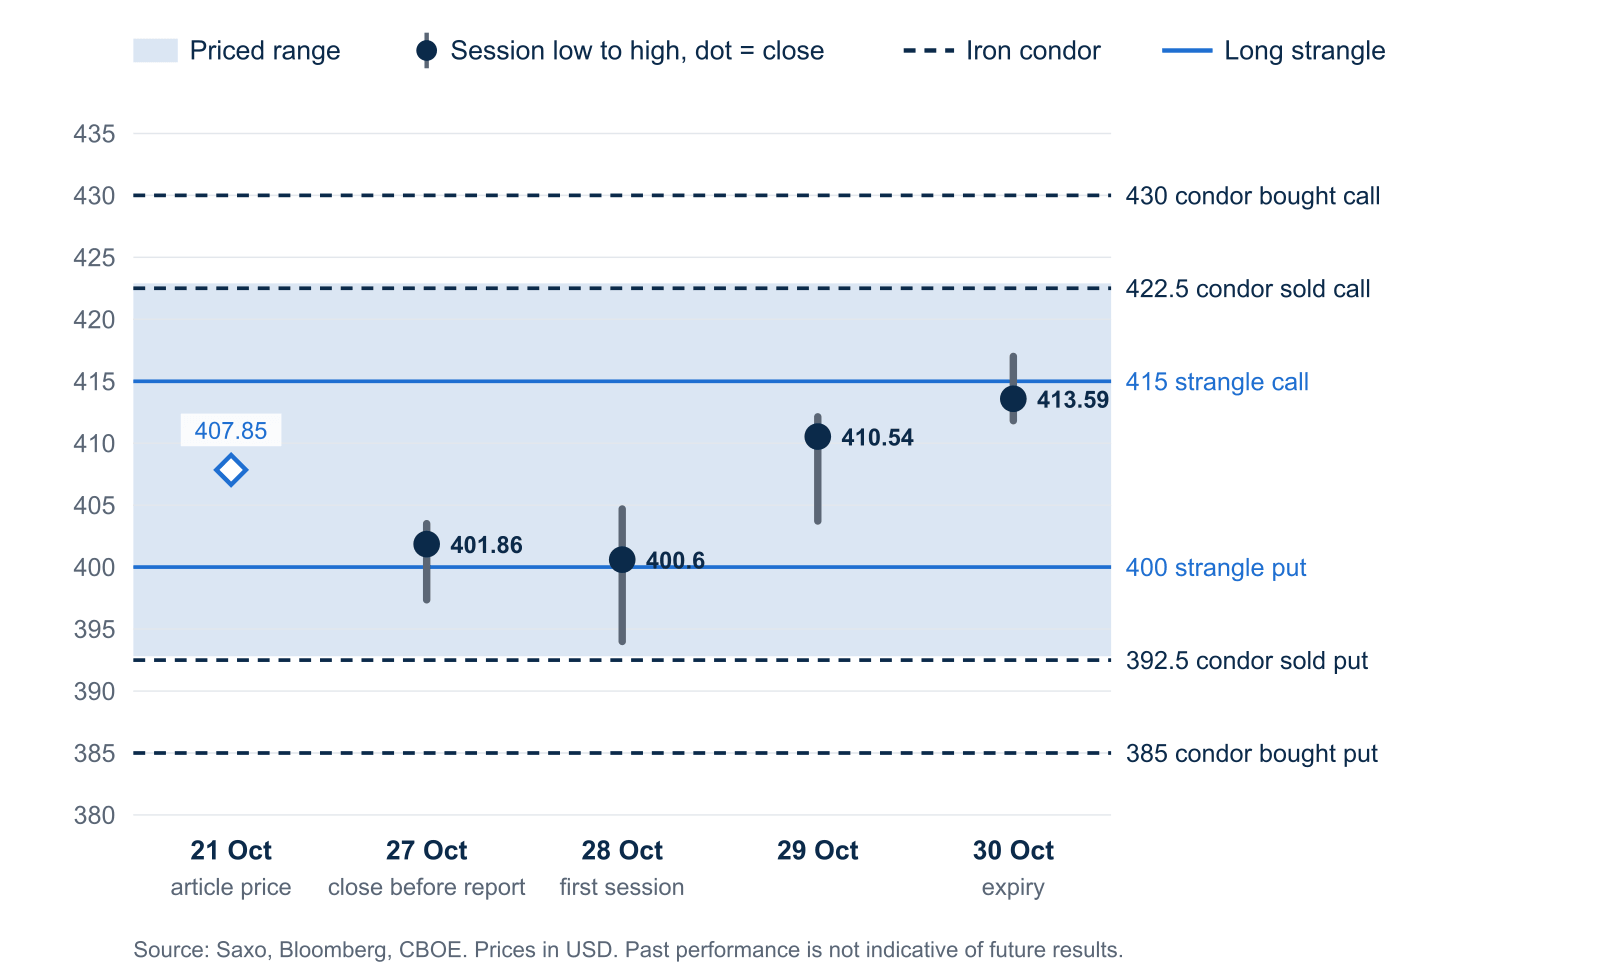 Visa share price, 21 to 30 October 2026: session range and close against the priced range and the October strikes (illustrative only, not a trade recommendation). Past performance is not indicative of future results; figures are illustrative and not predictive. Source: Saxo, Bloomberg, CBOE.
Visa ended its first session almost flat, then rose about 3% by expiry, still inside the iron condor’s range from Visa earnings: options price a bigger move than Visa usually makes. The condor kept its credit and the long strangle expired worthless. For a position held to expiry, the reaction-day close was only part of the story.
Takeaway: the days after the reaction still count, so the choice between exiting after the first session or holding to expiry is often easier to settle before the report.
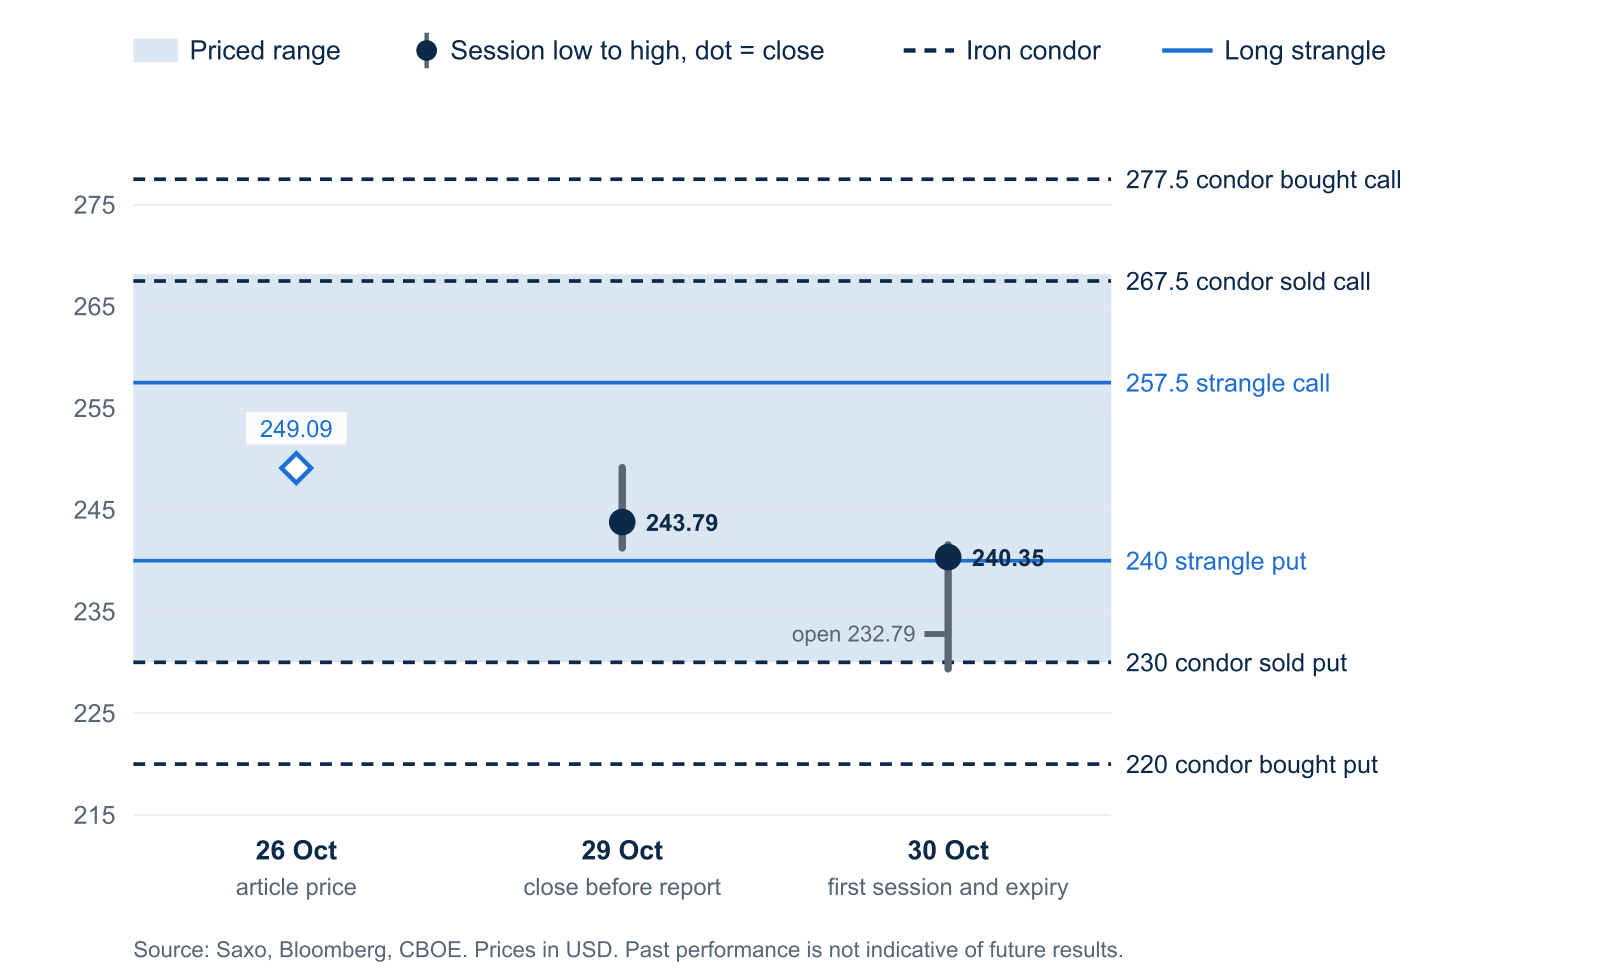 Amazon share price, 26 to 30 October 2026, where the first session after the report was also the expiry: session range and close against the priced range and the October strikes (illustrative only, not a trade recommendation). Past performance is not indicative of future results; figures are illustrative and not predictive. Source: Saxo, Bloomberg, CBOE.
Amazon’s report day was also its expiry. The shares traded below the condor’s short put from Amazon earnings: between a typical report and July’s 15% jump in the morning, then recovered to close just above the strangle’s put strike. The iron condor kept its credit and the long strangle expired worthless. Judged in the morning, the same position would have looked very different.
Takeaway: when the report day is also the expiry, the exit and the assignment risk fall on the same session, which may argue for planning both before the open.
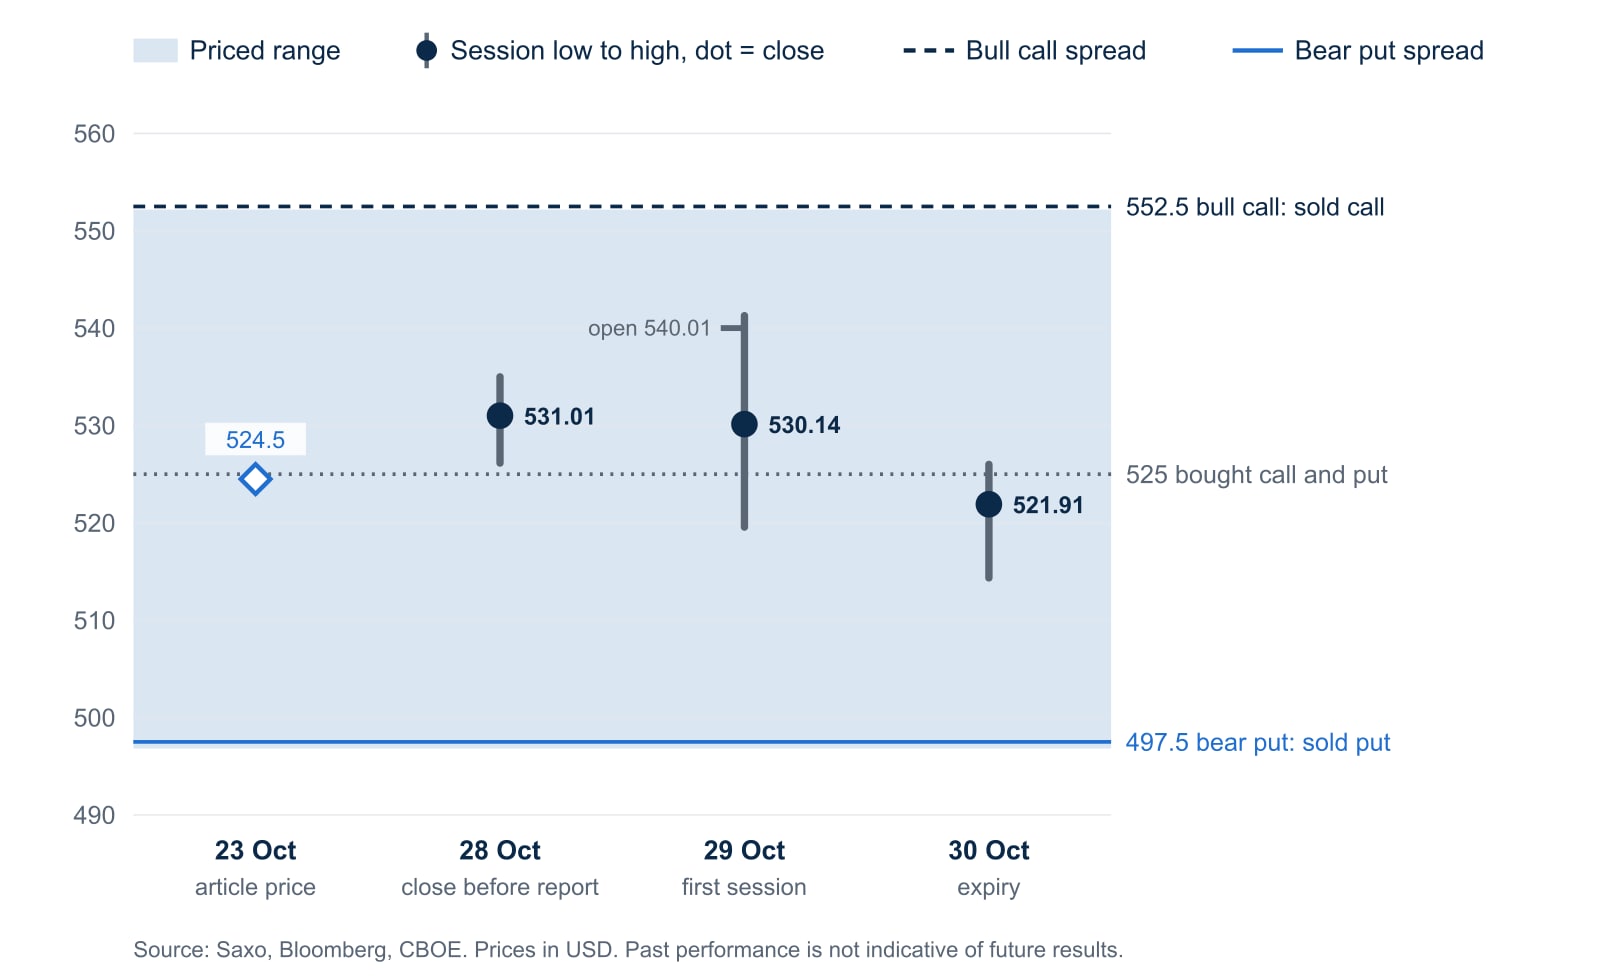 Microsoft share price, 23 to 30 October 2026: session range and close against the priced range and the October strikes (illustrative only, not a trade recommendation). Past performance is not indicative of future results; figures are illustrative and not predictive. Source: Saxo, Bloomberg, CBOE.
Microsoft opened higher, sold off, and ended its first session almost unchanged. Microsoft earnings: is the options market leaning up or down? used two spreads to read direction, and each needed a move its own way. The bull call spread expired worthless; the bear put spread kept part of its value but finished below its cost. The article’s reading of roughly even odds was not contradicted.
Takeaway: two evenly priced spreads read the market’s lean; as positions, both can lose if the shares barely move.
Where a structure that sold the move ended ahead, it did so only because the shares closed inside its range. A bigger report would have reversed that, up to the capped maximum loss, while a long strangle could lose no more than its premium. Options carry a high risk of rapid loss and are not suitable for every investor.
What five reports can and cannot say
In our view, the five reports are a useful reminder of what a straddle price contains: the cost of a large surprise, paid whether or not it comes. They are also a very small sample. Priced moves are often larger than the move that follows, but not always, as Meta did, and one quarter says nothing about the next.
Two further points may stand out: where the shares stand when the news arrives, and the fact that the reaction-day close is one point on a path that runs to expiry. None of this points to a structure or a direction for any future report. Options carry a high risk of rapid loss and are not suitable for every investor. Past performance is not indicative of future results.
The author does not hold positions in any of the instruments mentioned in this article. The Author is permitted to wait at least 24 hours from the time of the publication before they trade the instruments themselves.
| More from the author |
|---|