Outrageous Predictions
Executive Summary: Outrageous Predictions 2026
Saxo Group
Saxo Group
Read Saxo's Outrageous Predictions for 2026, our latest batch of low probability, but high impact ev...

Summary: Micron Technology reports Q3 fiscal 2026 results on 24 June, with the options chain pricing in a plus or minus 11% move at 155% front-month implied volatility. Here is what the term structure, put/call positioning data, and today’s options flow tell you before the announcement.
Before picking a direction, read what the chain is already telling you.
Micron Technology (MU) reports fiscal Q3 2026 results on 24 June. DRAM and NAND pricing trends, high-bandwidth memory (HBM) shipment volumes, and forward gross margin guidance will move the stock. The options market has been building its own picture for weeks – and that picture is worth reading before the event.
The at-the-money straddle on the 26 June weekly – the expiry that captures the earnings event most directly – prices in a move of ±$132.22, or ±11.03%, from a stock price of $1,172.30. The implied post-earnings trading range runs from approximately $1,066 to $1,331. Those bounds are not a forecast. They represent the market’s current clearing price for the uncertainty around the print. (Data source: Barchart.com as of 22 June 2026, 09:17–09:19am CDT.)
Important note: The strategies discussed in this article are for educational purposes only and should not be replicated without careful consideration of your own financial situation, risk tolerance, and investment objectives.
Front-month implied volatility for the 26 June weekly sits at 155.32%. The 17 July monthly – the first major expiry after earnings clears – is at 108.54%. August is at 101.96%. That roughly 47-point gap between the front weekly and the next monthly is the earnings event premium, priced almost entirely into the nearest expiry – and it is substantially wider than it was earlier this week, as the stock’s rally has further concentrated IV into the front.
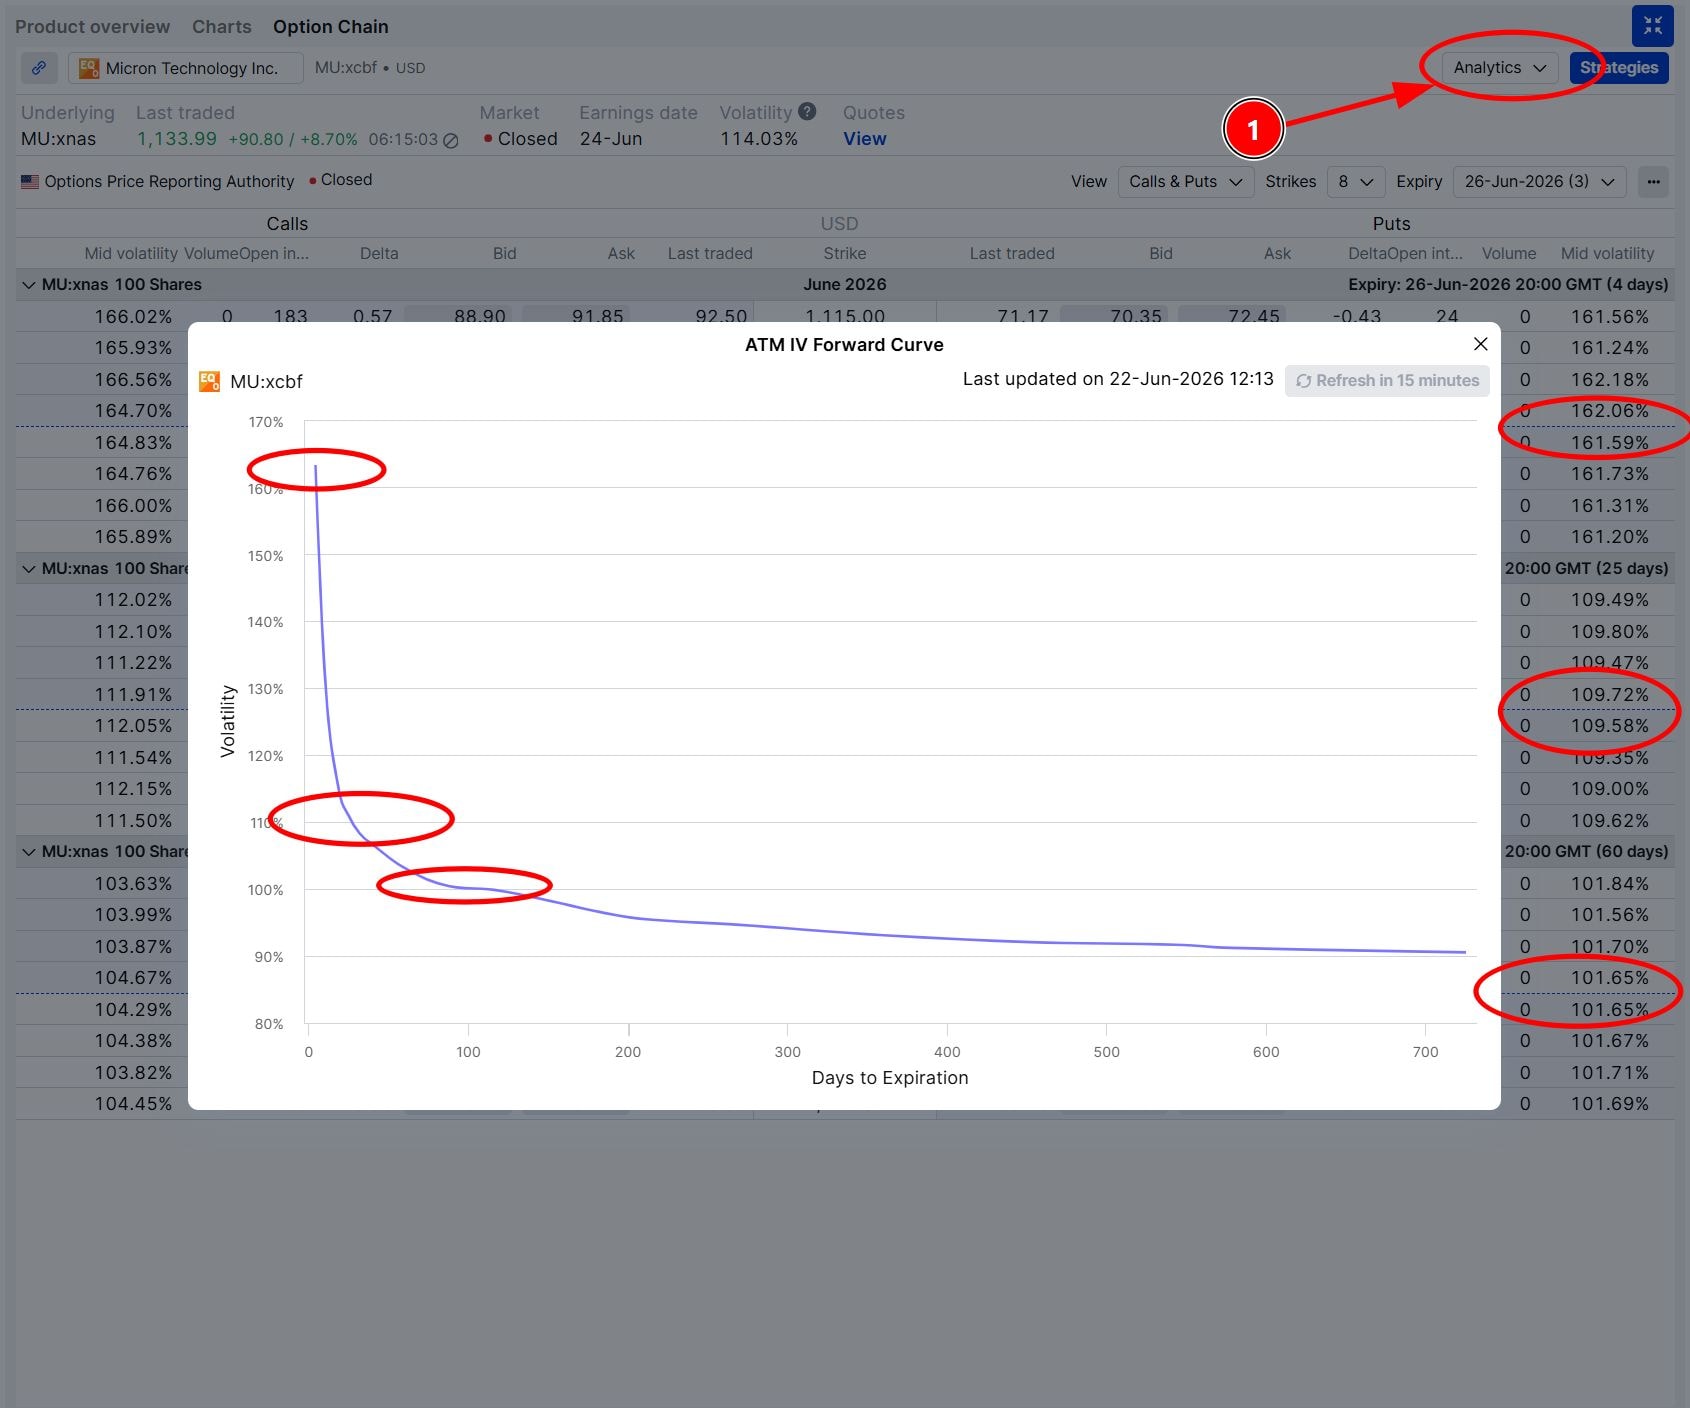
Micron ATM IV forward curve as of 22 June 2026, showing the 26 June weekly front-end spike (155.32%) and reversion to July (108.54%) and August (101.96%). Source: SaxoTrader Pro
The morning after earnings, that premium disappears regardless of where the stock goes. A trader who buys a 26 June option at 155% and gets the direction right can still lose money if the post-earnings move falls short of the premium embedded in the position. Structure matters as much as direction at these IV levels.
The 26 June weekly shows a put/call volume ratio of 0.89 on today’s data – fractionally more calls than puts traded on the day. That contrasts with the open interest ratio for the same expiry, which stands at 2.38: nearly two and a half puts for every call in accumulated positions. The defensive hedging is already in the chain from prior sessions; today’s flow, as the stock pushes higher, is adding call exposure on top of that existing put base.
Moving out the curve, the shift is pronounced. The July 2 put/call volume ratio sits at 0.46; by June 2027 it reaches 0.15 – strongly call-skewed at every point beyond the earnings event. The near-term event hedge is in place. Longer-dated positioning remains oriented toward upside.
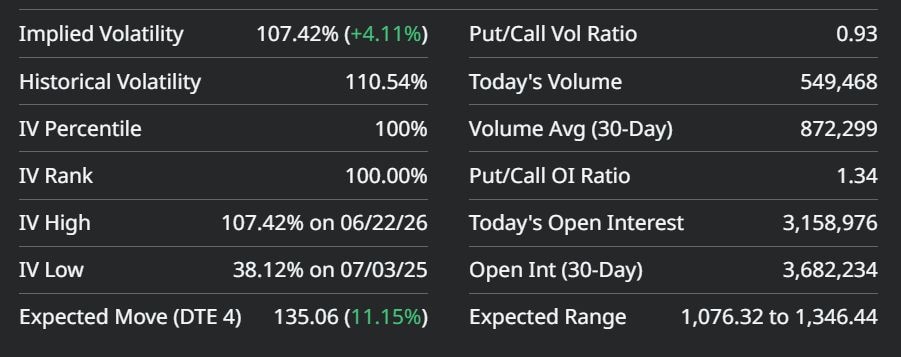
Micron options composite overview as of 23 June 2026, showing IV Rank 100%, put/call volume ratio 0.93, expected move $135.06 (11.15%). Source: Barchart.com
The 26 June chain shows notable open interest clustering at several strikes above and below the current price – call concentration above, put concentration below. These concentrations do not determine direction. They create mechanical reference points: dealer hedging activity around those strikes shapes how price behaves after the event, particularly if the stock gaps sharply into zones where large positions need adjusting.
Important note: The strategies and examples provided in this article are purely for educational purposes. They are intended to assist in shaping your thought process and should not be replicated or implemented without careful consideration. Every investor or trader must conduct their own due diligence and take into account their unique financial situation, risk tolerance, and investment objectives before making any decisions. Remember, investing in the stock market carries risk, and it’s crucial to make informed decisions.
For traders expecting an above-consensus result – HBM demand momentum, better DRAM pricing, positive guidance on margins – the challenge is not finding a bullish structure. It is finding one suited to 155% front-month implied volatility and a binary catalyst days away. At these levels, buying options outright is expensive, and the vol crush punishes full-vega long positions even when direction is correct.
The following structures are illustrative only – not trade recommendations.
For traders expecting guidance to disappoint – on DRAM demand, margin compression, or inventory commentary signalling the upcycle is softening – the same IV environment applies on the other side. A put at 155% is expensive, and the crush punishes the downside long position as much as the upside one.
The following structures are illustrative only – not trade recommendations.
For traders with no directional conviction but strong conviction that MU will move significantly either way, a long straddle or long strangle may be relevant.
The following structures are illustrative only – not trade recommendations.
At 155%, the vol crush is the central risk for both. A stock that moves 10% after the print can still produce a loss if the IV collapse – from 155% toward 102–109% – erodes more value than the directional move recovers. The key question: does Micron’s earnings history suggest it regularly overshoots a ±11% implied move? If so, the premium has a case.
Once Micron reports, the term structure resets. The roughly 47-point front-end premium disappears as IV reverts toward the July and August baseline near 102–109%. Post-earnings structures – calendar spreads, iron condors, diagonal spreads – become viable when the event premium is gone and front-end IV normalizes toward realized volatility.
Three things are visible in Micron’s chain ahead of 24 June: the implied move – ±11%, or ±$132 – sets the hurdle for any long premium position; front-month IV at 155% makes full-vega long structures structurally expensive; and the divergence between accumulated put hedging in OI and today’s fresh call volume suggests the institutional read is not bearish on the AI memory thesis – it is managing around the near-term binary.
At 155%, buying options outright into a binary event means making a second bet alongside the directional one: that the move will exceed the premium embedded in the position. A spread partially removes that second bet. Whether the trade-off fits depends on conviction level, expected move size, and how much profit the trader is willing to cap in exchange for lower entry cost.
The options chain ahead of earnings is a live document. Reading it before placing a trade will not guarantee a better outcome. It will clarify what any given position actually needs to work.
This content is marketing material and should not be regarded as investment advice. Trading financial instruments carries risks and historic performance is not a guarantee of future results.
The author does not hold positions in any of the instruments mentioned in this article.
The Author is permitted to wait at least 24 hours from the time of the publication before they trade the instruments themselves.
The instrument(s) referenced in this content may be issued by a partner, from whom Saxo receives promotional fees, payment or retrocessions. While Saxo may receive compensation from these partnerships, all content is created with the aim of providing clients with valuable information and options.
This content will not be changed or subject to review after publication.
| More from the author |
|---|
Outrageous Predictions
Saxo Group
Outrageous Predictions
Chief Investment Strategist
Outrageous Predictions
Chief Investment Strategist
Outrageous Predictions
Global Head of Investment Strategy
Outrageous Predictions
Global Head of Investment Strategy
Outrageous Predictions
Investor Content Strategist
Outrageous Predictions
Global Head of Macro Strategy
Outrageous Predictions
Investor Content Strategist
Outrageous Predictions
Global Head of Macro Strategy
Outrageous Predictions
Global Head of Macro Strategy