
Für den Zugriff auf die beiden Plattformen können Sie jeweils dasselbe Saxo-Konto verwenden.

Volatility jumps at the front before Nvidia - Options Brief - 17 November 2026
Options

Summary: The S&P 500 used its whole weekly range on Monday, and nine-day protection now costs more than three-month protection. Nvidia reports tonight, yet its own report day still prices the same. Where did the extra premium go?
On a day of new US chip curbs, the S&P 500 fell through the bottom of its weekly range, and options now charge more for the next nine days than for the next three months, before Nvidia reports tonight.
MARKET REGIME: NEUTRAL / CHOP | VIX 22.91 | TERM STRUCTURE: CONTANGO (FLAT) | SKEW: ELEVATED (146.33) | FRONT-MONTH VIX FUTURES: 22.12
Today in brief
The option market now charges more for the days around Nvidia’s report than it did a session ago, but not for the report itself. Today’s S&P 500 expiry prices about 0.95% and Friday’s about 1.98%, which leaves about 1.74% for the three sessions after today. In Monday’s edition Friday’s expiry priced 1.78%, and time alone would have taken that to about 1.59%, so in our view traders have added premium for the rest of the week. Nvidia’s own report day, by contrast, still prices about 7.7%, where it has held since last week.
The short end of the volatility curve moved fastest. The nine-day volatility gauge, which measures what options charge for protection over the next nine days, jumped 29.91% to 23.15, above the VIX at 22.91, so near-term protection now costs about as much as three-month protection. The rise spread to single stocks: the typical name’s volatility rank, a 0 to 100 measure of where its option prices sit against their own year, rose to 36.2 from 29.3, with 451 of 520 names higher.
Two readings cut the other way. SKEW, a gauge of what the market charges for crash protection on the index, eased 0.55%, and yesterday’s options flow showed no demand for tail protection. In our view that may suggest traders are paying for wider moves rather than bracing for a crash.
Backdrop: new US limits on remote access to advanced AI chips weighed on technology, according to the Saxo Market Quick Take. The S&P 500 fell 1.92% to 7,416.59, below the bottom of the range priced for the week, using 108% of it on the first day. The semiconductor fund lost 5.11%, and the flow had no readable direction.
That is the whole brief in one read. The sections below hold the detail behind each paragraph, with the charts, the full set of readings and the sources, for when you want to go deeper on one part.
Headline driver
US stocks fell for a third straight session on Monday as technology losses deepened, according to the Saxo Market Quick Take. The US Commerce Department issued a rule restricting remote access to advanced AI chips, requiring licences for data centres worldwide that may supply computing power to China and other restricted countries. Nvidia fell 4.1% and slipped behind Microsoft in market value, while Alphabet lost 4.1% and Amazon 3.3%.
Nvidia reports after the US close today, its first report since its chief executive resigned. Cleveland Fed President Hammack said she favours small and steady rate increases, and markets price about 88 basis points of further Fed tightening by mid-2027. In Asia this morning Taiwan’s Taiex fell about 2.5% and the Kospi 2.6%.
Market snapshot
- US (Monday 16 November close): S&P 500 7,416.59, down 1.92%. Nasdaq 100 27,197.15, down 2.67%. The Dow fell 1.41% to 51,613.15 and the equal-weighted S&P 500 1.02%. Small caps fell 1.66%, the semiconductor fund 5.11% and Nvidia 4.12% to 156.14.
- Europe (Monday close): the Stoxx 600 fell 0.28% to 662.31, the Euro Stoxx 50 0.60% to 6,348.35 and the DAX 0.57% to 26,598.64. The FTSE 100 slipped about 0.2%.
- Asia (Tuesday, 05:00 CET): the Kospi was down 1.79% and the Hang Seng 0.77%, while China’s CSI 300 was flat.
- Commodities and rates: Brent traded at 91.55 and WTI at 84.98, after Brent settled at 92.44 on Monday following a 3.5% fall. Gold futures traded at 3,873.2, with the Quick Take reporting a 13-month low of 3,832 on Monday, and silver futures at 47.34. The ten-year Treasury yield sat near 5.13%, the two-year near 4.82%, and the dollar near 159.27 yen.
- Market regime: neutral, with the VIX at 22.91, the cash curve close to flat and SKEW at 146.33, below its 60-session median.
Index levels and volatility readings from the watchlist export taken at 05:00 CET on 17 November 2026, which carries Monday’s US and European closes and early Asian trading; Nvidia’s market value, the FTSE 100, Brent’s settlement, gold’s low and policy context from the same-morning Saxo Market Quick Take. Past performance is not indicative of future results. Source: Saxo, Bloomberg, CBOE.
Volatility surface
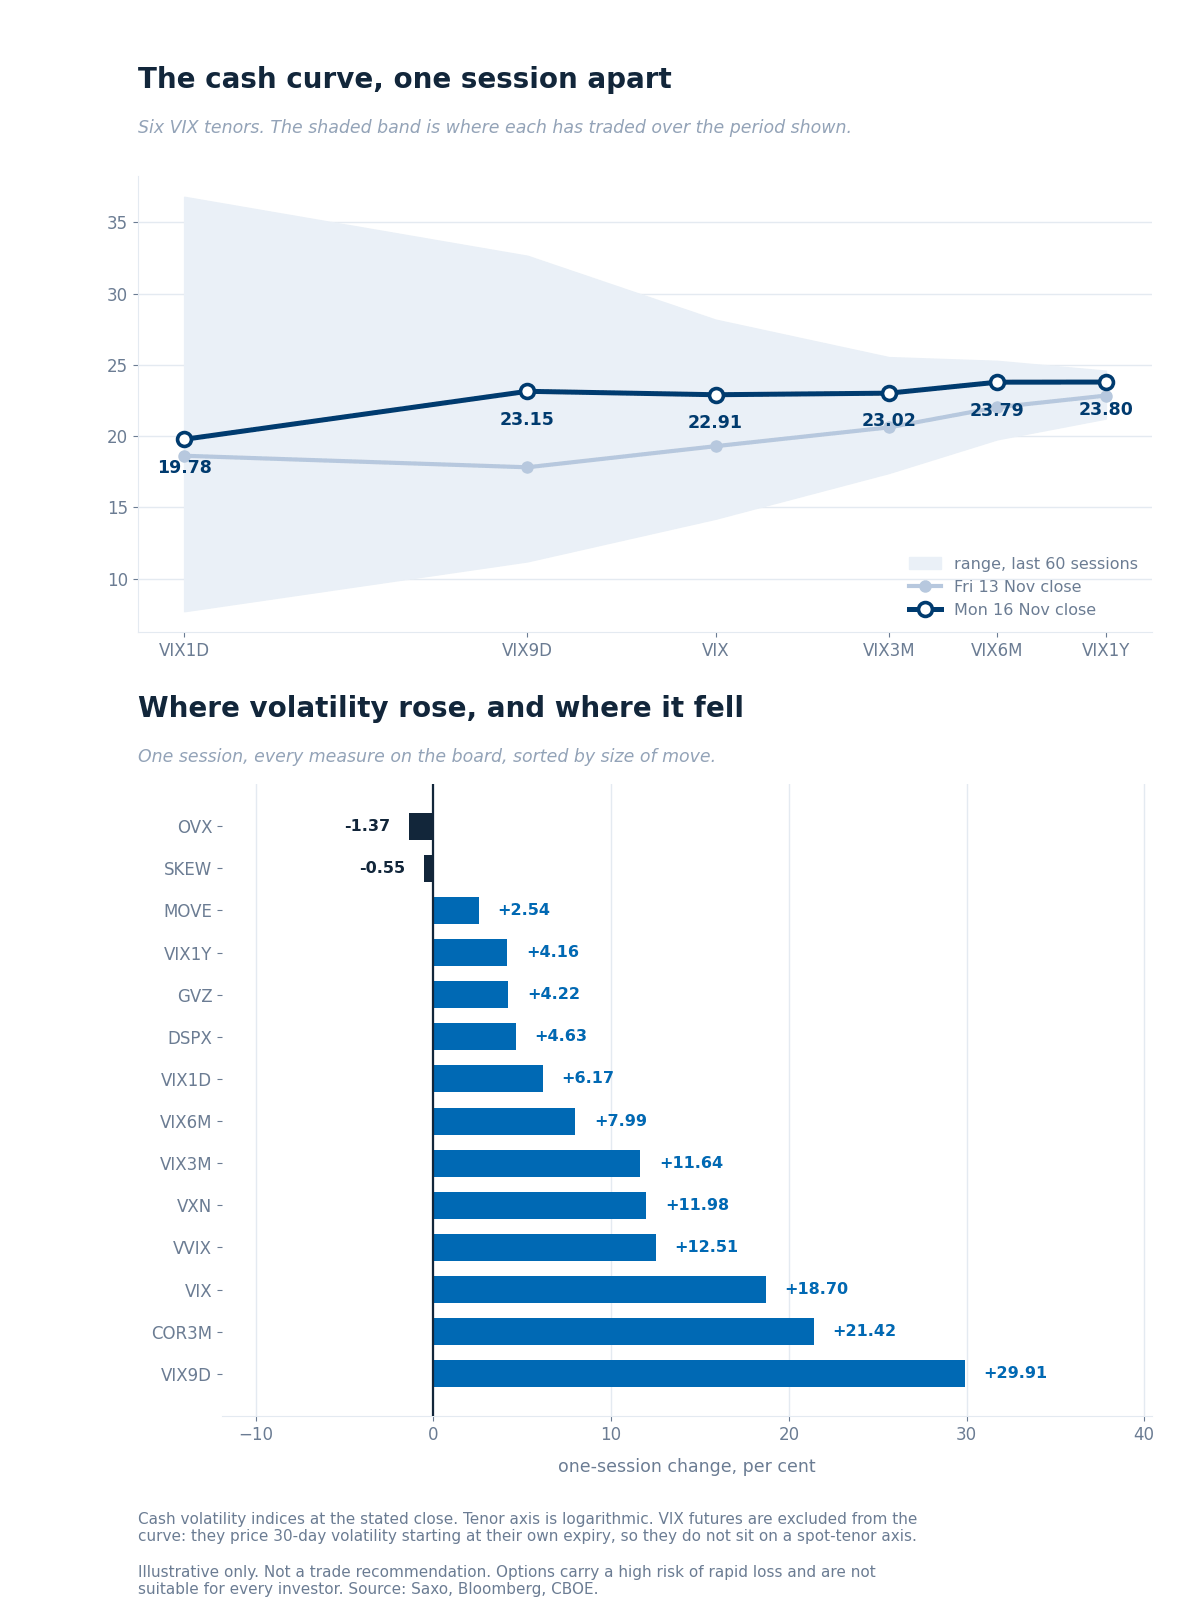
The cash curve at Monday’s close against Friday’s, over each tenor’s 60-session range, with the one-session change across every measure. Illustrative only. Past performance is not indicative of future results. Source: Saxo, Bloomberg, CBOE.
The whole curve rose, and the front rose most. The nine-day gauge jumped 29.91% to 23.15, above both the VIX, up 18.70% to 22.91, and the three-month at 23.02. The one-day gauge rose a smaller 6.17% to 19.78. The cash curve now sits almost flat between 22.91 and 23.80. VVIX, the volatility of the VIX, rose 12.51% to 114.23, and MOVE, the Treasury volatility gauge, 2.54% to 101.29. VIX futures stay off the chart, since each prices a month from its own expiry.
Ratios. VIX3M/VIX fell to 1.00 from 1.07. VXN/VIX eased to 1.44 from 1.52.
VIX futures. A parity check on the 18 November options puts the November contract at about 22.12, against 19.44 on the same check a session earlier, and below spot. December trades at 20.95, below November, so the front of the futures curve has turned from contango to backwardation. The feed’s 20.65 fails that check.
Tails and correlation. SKEW eased 0.55% to 146.33, below its 60-session median of 149.22. Implied correlation, a gauge of how closely stocks move together, jumped 21.42% to 15.93, well above its 60-session median of 11.71, and the dispersion index rose 4.63% to 40.20.
Single-name volatility
Single-name volatility rose almost everywhere. On a common set of 520 underlyings the median implied-volatility rank rose to 36.2 from 29.3, with 451 names up and 64 down, and the count at a rank of 80 or more more than doubled to 28 from 13. The US median jumped to 49.8 from 38.6, while the euro-zone median rose only to 26.9 from 25.0.
The index measures above rose, and the large index funds rose further. The S&P 500 fund’s rank almost doubled to 53.1 from 27.2, the Nasdaq 100 fund rose to 81.5 from 60.0 and the small-cap fund to 37.9 from 17.7. The semiconductor fund rose to 81.8 from 63.4. Nvidia, which reports tonight, reached 100.0, the top of its year, from 92.9, and Broadcom rose to 95.7 from 79.8. Tesla jumped to 68.0 from 42.7 and Alphabet to 60.2 from 42.0. Home Depot, also reporting today, barely moved at 72.6.
Implied-volatility rank from the Saxo screener, read at about 03:00 CET on 17 November 2026, carrying Monday’s close, against the reading carrying Friday’s close. Source: Saxo.
Options flow sentiment
Based on end-of-day Monday 16 November, yesterday’s positioning, not today’s price action.
- Single-name flow showed no readable direction, with most large positions in technology and chip names crossed at mid-market, and Nvidia’s upside positions into its results sold more than bought.
- Sector and ETF flow showed no demand for tail protection on the index. The only clear hedging was in bank funds, and the one clear directional lean was in positions that gain if long-dated Treasury yields fall.
Where the week's range sits
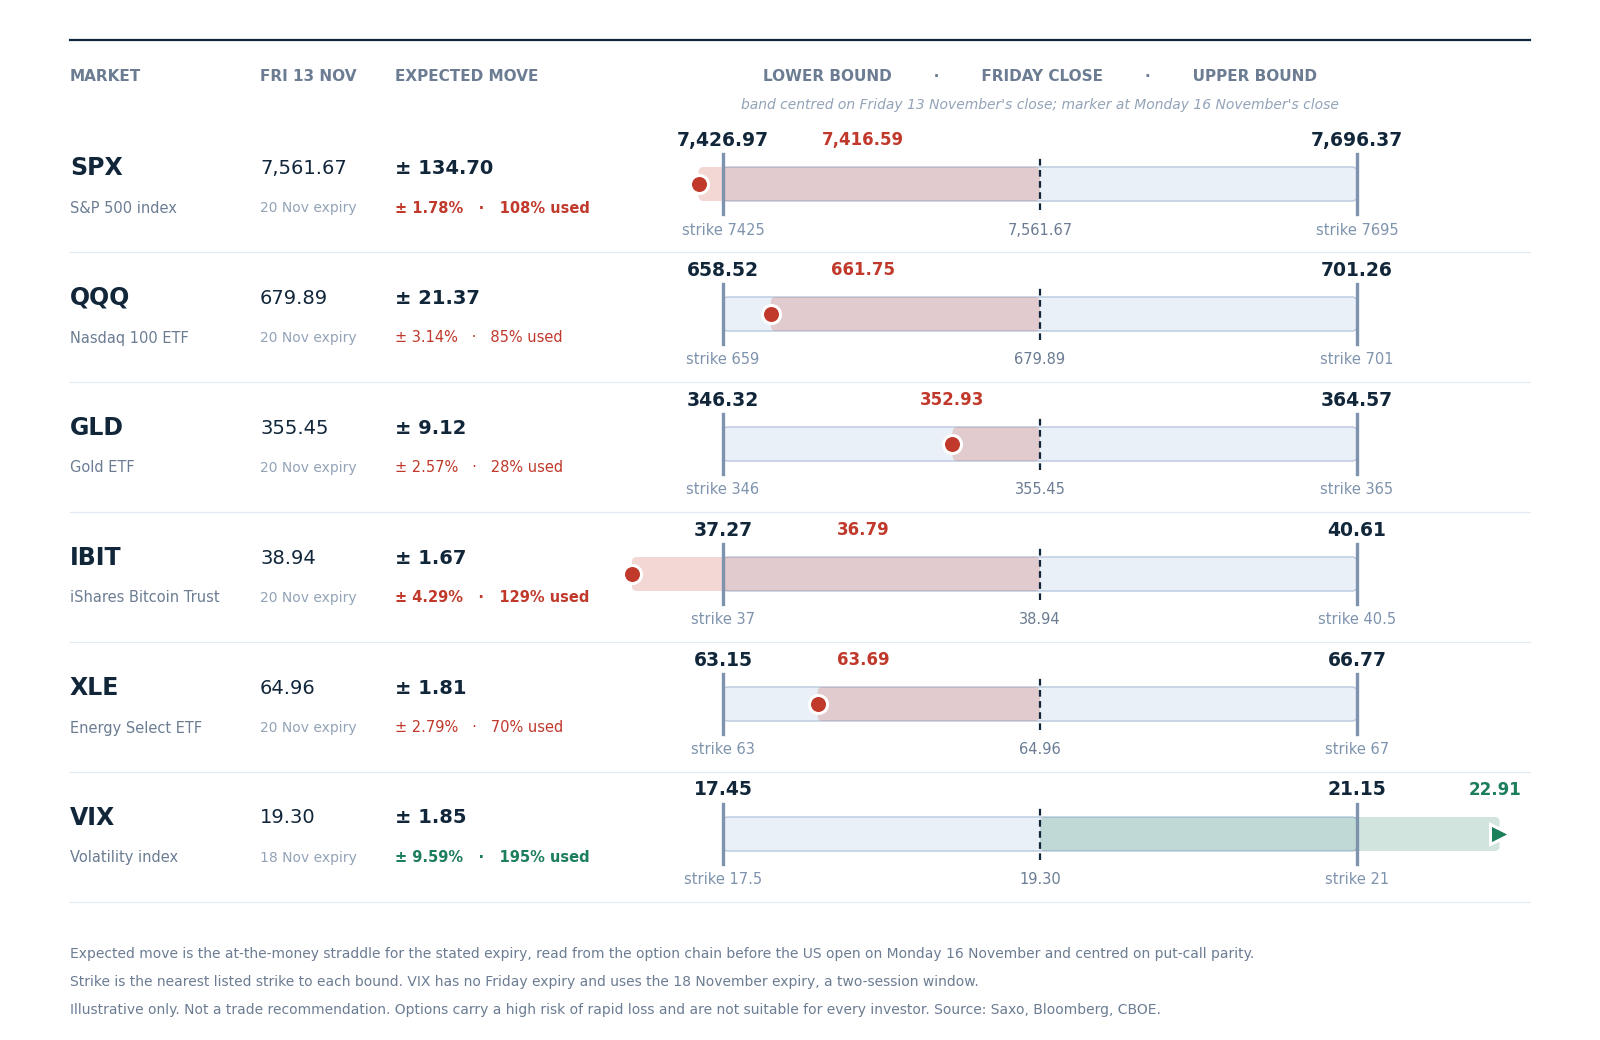
The range the option market priced for this week around Friday 13 November’s close, with each marker at Monday 16 November’s close. Illustrative only, not a trade recommendation. Past performance is not indicative of future results. Source: Saxo, Bloomberg, CBOE.
The S&P 500 used the whole week’s range on its first day. The option market priced 134.70 points around Friday’s 7,561.67 close, 1.78%, from 7,426.97 to 7,696.37, and Monday’s close at 7,416.59 sits below the lower bound, using 108% of the range. The bitcoin fund also closed below its band, using 129%, and the VIX finished far above its own, at 195%.
The Nasdaq 100 fund used 85% of its range and the energy fund 70%, both on the downside, while the gold fund used only 28%. The bands stay fixed for the week; only the markers move. The VIX row uses the 18 November expiry, so it measures two sessions rather than five.
Options carry a high risk of rapid loss and are not suitable for every investor. Costs and charges apply and vary by account and venue; check the rates applicable to you.
Today's catalysts
- Today: 11:00 CET the German ZEW survey; 13:30 CET Fed voter Musalem; 14:30 CET US retail sales for October; 15:10 CET Fed voter Waller; 15:15 CET US industrial production; 15:30 CET the Fed’s Hammack; 20:25 CET Fed voter Williams. Home Depot and Disney report before the US open, Nvidia after the close.
- This week: the Fed minutes at 20:00 CET and UK inflation on Wednesday, with Palo Alto Networks, TJX, Lowe’s and Target; Walmart and Intuit on Thursday.
Earnings scorecard
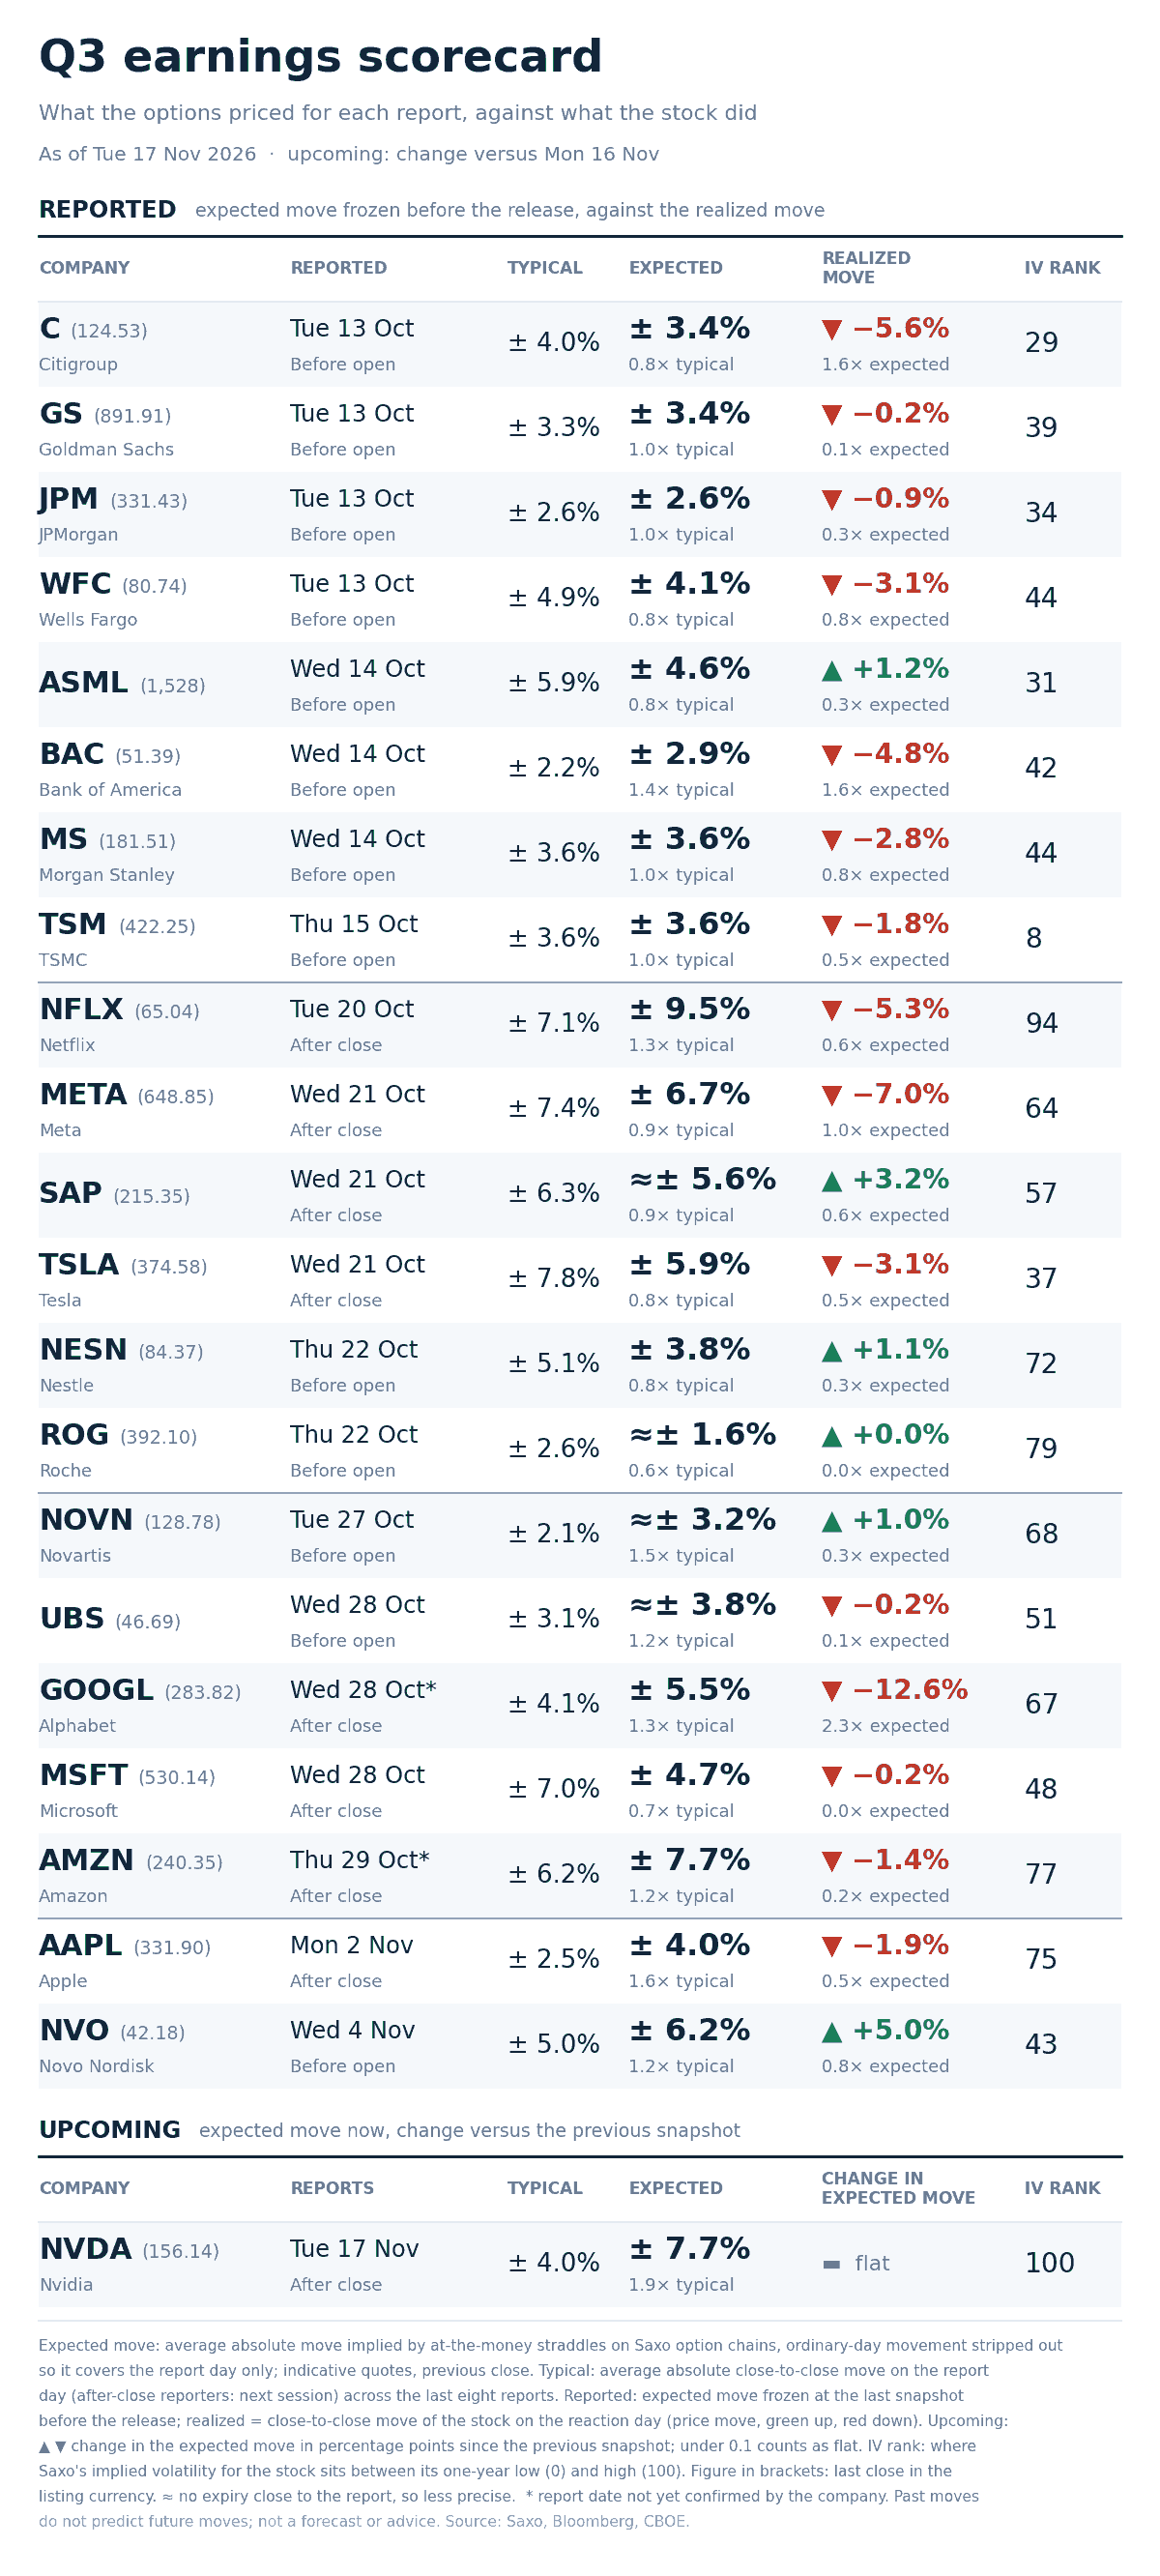
Option-implied expected move for each report day against the stock’s average move after its last eight reports, across the twenty-two names tracked this season. Past performance is not indicative of future results. Source: Saxo, Bloomberg, CBOE.
Nvidia reports tonight after the US close, the last name on the scorecard still to report. Its options price a report-day move of about 7.7%, 1.9 times the 4.0% it has moved on average after its last eight reports, unchanged again. Its last four report-day moves were 3.1%, 5.5% and 1.8% lower and 8.7% higher.
In our view the contrast may matter more today. Nvidia fell 4.12% on Monday and its volatility rank reached 100, yet the price of the report day itself has held at 7.7% since last week, which may suggest the extra premium is going into the sessions around the report rather than into the report.
The other twenty-one names have reported and their board is unchanged.
Options carry a high risk of rapid loss and are not suitable for every investor. Costs and charges apply and vary by account and venue; check the rates applicable to you. Past performance is not indicative of future results.
What the market is pricing
- Session implied range: S&P 500 options price about 0.95%, roughly 71 points, for today’s expiry, from indicative quotes read before the US open. The one-day gauge at 19.78 implies about 1.25%, a one-standard-deviation figure, a different measure from the expected move.
- Clock against price: Monday’s edition quoted 134.70 points, 1.78%, for the 20 November expiry with five sessions left. Time alone would have left about 120 points, roughly 1.59%, and it now prices 146.90 points, 1.98%, so in our view the market has added premium for the rest of the week.
- Week ahead: netting out today leaves about 1.74% for the three sessions after it, which hold the first full reaction to Nvidia’s report and the Fed minutes.
- Correlation read: implied correlation rose 21.42% and the dispersion index 4.63%, while SKEW eased. In our view that may suggest the market is paying for wider moves in general, in the chip names and the index alike, rather than for a crash in the index.
In our view the test may come after tonight’s close, for a market that has already used its whole weekly range and is paying more for the days around Nvidia’s report than for the report itself. Options carry a high risk of rapid loss and are not suitable for every investor. Costs and charges apply and vary by account and venue; check the rates applicable to you. Past performance is not indicative of future results.
| More from the author |
|---|