
Für den Zugriff auf die beiden Plattformen können Sie jeweils dasselbe Saxo-Konto verwenden.

Meta lifted the index, volatility ignored it - Options Brief - 22 September 2026
Options 10 minutes to read

Summary: Meta added 11% and carried the index to a 1.49% gain while the volatility market moved 0.41%. When one stock does the work, index volatility has almost nothing left to price.
Monday produced a large index move that the index volatility market declined to price. The S&P 500 gained 1.49% against 0.55% for its equal-weighted version, and Meta, up 11.34%, supplied most of it.
Implied volatility rose where the movement happened, in individual stocks, and sat still on the index.
MARKET REGIME: LOW VOL BULL | VIX 14.87 | TERM STRUCTURE: CONTANGO | SKEW: ELEVATED (142.19) | FRONT-MONTH VIX FUTURES: 17.83
- A 1.49% index gain moved the 30-day volatility measure by 0.41%. The single-stock measures went the other way, the Nasdaq 100 volatility index up 5.70% to 20.39 and dispersion up 7.83% to 35.79, its highest in six weeks.
- Correlation fell for a third session. COR3M lost 6.01% to 10.32, its lowest in two weeks, while the typical US name’s implied volatility rank rose to 32.7 and the S&P 500 fund’s sat at 8.1.
- The week’s priced range is already spent. The index closed Monday 136% of the way through the move priced for the entire week, in the first session of it.
Where the week’s range sits
What the option market priced for this week, against where Monday left it.
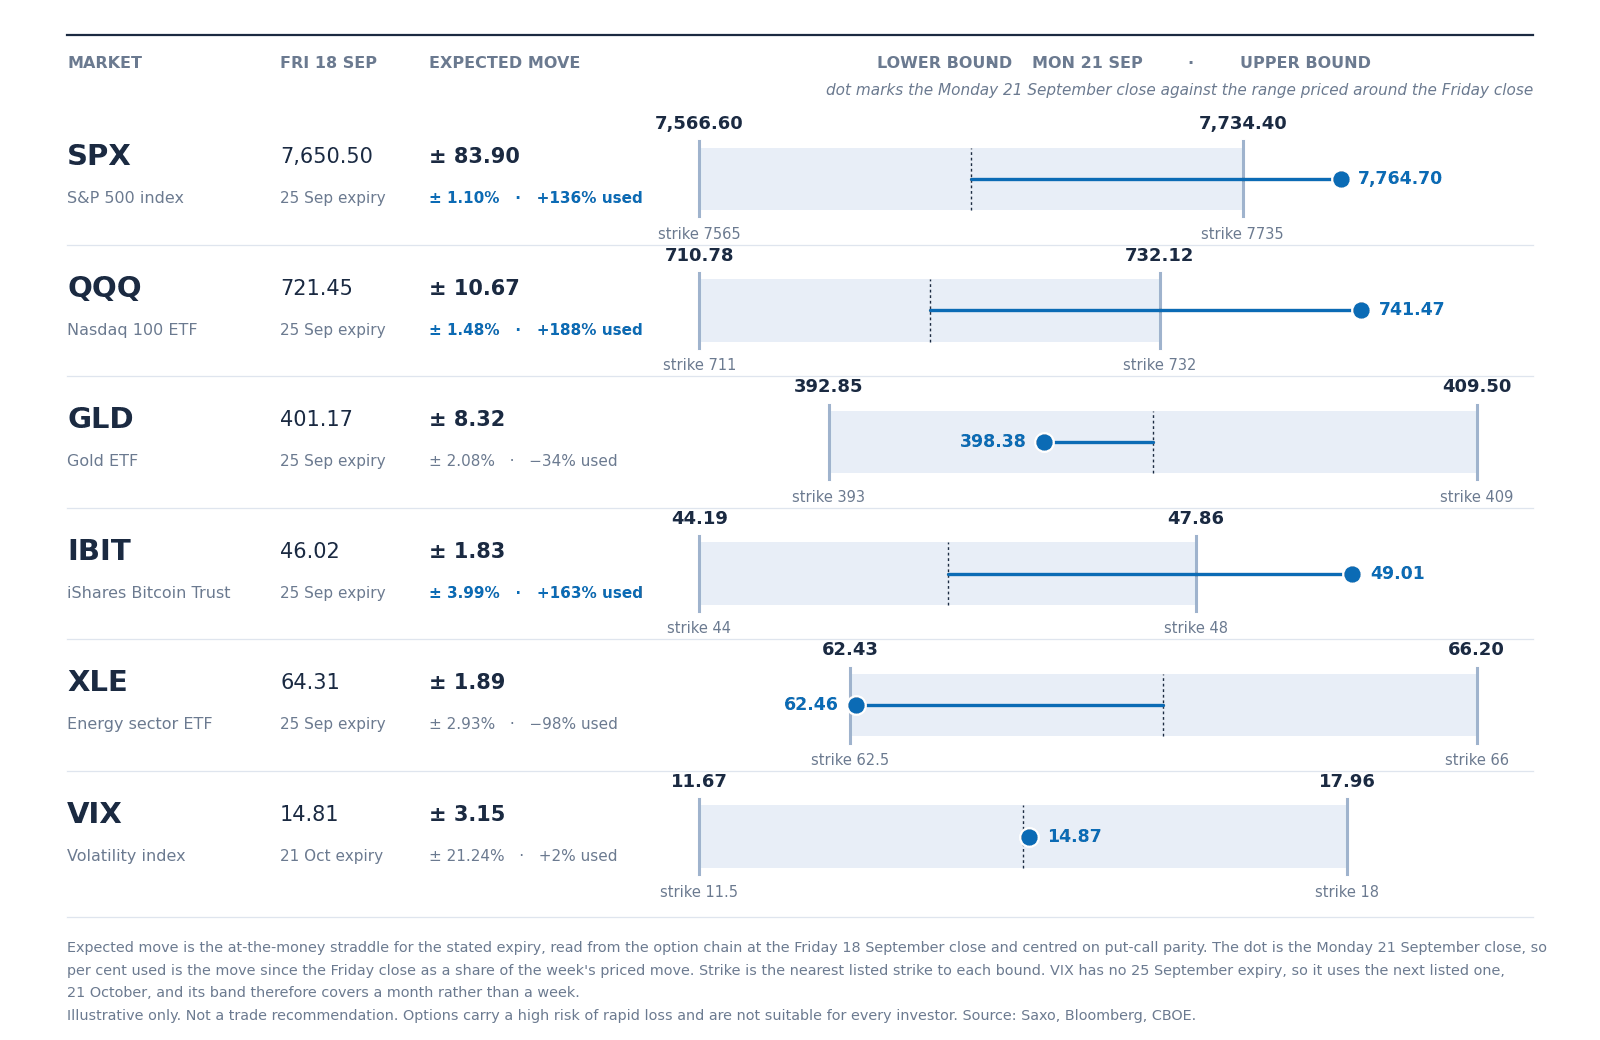 Expected move to the 25 September expiry, drawn around the Friday 18 September close with the nearest listed strike at each bound, and Monday’s close marked. Volatility uses the 21 October expiry, so its band covers a month. Read from the chain at Friday’s close and centred on put-call parity, not a forecast.
- Three of the six are already outside the band. The S&P 500 has used 136% of its 83.90 point range, the Nasdaq 100 fund 188% of 10.67 and the bitcoin fund 163% of 1.83, with four sessions still to run.
- The two that fell, fell on their own. The energy fund sits at 62.46, a hair inside a lower bound of 62.43, and gold has used a third of its range downward, while volatility has moved 1.9% of a month-long band. In our view a week that spends its equity range on day one while its volatility band sits untouched may say more about which instruments moved than about how far. Options carry a high risk of rapid loss and are not suitable for every investor; see Saxo pricing for costs and charges on exchange-traded fund trades.
Headline driver
A technology-led rally carried the Nasdaq Composite to its twenty-first record close of 2026, with Meta Platforms up 11.34% on early traction for its Muse artificial intelligence agent and the chip complex close behind.
Softer oil and an easier 10-year yield helped. More in Saxo’s macro coverage, today’s Market Quick Take and Charu Chanana’s read on what the session says about portfolio concentration.
Market snapshot
- US (Monday 21 September close): S&P 500 7,764.70, up 1.49%, Nasdaq 100 30,482.35, up 2.83% in its best session since early August, and the Dow 52,054.19, up 0.71%. The equal-weight S&P 500 added 0.55% and the Russell 2000 fund 0.52%. Meta led at 11.34% and the semiconductor fund rose 4.02%, with Advanced Micro Devices near 10% and Intel around 12%, against Apple at 0.85%.
- Europe (Monday 21 September close): a broad advance after three weekly declines, the Stoxx 600 up 1.02% to 641.94 in its largest gain since early July, the DAX 1.07% to 25,575.01 and the Euro Stoxx 50 1.31% to 6,318.21.
- Asia (Tuesday 22 September session, in progress): the Kospi leads again at 7,114.31, up 1.52%, with the CSI 300 up 0.51% and the Hang Seng 0.36% higher. Japan is on holiday through Wednesday.
- Commodities and rates: Brent trades near USD 102, firmer after four declines, though energy equities were Monday’s weakest corner with the sector fund down 2.88%. Gold is near USD 4,378, a second day lower. The US 10-year yield eased five basis points to 4.95%, the 2-year unchanged near 4.75%. EURUSD 1.1473, USDJPY 157.49.
- Market regime: Low Vol Bull, VIX 14.87, with the S&P 500 1.89% above its 50-day moving average and 20-day realised volatility at 10.4%, falling.
Data source: Saxo, Bloomberg, CBOE, as of 22 September 2026, approximately 06:00 CET. Past performance is not indicative of future results.
Options flow sentiment
Based on end-of-day 21 September, Monday’s positioning and not today’s price action.
- Single-name flow the mega-cap tape was barbelled rather than directional. The name that led the index took most of the group’s confirmed-opening premium on both sides at once, near-dated upside bought and part-financed by a sold higher strike, against long-dated downside bought in comparable size. Semiconductor premium leaned to calls, but nearly all of it crossed at the mid, and the group’s one clean ask-side print was a bought put.
- Sector and ETF flow the index tape looked bullish on the headline split and defensive underneath it. Calls took roughly three-fifths of confirmed-opening premium, but that total rests on deep in-the-money lines and paired volatility legs crossed at the mid, while every clean ask-side index line was a put. Defensive and energy funds printed the same shape, near-money downside bought and upside sold against it. Named funds are market context only; see Saxo pricing for costs and charges on exchange-traded fund trades.
Volatility surface - 22 September 2026, approx. 06:00 CET
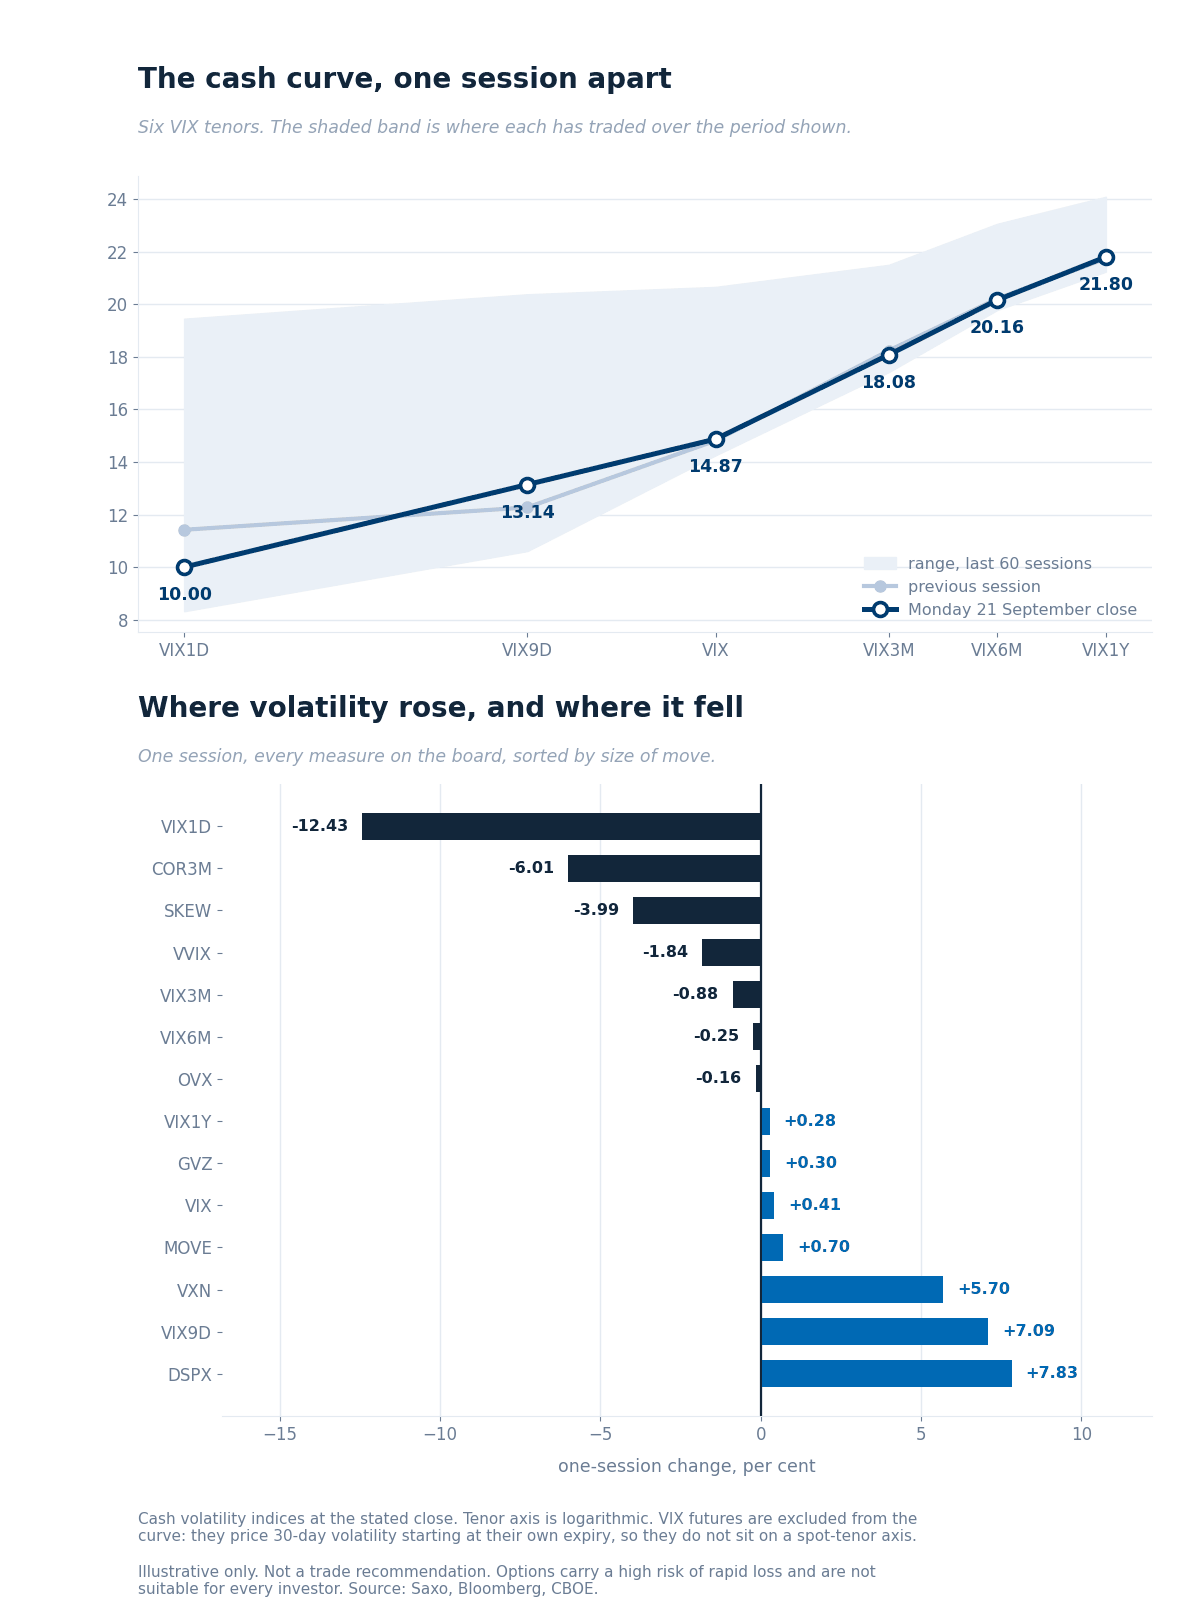 The six cash VIX tenors at Monday’s close against the previous session and the range each has held across 60 sessions, with the one-session change across every measure below.
Reading the curve
- The front of the curve split in two. VIX1D fell 12.43% to exactly 10.00, its lowest in three weeks, while VIX9D rose 7.09% to 13.14. Today holds no scheduled event of consequence and the rest of the week holds two, which is the shape that leaves the one-day measure on the floor and the nine-day above it.
- Ratios, which the graphic does not carry. VIX3M to VIX at 1.22, and VXN to VIX at 1.37, up 5.42% and the widest in two weeks.
VIX futures
- Front-month 17.83, the October contract, confirmed by put-call parity at 17.89 across three adjacent strikes. Against a 14.87 cash close that is a premium of roughly 2.96 points, against 3.05 a session earlier.
- Second-month 18.55, ratio 0.960, contango. Neither is in the graphic: both price 30-day volatility starting at their own expiry, so neither sits on the spot-tenor axis.
Data source: Saxo, Bloomberg, CBOE, as of 22 September 2026, approximately 06:00 CET. Past performance is not indicative of future results.
Single-name volatility - where implied volatility sits against its own year
Saxo’s implied-volatility rank across 149 US and 325 euro-zone option underlyings, where 0 is a one-year low and 100 a one-year high.
- The whole list got dearer on a day the index did not. The typical US name rose from 29.8 to 32.7 and the share above 50 went from about one in nine to one in five, Europe the same way to 33.2. This is the correlation reading from the other side: insuring the parts got dearer, insuring the whole did not.
- Communication services was the mover. Its median rank jumped from 41.2 to 53.0 on Meta alone, which went from 43.1 to 64.2, a level exceeded on fewer than one day in eight. Technology rose to 37.7, energy is still dearest at 56.8.
- The index group is the cheapest corner of the list, and it barely moved. Its median rank went from 10.2 to 10.9, and the S&P 500 fund ranks 8.1 on a level exceeded on roughly nine days in ten. Rank measures distance from the year’s extremes rather than how often a level has been seen, and here the two agree: on a session when the index travelled 1.49%, insuring it stayed near its cheapest of the year. Named funds are market context only; see Saxo pricing for costs and charges.
Data source: Saxo, as of 22 September 2026, reflecting the 21 September close. Day counts are Saxo’s one-year implied-volatility percentile. Past performance is not indicative of future results.
What the market is pricing
- Session implied move. SPX options price about 0.41% to tonight’s close, roughly 32 points, derived from at-the-money option pricing rather than any forecast. The cash session runs 15:30 CET to the 22:00 CET close, so the Philadelphia Fed survey at 14:30 CET lands before the bell while the Richmond Fed index at 16:00 CET falls inside the expiry.
- Event implied range. Friday’s expiry prices 0.91%, about 71 points. The same expiry carried 1.13% in yesterday’s edition with one more session to run, and flat volatility with one session less would have left about 1.01%. Roughly a tenth has come out on top of what the clock explains, which is implied volatility falling into a rally rather than decay.
- Tail risk signal. SKEW fell 5.91 points to 142.19, its lowest in five weeks and more than giving back Friday’s 2.40 point rise. In our view the crash bid may be being sold back into strength, leaving the surface cheaper in the tail while the index measure barely moves at the money.
- Correlation and dispersion read. COR3M at 10.32, dispersion at 35.79 and the index group at a median rank of 10.9 put a very low price on the market moving as one. In our assessment Monday appears to be that bet paying off, a narrow group carrying the index with the index’s own volatility left untouched.
Options carry a high risk of rapid loss and are not suitable for every investor. Past performance is not indicative of future results.
Today’s catalysts
ECB President Lagarde speaks at 13:00 CET, the US weekly ADP employment change lands at 14:15 CET and the September Philadelphia Fed non-manufacturing survey at 14:30 CET, all before the 15:30 CET equity open.
Inside the session, the US September Richmond Fed manufacturing index and euro-zone preliminary consumer confidence arrive at 16:00 CET, the Federal Reserve’s Williams speaks at 16:05 CET and the Treasury auctions 2-year notes at 19:00 CET.
Trump addresses the United Nations today. Later this week: Meta Connect on Wednesday, the Trump-Xi summit on Thursday, and results from Autozone today, Cintas and Paychex on Wednesday, Costco and H&M on Thursday. Future outcomes are uncertain and may result in losses.
Conclusion
A week’s worth of priced range went in one session and the index volatility market barely registered it, because the move belonged to a few names rather than to the market.
That is what a correlation reading of 10.32 is for, and Monday is what it looks like when it is right.
In our view the question worth carrying into today is not whether the index is calm but what is left to pay for. Four sessions of an already spent range still have to be traded. Options carry a high risk of rapid loss and are not suitable for every investor. Past performance is not indicative of future results.
Important note: The strategies and examples provided in this article are purely for educational purposes. They are intended to assist in shaping your thought process and should not be replicated or implemented without careful consideration. Every investor or trader must conduct their own due diligence and take into account their unique financial situation, risk tolerance, and investment objectives before making any decisions. Remember, investing in the stock market carries risk, and it’s crucial to make informed decisions.
| More from the author |
|---|