
You can access both of our platforms from a single Saxo account.

Intel into earnings: three butterflies for three views

Summary: Intel’s options are priced at the top of their yearly volatility range heading into 23 July earnings, so how a position is built matters as much as which way it bets. Three defined-risk butterflies, one each for a bullish, bearish and neutral view, show how to trade the move the market is already pricing.
When implied volatility is this expensive, what a trader pays to take a view can matter more than the view itself.
Intel (INTC) closed at $110.24 on 9 July 2026 and reports second-quarter results after the close on 23 July 2026 (Source: Saxo and Bloomberg, as of 9 July 2026). The options market is treating the print as a genuine binary. Thirty-day implied volatility sits near 87%, in roughly the 94th percentile of its past year, so options are about as expensive as they have been in twelve months (Source: Bloomberg, as of 8 July 2026).
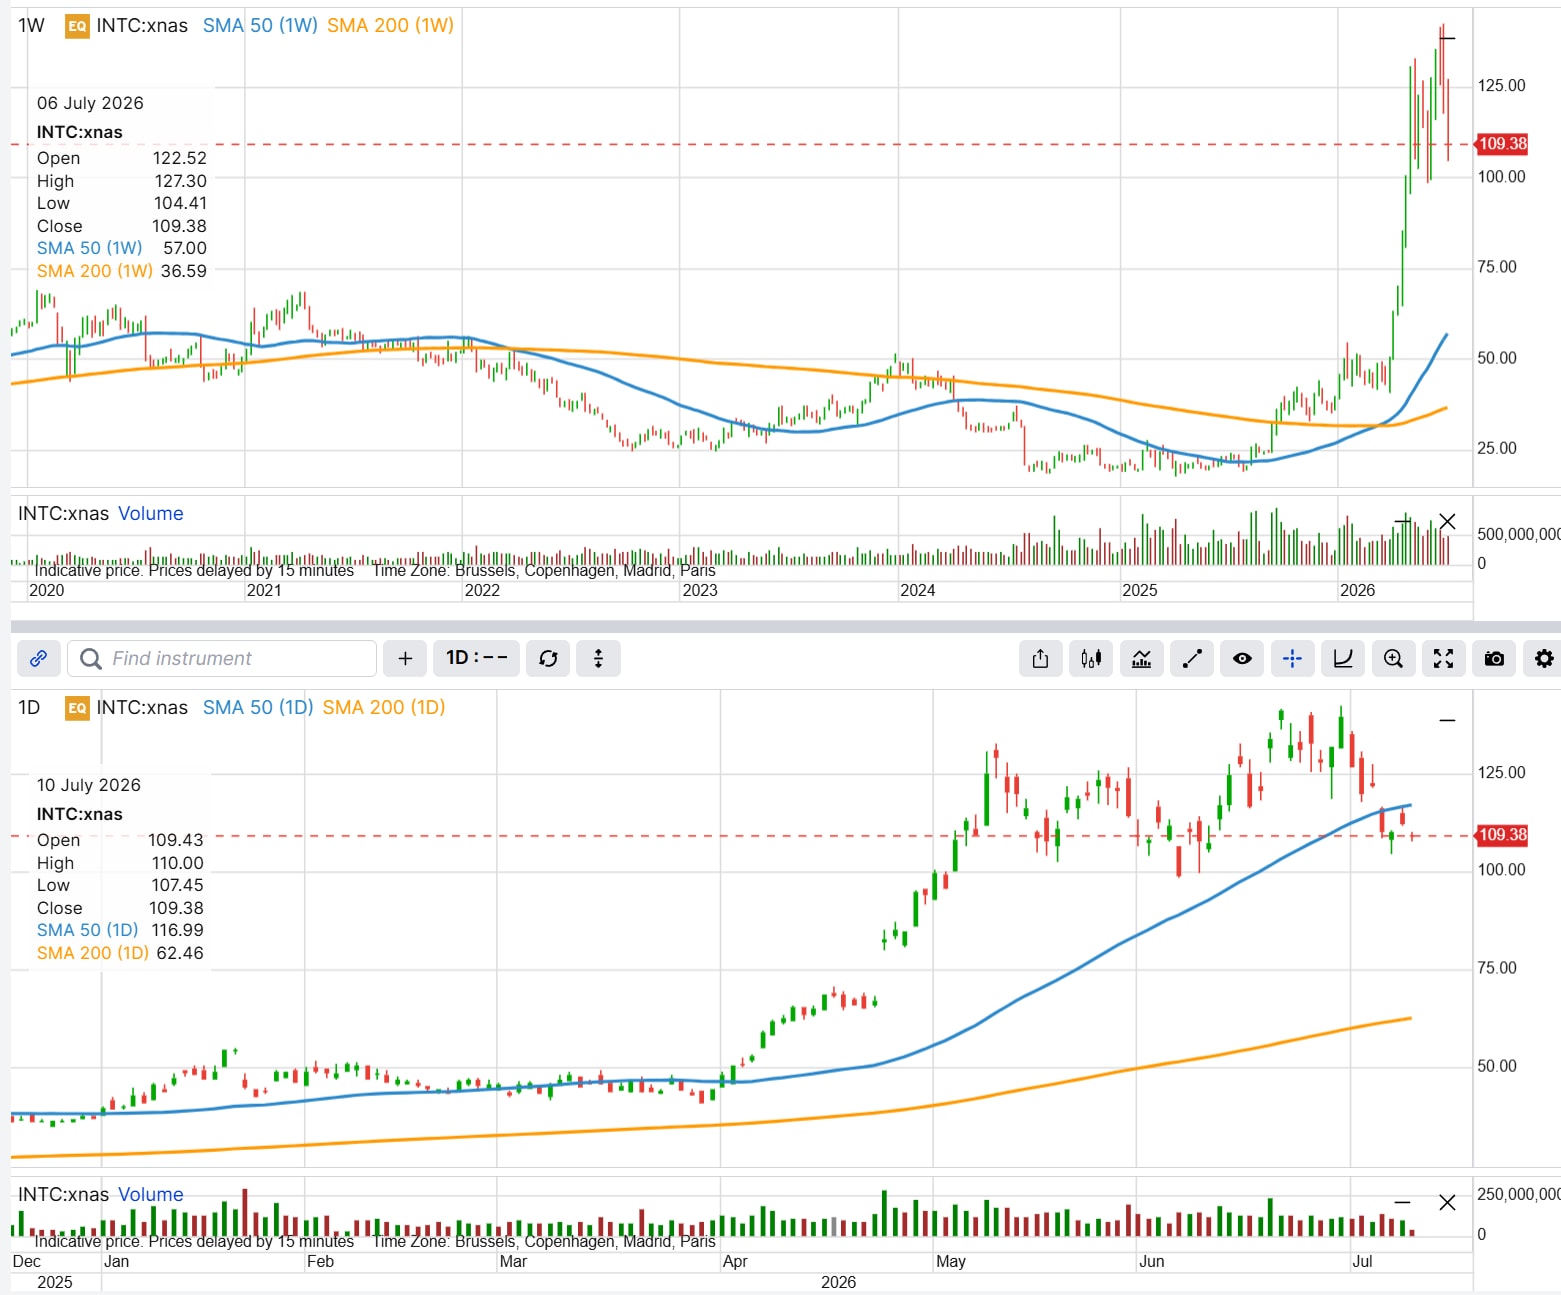 Intel (INTC), weekly and daily with 50 and 200 period moving averages, as of 10 July 2026. A multi-year base gave way to a steep 2026 rally, with price pulling back toward $109 into the quarter. This chart is illustrative and educational, not predictive. Past performance is not indicative of future results. Source: SaxoTrader
The uncertainty is not manufactured. Analyst price targets run from around $120 to a Street high near $200, wide enough to show the market has not settled on what Intel’s foundry ambitions are worth (Source: Bloomberg, as of 10 July 2026). For a trader weighing the event, the question is whether the risk and reward justify a position at all, and if so, how to take a view without overpaying for volatility that tends to collapse once results are out.
Reading the expected move. A rough way to see what the options market is pricing is to add the at-the-money call and put for the expiry that captures the event. For the 24 July expiry, the first weekly Friday after the report, the at-the-money call and put together cost about $19.30, or near 17% of the share price (Source: Saxo, as of 9 July 2026 close, indicative pre-open). That straddle implies a one-standard-deviation move of roughly 15% by that expiry, while Bloomberg’s earnings-specific implied move is closer to 11% (Source: Bloomberg, as of 8 July 2026). The 15% carries two weeks of calendar time on top of the print, so the structures below anchor their bodies to the roughly 11% the market attaches to the earnings move itself. Either way, the market is paying for a large move. The 17 July monthly expiry sits before the report, the wrong series for an earnings view.
That rich premium is the reason to reach for butterflies. A butterfly sells the expensive middle of the distribution and buys cheaper wings, making it a net seller of the elevated volatility. In a broken-wing version, one wing is set further from the body than the other, and that skipped distance is what cheapens the structure, often into a net credit. Its peak payoff can be placed at the move the market is already pricing rather than at today’s price, so the post-earnings drop in implied volatility works for the position instead of against it.
Important note: The strategies and examples provided in this article are purely for educational purposes. They are intended to assist in shaping your thought process and should not be replicated or implemented without careful consideration. Every investor or trader must conduct their own due diligence and take into account their unique financial situation, risk tolerance, and investment objectives before making any decisions. Remember, investing in the stock market carries risk, and it’s crucial to make informed decisions.
Bullish view: the turnaround gets the benefit of the doubt
A trader who believes the foundry progress and cost discipline are real, and that the print rewards them, might look first at a call spread. But a call spread bought at the 94th percentile of implied volatility pays up for premium that deflates as soon as the numbers land. A broken-wing call butterfly can finance most of the position with the two richly priced short calls.
The following examples are hypothetical and for educational use only; they are not advice or trade recommendations.
Example structure (illustrative only – not a trade recommendation)
- Buy 1 24 July 118 call
- Sell 2 24 July 122 calls
- Buy 1 24 July 130 call
- Net credit: approximately $0.70 per spread
- Maximum profit: approximately $470, near $122 at expiry
- Maximum risk: approximately $330, above $130
- Break-even at expiry: approximately $126.70
The loss is defined at entry; the short 122 calls are American-style and can be assigned early. Costs and charges apply to each of the four legs; see Saxo pricing for full details.
The two short 122 calls sit at the roughly 11% up-move the market is pricing and pay for the 118 and 130 wings, leaving a small credit that is kept if Intel drifts or falls.
Strategy insight, placing the body at the move, not the price. Illustrative only. This structure may pay the most if Intel rises to around the priced move by expiry, and because it is opened for a credit it carries no loss to the downside; the maximum loss, roughly $330, sits above the upper wing near $130 if the stock overshoots. A butterfly rewards a specific landing zone, so a gap well past $130 can turn a correct directional call into a capped loss.
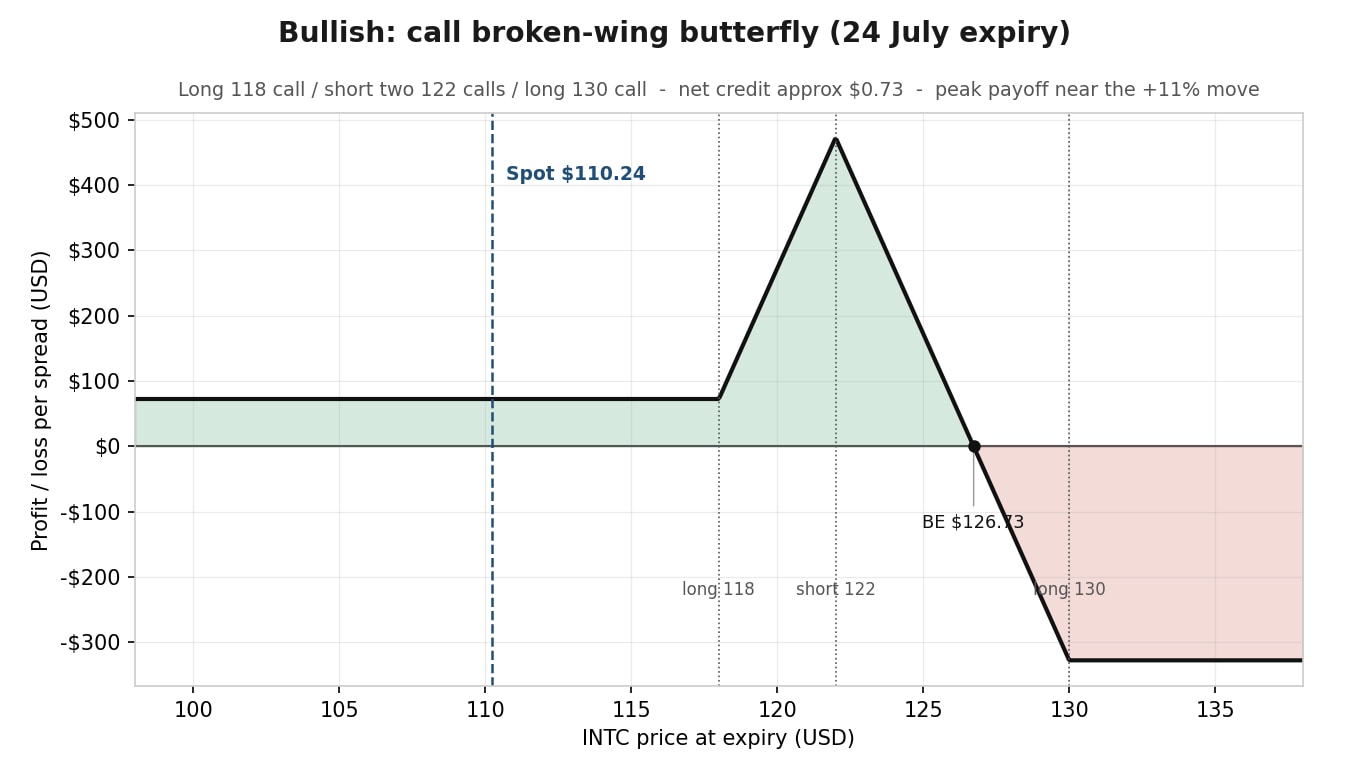 INTC bullish call broken-wing butterfly - illustrative profit and loss at the 24 July expiry for the call broken-wing butterfly, peak near the priced up-move. Indicative pre-open pricing. This chart is illustrative and educational, not predictive. Illustrative only. Not a trade recommendation. Source: Saxo
Bearish view: the market loses patience
The mirror case is that the turnaround proves slower and costlier than hoped and the guidance disappoints. Rather than an outright put, the same broken-wing logic applies with puts, the body at the roughly 11% down-move near $98.
The following examples are hypothetical and for educational use only; they are not advice or trade recommendations.
Example structure (illustrative only – not a trade recommendation)
- Buy 1 24 July 101 put
- Sell 2 24 July 98 puts
- Buy 1 24 July 93 put
- Net credit: approximately $0.37 per spread
- Maximum profit: approximately $335, near $98 at expiry
- Maximum risk: approximately $165, on a deep decline below $93
- Break-even at expiry: approximately $94.65
The loss is defined at entry; the short 98 puts are American-style and can be assigned early. Costs and charges apply to each of the four legs; see Saxo pricing for full details.
Strategy insight, a controlled decline, not a crash. Illustrative only. The position may profit most on an orderly slide toward $98 and keeps its small credit if Intel instead rises, but the maximum loss of about $165 appears on a large drop below $93, past the body into the lower wing. Unlike an outright put, this is not downside protection. A violent collapse, the very move a bear is hoping for, is where it loses the most. It is a bet that the stock falls to about the expected move, not as far as possible.
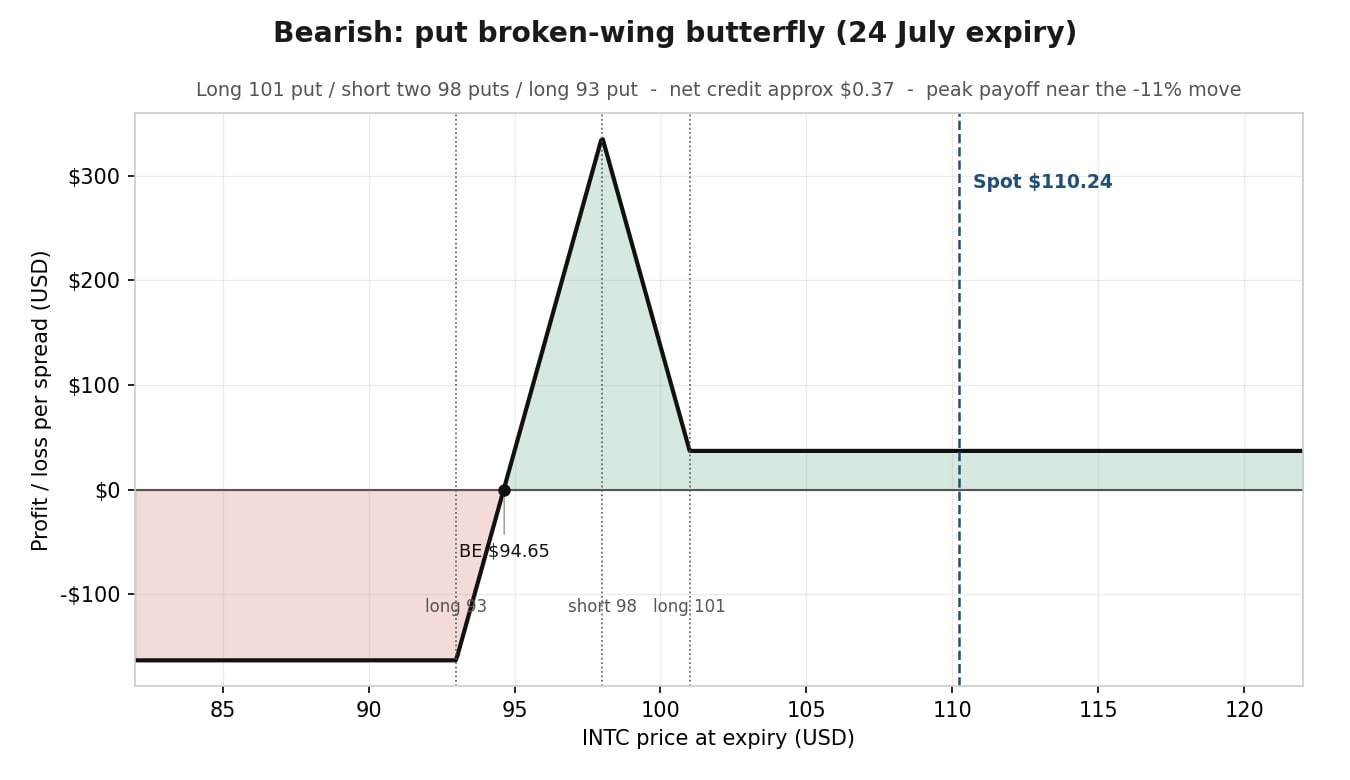 INTC Bearish Put Broken Wing Butterfly - illustrative profit and loss at the 24 July expiry for the put broken-wing butterfly, peak near the priced down-move. Indicative pre-open pricing. This chart is illustrative and educational, not predictive. Illustrative only. Not a trade recommendation. Source: Saxo
Neutral view: the move is priced too richly
The third view takes no side on direction and instead argues that a 15% move is more than Intel is likely to deliver. An iron butterfly expresses that by selling the at-the-money call and put and buying wings at the expected-move boundaries.
The following examples are hypothetical and for educational use only; they are not advice or trade recommendations.
Example structure (illustrative only – not a trade recommendation)
- Sell 1 24 July 110 call and sell 1 24 July 110 put
- Buy 1 24 July 122 call and buy 1 24 July 98 put
- Net credit: approximately $9.55 per spread
- Maximum profit: approximately $955, near $110 at expiry
- Maximum risk: approximately $245, beyond the wings
- Break-even at expiry: approximately $100.50 and $119.60
The loss is defined at entry; the short at-the-money legs are American-style and can be assigned early. Costs and charges apply to each of the four legs; see Saxo pricing for full details.
The short 110 call and put collect the fat at-the-money premium and define the zone the position needs Intel to hold. The long 122 call and 98 put cap the risk if it does not. For equal-width wings the maximum loss is the wing width less the credit, roughly $245, not the two wings added together.
Strategy insight, selling premium with a floor under it. Illustrative only. The trade may keep most of its credit if the realised move stays inside the break-evens near $100.50 and $119.60, and its maximum loss is fixed at about $245 the moment it is opened, the reason to prefer a defined-risk iron butterfly over a naked short straddle. Selling volatility is defensible here because it sits in the 94th percentile, not despite it.
It is worth setting this against its close cousin, the short iron condor. Both are defined-risk, both sell premium, and both profit when the realised move stays modest, so the choice comes down to where the short strikes sit. An iron butterfly keeps them together at the at-the-money strike, collecting the fattest credit but concentrating the profit at a single point near $110. An iron condor spreads them apart into an out-of-the-money short call and short put, trading a smaller credit for a wider profit zone. The butterfly fits a view that Intel pins close to one level; the condor fits a view that Intel simply holds a range, offering more room for error in exchange for a lower, more probable payoff. In practice, the higher the conviction on a specific landing price, the more a butterfly earns its place over a condor.
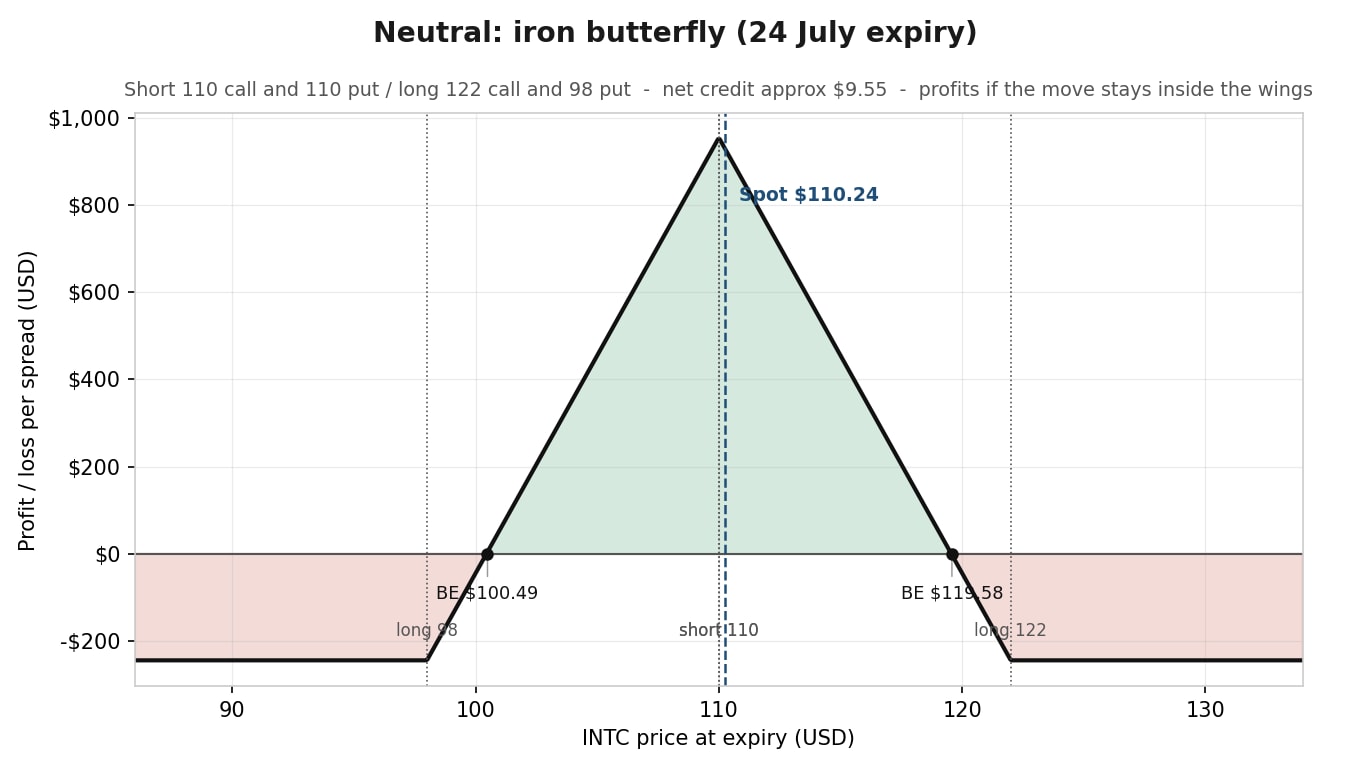 INTC Neutral Iron Butterfly - illustrative profit and loss at the 24 July expiry for the iron butterfly, profit inside the wings. Indicative pre-open pricing. This chart is illustrative and educational, not predictive. Illustrative only. Not a trade recommendation. Source: Saxo
Before placing any of these, check
- Bid and ask spreads on each leg, since four-legged structures widen the round-trip cost
- Volume and open interest at the selected 24 July strikes
- That the report lands after the close on 23 July, so the position carries the event overnight
- Implied volatility against how much Intel tends to move, since the whole premise is that the former looks rich
- An exit plan defined before entry, especially for the short legs
- Costs and charges on every leg, since four legs mean four sets of charges; see Saxo pricing for full details
Assignment risk note: Because Intel options are American-style, the short legs can be assigned before expiry if they move in the money, particularly close to expiration. Monitor any short leg that drifts into the money and understand the platform’s assignment process before entering.
Final thoughts
None of these butterflies predicts Intel’s quarter. Each takes a view about where the stock might land and refuses to pay full price for it. That is the point of trading structure rather than direction when volatility is this expensive. The same move the market charges everyone can be sold back to it as a bullish, bearish or neutral bet, with the loss defined before the trade is on.
The prices here are indicative pre-open figures from 9 July and will move by publication, so the strikes matter less than the method. Rebuild each butterfly around wherever the expected move sits at the time of entry, and reprice every leg from the live chain. The structure travels; the specific numbers do not. Options carry a high risk of rapid loss and are not suitable for every investor.
At the time of writing, the author holds no position in Intel Corporation (INTC).
This content is marketing material and should not be regarded as investment advice. Trading financial instruments carries risks and historic performance is not a guarantee of future results.
The Author is permitted to wait at least 24 hours from the time of the publication before they trade the instruments themselves.
The instrument(s) referenced in this content may be issued by a partner, from whom Saxo receives promotional fees, payment or retrocessions. While Saxo may receive compensation from these partnerships, all content is created with the aim of providing clients with valuable information and options.
This content will not be changed or subject to review after publication.
This content is marketing material and should not be regarded as investment advice. Trading financial instruments carries risks and historic performance is not a guarantee of future results.
The Author is permitted to wait at least 24 hours from the time of the publication before they trade the instruments themselves.
The instrument(s) referenced in this content may be issued by a partner, from whom Saxo receives promotional fees, payment or retrocessions. While Saxo may receive compensation from these partnerships, all content is created with the aim of providing clients with valuable information and options.
This content will not be changed or subject to review after publication.
The Author is permitted to wait at least 24 hours from the time of the publication before they trade the instruments themselves.
The instrument(s) referenced in this content may be issued by a partner, from whom Saxo receives promotional fees, payment or retrocessions. While Saxo may receive compensation from these partnerships, all content is created with the aim of providing clients with valuable information and options.
This content will not be changed or subject to review after publication.
| Related articles/content |
|---|
| What IV crush really means in practice reviewed version | 9 April 2026 Trading earnings with defined | 31 Mar 2026 BABA three option strategies for three market views | 9 July 2026 SPY and SPXW three options strategies for three views | 8 July 2026 Micron Q3 earnings what the options market is pricing ahead of 24 June | 23 June 2026 When the chain opens trading options on the fresh SpaceX SPCX listing | 17 June 2026 After the Nasdaq shock three QQQ option strategies for three market views | 9 June 2026 PayPal earnings trading the expected move with options | 4 May 2026 ArcelorMittal earnings what a 10 options move can teach traders | 28 April 2026 ASML earnings is the 8 move already priced in | 10 April 2026 ASML earnings - how to think about the setup before the numbers | 10 April 2026 Options Brief - Mag 7 earnings night Fed holds - 29 April 2026 Options Brief - Mag 7 earnings on deck - 28 April 2026 Options Brief - Oil jolt - US records - 23 April 2026 |
| More from the author |
|---|