
Access all our platforms from a single account.

Tesla earnings: the median says small, the average says big. What do options price?

Summary: Tesla's typical earnings reaction is about 4.5%, but its average is about 7.8%, lifted by two very large moves. Options price something close to the larger number. Which history fits better?
Two correct summaries of the same eight reports, and one price to hold them against.
Tesla will publish its third-quarter 2026 results after the US market close on Wednesday 21 October 2026, with a webcast at 23:30 CEST. Deliveries are already known, at 486,532 vehicles (Source: Tesla, company announcement, 2 October 2026). What that did to margins, and what the company says about spending and autonomy, is not.
For an options reader, the first question is simpler: how large a reaction does the market price, and how does that compare with Tesla’s own past reactions?
Two ways to read the same history
Tesla has reported eight times since October 2024, each time after the US close. Most of the reactions the next day were modest. Two were not: the shares rose 21.9% after the October 2024 report and fell 14.5% after the July 2026 report (Source: Saxo price data, author calculation). Past performance is not indicative of future results.
Those two reports give the history two summaries. The median move, the one in the middle of the eight, is about 4.5%. The average move is about 7.8%, because the two large reactions pull it up. Both are correct; they answer different questions.
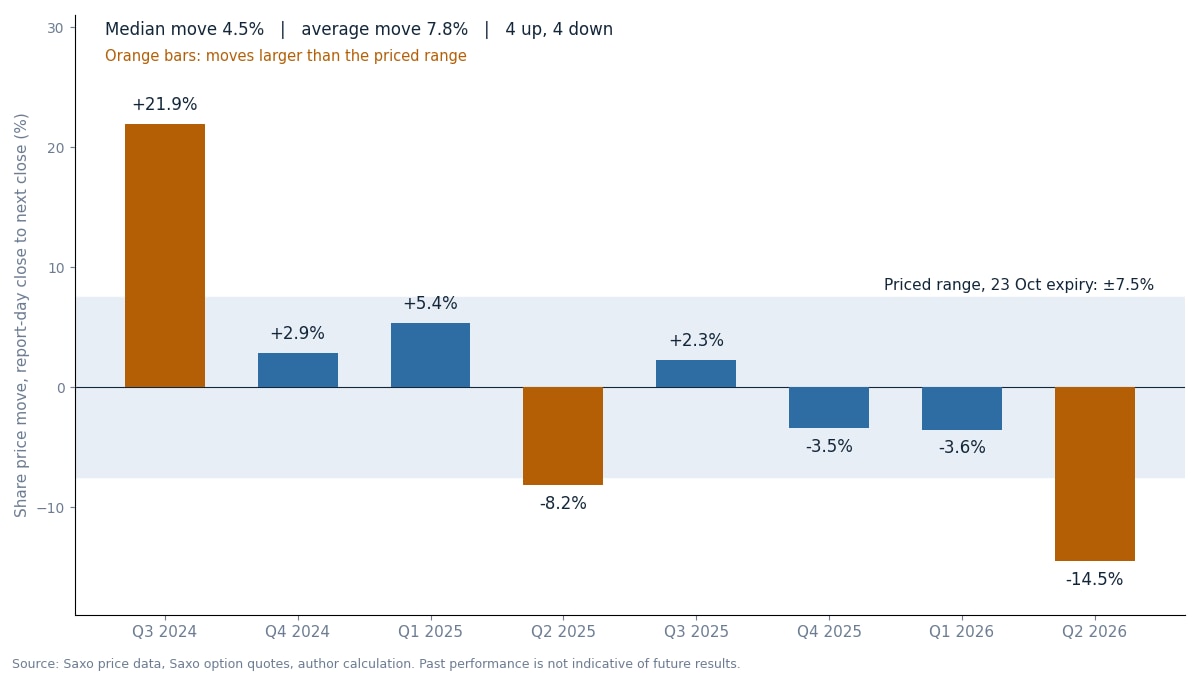 Share price move from the close on report day to the next close, last eight reports, against the range priced by the at-the-money straddle on the 23 October 2026 expiry (indicative Saxo quotes as of the US close on 15 October 2026). Past performance is not indicative of future results; figures are illustrative and not predictive. Source: Saxo price data, Saxo option quotes, author calculation.
What the options market prices
A common way to read the priced move is to add up the at-the-money call and put on the first expiry after the report, here 23 October 2026. With the shares at about 362, the nearest strike is 362.5:
- 362.5 call: about 13.68
- 362.5 put: about 13.35
- Together (the straddle): about 27.02, or 7.5% of the share price
- Priced range: roughly 335 to 390
(Source: Saxo, indicative mid prices as of the US close on 15 October 2026.) The same sum can be checked on any Tesla option chain; prices will have moved since.
So the market prices a move close to Tesla’s average, and well above its median. Part of that price pays for the ordinary trading days before expiry, so the part priced for the report alone is somewhat smaller. In our view, the useful question is therefore which of the two histories a reader trusts more. The two structures below take one side each.
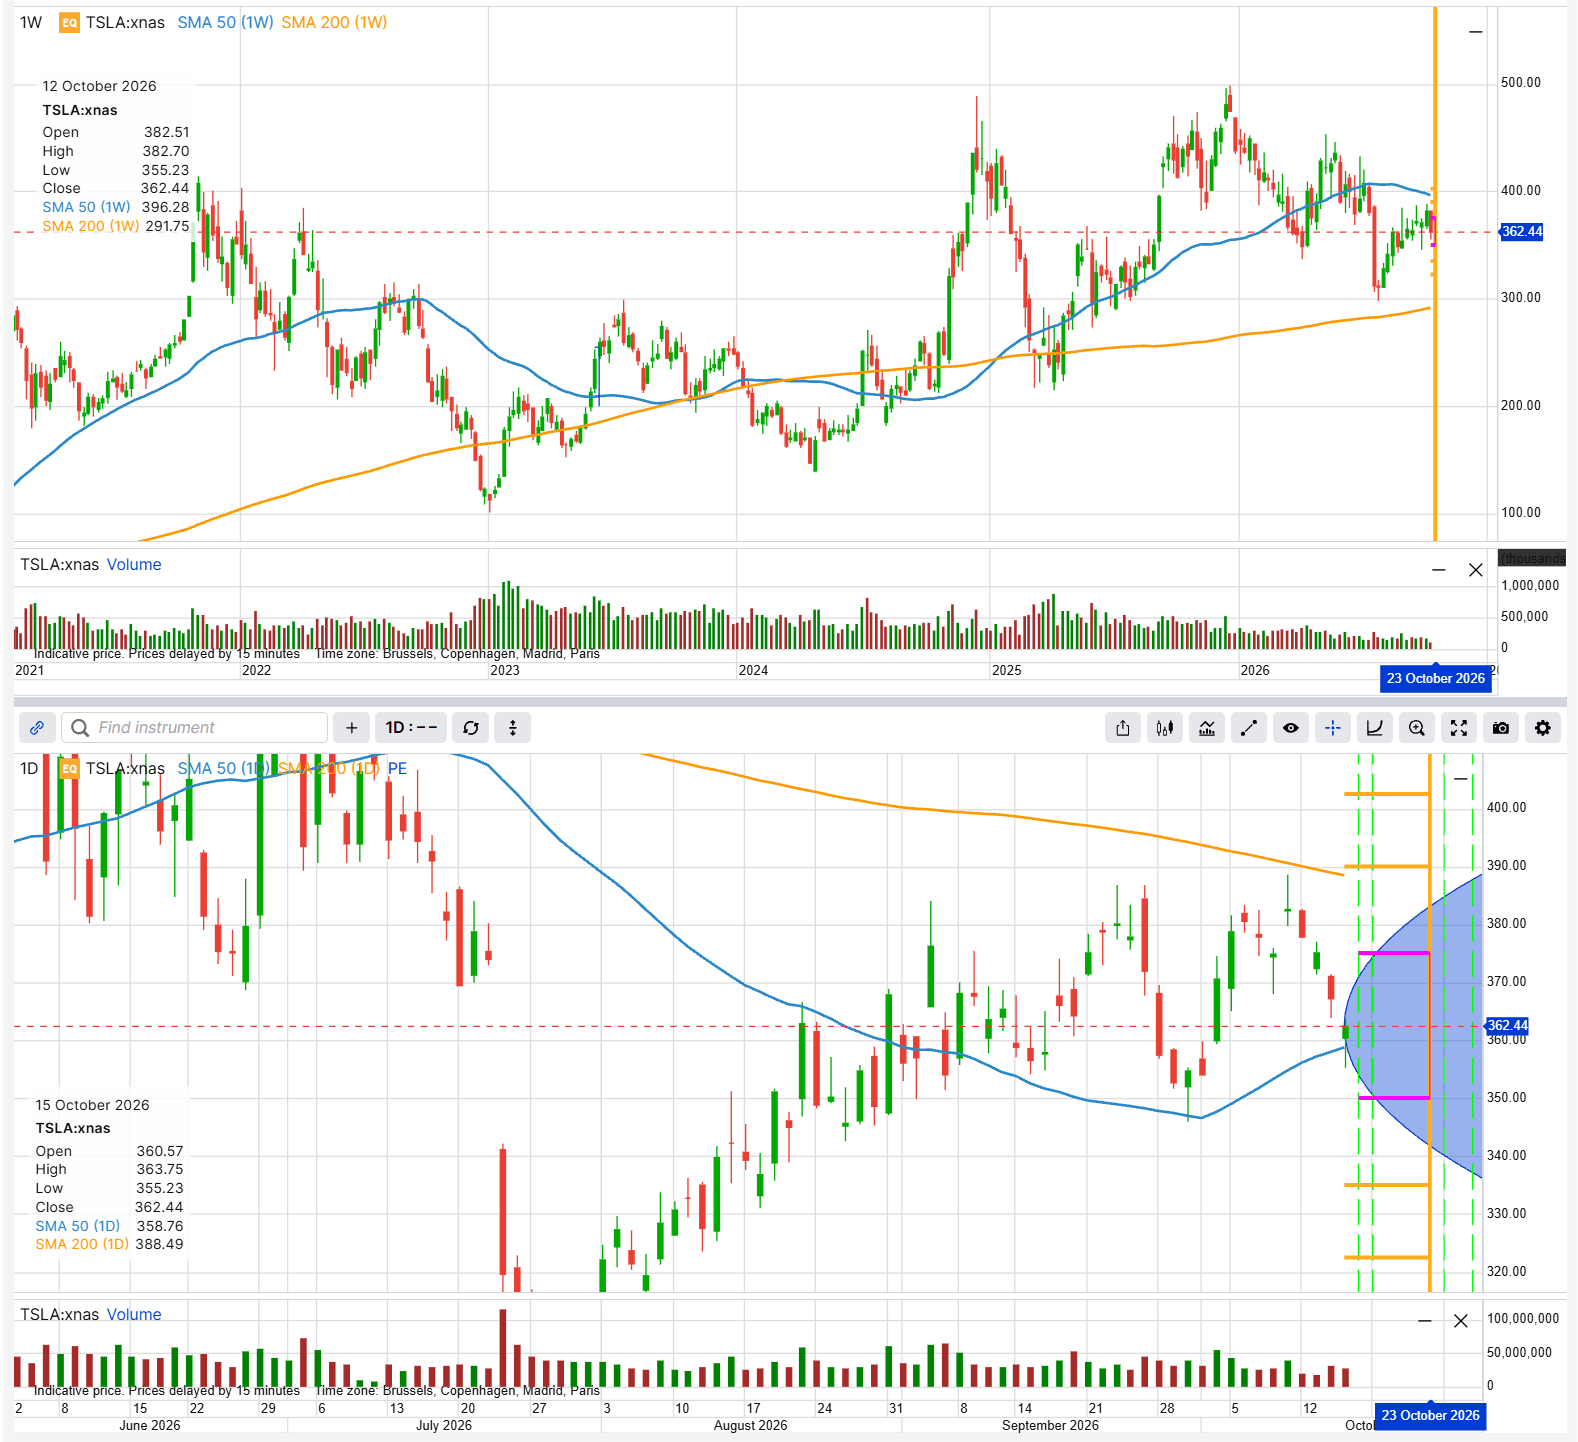 Tesla share price, weekly (top) and daily (bottom), with the 23 October 2026 expiry marked. The horizontal lines mark the strikes used in the two examples below, and the shaded area shows the range implied by option prices. Past performance is not indicative of future results. Source: SaxoTrader.
Important note: The strategies and examples provided in this article are purely for educational purposes. They are intended to assist in shaping your thought process and should not be replicated or implemented without careful consideration. Every investor or trader must conduct their own due diligence and take into account their unique financial situation, risk tolerance, and investment objectives before making any decisions. Remember, investing in the stock market carries risk, and it’s crucial to make informed decisions.
How the strikes and the expiry were chosen
The expiry is 23 October 2026, the first one after the report. The October monthly expiry on 16 October 2026 ends before Tesla reports. Later expiries include more ordinary trading days, so they cost more and react less to the report itself.
The strikes follow two simple rules, both based on the priced range above:
- Iron condor: sell the strikes nearest the edges of the priced range (335 and 390), and buy protection about half the priced move further out (322.5 and 402.5).
- Long strangle: buy strikes about half the priced move away from the share price (350 and 375).
Moving a strike changes the balance: closer short strikes collect more but are breached sooner, and wider strangle strikes cost less but need a larger move.
All examples use indicative Saxo mid prices as of the US close on 15 October 2026 and contracts of 100 shares; actual prices will differ. All figures are hypothetical and for education only. Options carry a high risk of rapid loss and are not suitable for every investor. Costs and charges apply to each leg and vary by account and venue; check the applicable rates before entering any position.
View 1: Tesla reacts like a typical report
Iron condor (illustrative only, not a trade recommendation)
A reader who expects a reaction closer to the median than to the priced move could sell a put spread below the share price and a call spread above it. The risk comes first: if the shares move well beyond the priced range, the loss is capped but is about twice the credit received. If they stay inside the range, the position keeps the credit. While they stay there, it may also gain from the drop in implied volatility that usually follows a report, known as IV crush.
- Sell 1 335 put at 3.55
- Buy 1 322.5 put at 1.655
- Sell 1 390 call at 4.6
- Buy 1 402.5 call at 2.645
- Net credit: about 3.85 per share (1.895 from the puts + 1.955 from the calls), or USD 385 per contract
- Maximum loss: about USD 865; maximum gain: about USD 385 (hypothetical, for education only)
- Break-even at expiry: about 331.15 and 393.85
- Risk: the maximum loss is the wing width minus the net credit; short legs carry early-assignment risk. Costs and charges apply to each leg and vary by account and venue.
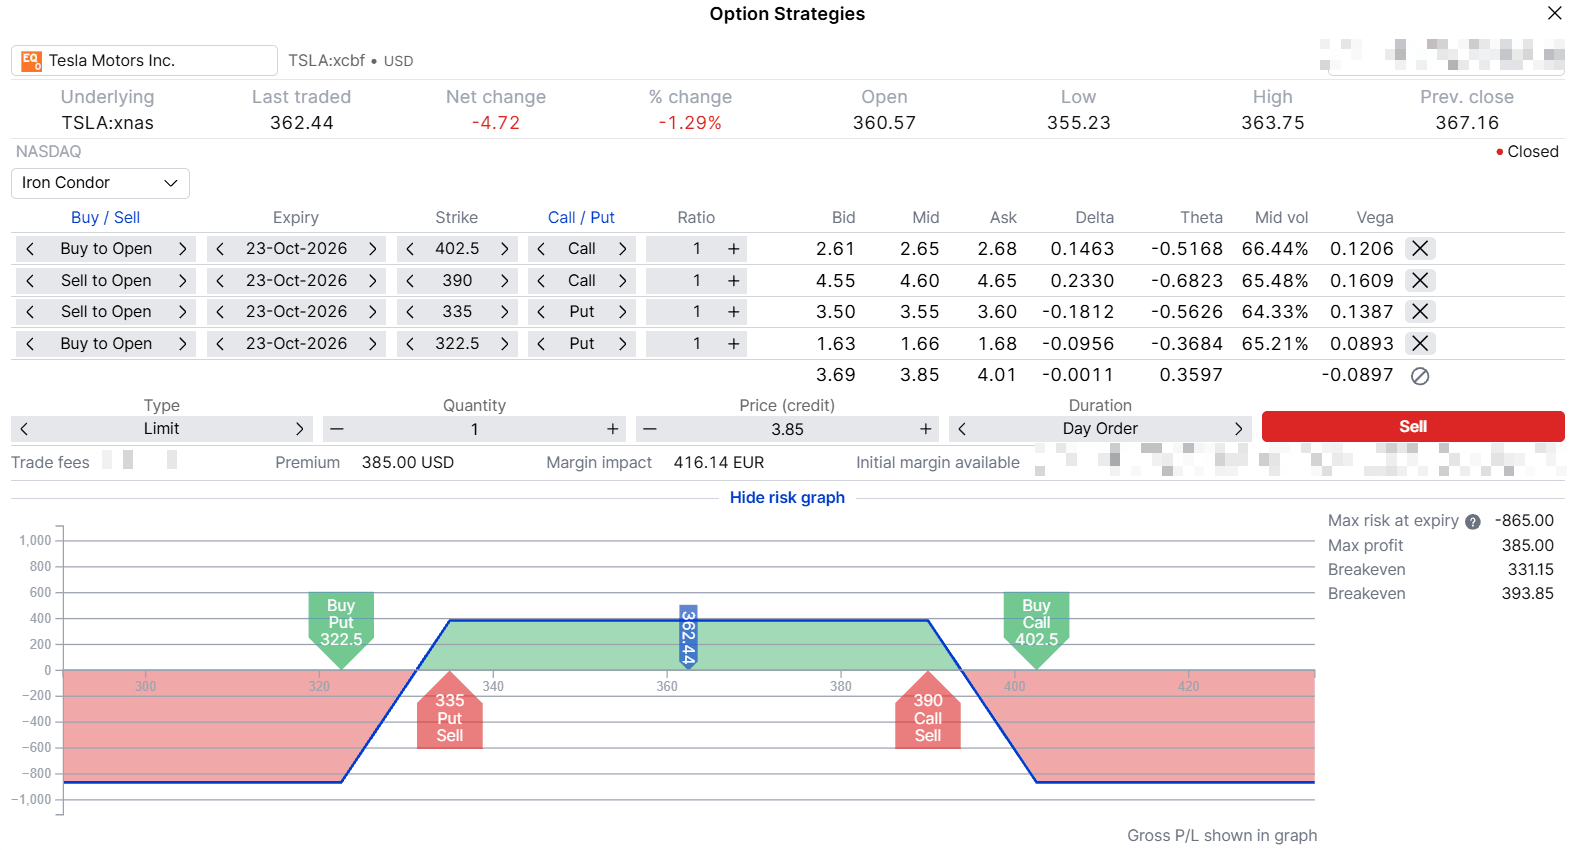 Iron condor 322.5/335 puts and 390/402.5 calls, 23 October 2026 expiry, payoff at expiry. Hypothetical example for education only, indicative prices as of the US close on 15 October 2026. Past performance is not indicative of future results; figures are illustrative and not predictive. Source: SaxoTrader.
View 2: Tesla repeats a large move
Long strangle (illustrative only, not a trade recommendation)
A reader who sees the July 2026 fall or the October 2024 rise as the better guide could buy an out-of-the-money call and an out-of-the-money put. The price paid is also the maximum loss, and it is lost in full if the shares close between the two strikes at expiry. The position gains at expiry only beyond its break-evens, slightly outside the priced range, and IV crush is likely to work against it from the morning after the report. The potential gain is not capped.
- Buy 1 375 call at 8.575
- Buy 1 350 put at 7.8
- Net debit: about 16.375 per share (8.575 for the call + 7.8 for the put), or USD 1,638 per contract
- Maximum loss: about USD 1,638; maximum gain: not capped (hypothetical, for education only)
- Break-even at expiry: about 333.62 and 391.38
- Risk: the maximum loss is the full premium paid. Costs and charges apply to each leg and vary by account and venue.
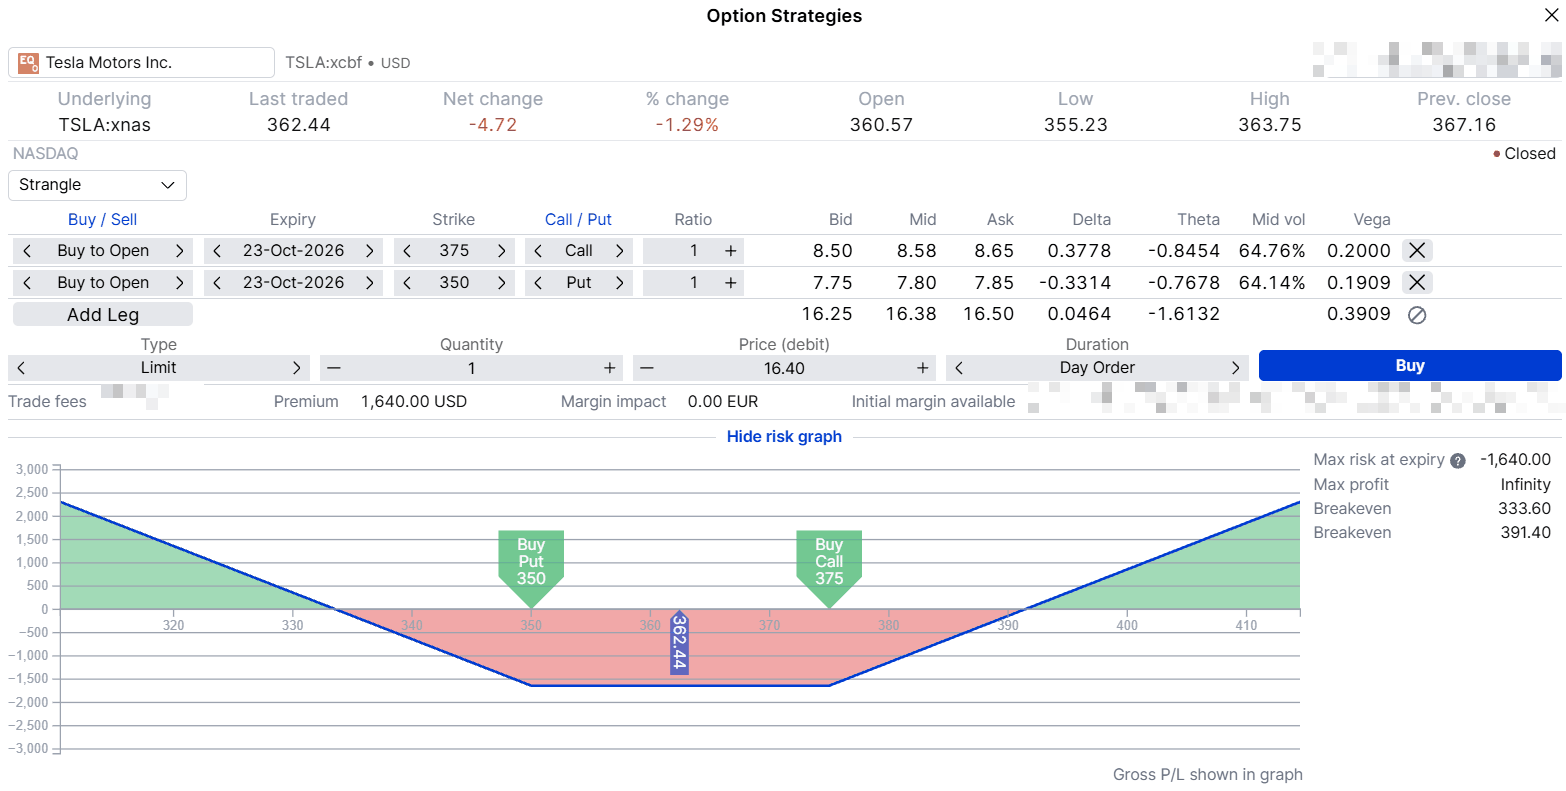 Long strangle 350 put and 375 call, 23 October 2026 expiry, payoff at expiry. Hypothetical example for education only, indicative prices as of the US close on 15 October 2026. Past performance is not indicative of future results; figures are illustrative and not predictive. Source: SaxoTrader.
Same eight reports, two readings
The condor’s break-evens sit about 9% either way, and six of the past eight reactions stayed inside them. The strangle’s sit about 8% either way, and three reactions went beyond them: the two large ones and, only just, the 8.2% fall in July 2025. Past moves came at different prices, and past performance is not indicative of future results, so this says nothing about 21 October 2026. It does show what each structure assumes. The condor loses most on a report like the last one; the strangle loses on a report like most of the others.
Before any position: practical points
- Costs add up with every leg. Commissions apply per leg and each leg crosses its own bid/ask spread. An order holds at most four legs, so both examples fit in one order; larger structures need several orders, each with its own costs.
- Timing. Tesla reports after the close, so the first reaction appears in extended-hours trading and in the opening price on 22 October 2026, before most positions can be adjusted.
- The exit. Closing on 22 October 2026 or holding to expiry is easier to decide before the report than during the move.
- Assignment. Tesla options are American-style; short legs that move into the money can be assigned before expiry.
Final thoughts
Tesla’s earnings history can be read as a stock that usually moves a little, or as one that sometimes moves a lot. The options market prices something close to the second reading. In our view, deciding which reading deserves more weight is a more useful exercise than guessing the direction, which split evenly over the last eight reports.
Both examples carry a maximum loss known before entry, and each loses on the outcome the other is built for. Which, if either, fits depends on the reader’s own view, risk tolerance and the prices available at the time, which will differ from the indicative prices used here. Options carry a high risk of rapid loss and are not suitable for every investor.
The author does not hold positions in any of the instruments mentioned in this article. The Author is permitted to wait at least 24 hours from the time of the publication before they trade the instruments themselves.
| Related articles/content |
|---|
| ASML earnings three ways to read the move options are pricing | 12 Oct 2026 Two banks one morning what options price for Goldman Sachs and Wells Fargo earnings | 9 Oct 2026 Same coin different payoffs an options toolkit for earnings season | 7 Oct 2026 Earnings season is close to a coin flip The edge is in what happens next | 5 Oct 2026 Finding unusually expensive or cheap options in the Saxo screener | 18 Sep 2026 Implied volatility rank what it measures and what it misses | 11 Sep 2026 Nine prints later what Q2 earnings season taught us | 11 Aug 2026 What IV crush really means in practice reviewed version | 9 April 2026 Trading earnings with defined | 31 Mar 2026 |
| More from the author |
|---|