
Access all our platforms from a single account.

Earnings season is close to a coin flip. The edge is in what happens next.

Summary: The direction of an earnings reaction is close to a coin flip. What separates traders is the payoff shape they build around it, and a sample large enough to learn from.
The direction of an earnings move is close to 50/50. What separates winning traders from losing ones is rarely the call they made on direction. It is the shape of the payoff they built around it.
Q3 2026 earnings season opens on 8 October 2026 with PepsiCo, followed by Delta Air Lines on 9 October and the big banks on 13 and 14 October. JPMorgan Chase and Citigroup report on 13 October, and Bank of America and Morgan Stanley on 14 October (Source: company announcements: PepsiCo, Delta, JPMorganChase, Citi, Bank of America, Morgan Stanley, as of 5 October 2026). Wells Fargo and Goldman Sachs are also listed for 13 October on earnings calendars, but the dates were not yet confirmed on their own investor relations pages at the time of writing. The largest technology names typically report in the final week of the month, and their dates were not yet confirmed either.
For traders who build positions around these reports, there is a number worth sitting with before the first bank opens its books: the directional outcome of an individual earnings trade is, in our view, close to a coin flip. That is the starting assumption that makes the rest of this article useful every season, not just this one. Options carry a high risk of rapid loss and are not suitable for every investor.
Why the direction is close to even odds
Before a company reports, the options market puts a price on how far it expects the stock to move. One simple way to see that number is to add up what the at-the-money call and the at-the-money put cost for the expiry that covers the event. That combined price is roughly what the market is charging for movement, and it can be read as a percentage of the stock price, the expected move.
In our view that number may be more informative than a single analyst’s guess. It comes from real buyers and sellers putting money behind it on both sides, right before the outcome is known. If the expected move looked clearly too high or too low compared with how that stock has moved after past reports, well-funded traders would tend to push the price back toward fair value. Past performance is not indicative of future results, so a stock’s earlier reactions are a reference point, not a forecast.
What the expected move does not show is which way the stock goes. A company can beat its numbers and the stock can still drop, simply because the beat was smaller than what everyone was already expecting. The market is grading the quarter against the bar that was already set. That gap between result and expectation is why direction stays close to a coin flip, even for traders who do careful homework on the fundamentals.
Losing half the time is not the problem
If direction really is close to 50/50, then roughly half of directional earnings trades lose. On the surface that sounds damning. It need not be, as long as the money made on winners is not the same size as the money lost on losers. Options carry a high risk of rapid loss, and every figure below is hypothetical.
The following example is hypothetical and for educational use only; it is not a specific trade, an account result, advice or a trade recommendation. Imagine two traders, each risking $100 on every earnings trade.
Trader A is right 65% of the time, but every win only returns $40 while every loss costs the full $100. Over 100 trades: 65 wins at $40 is $2,600, minus 35 losses at $100 is $3,500. Trader A is down $900 (hypothetical, for education only), despite winning most of the time.
Trader B is right only 35% of the time, but every win returns $300 while every loss still costs $100. Over 100 trades: 35 wins at $300 is $10,500, minus 65 losses at $100 is $6,500. Trader B is up $4,000 (hypothetical, for education only), despite being wrong twice as often as right. The same payoff shape could just as easily have produced a loss: a run of bad luck, or fewer winners than assumed, would have wiped it out.
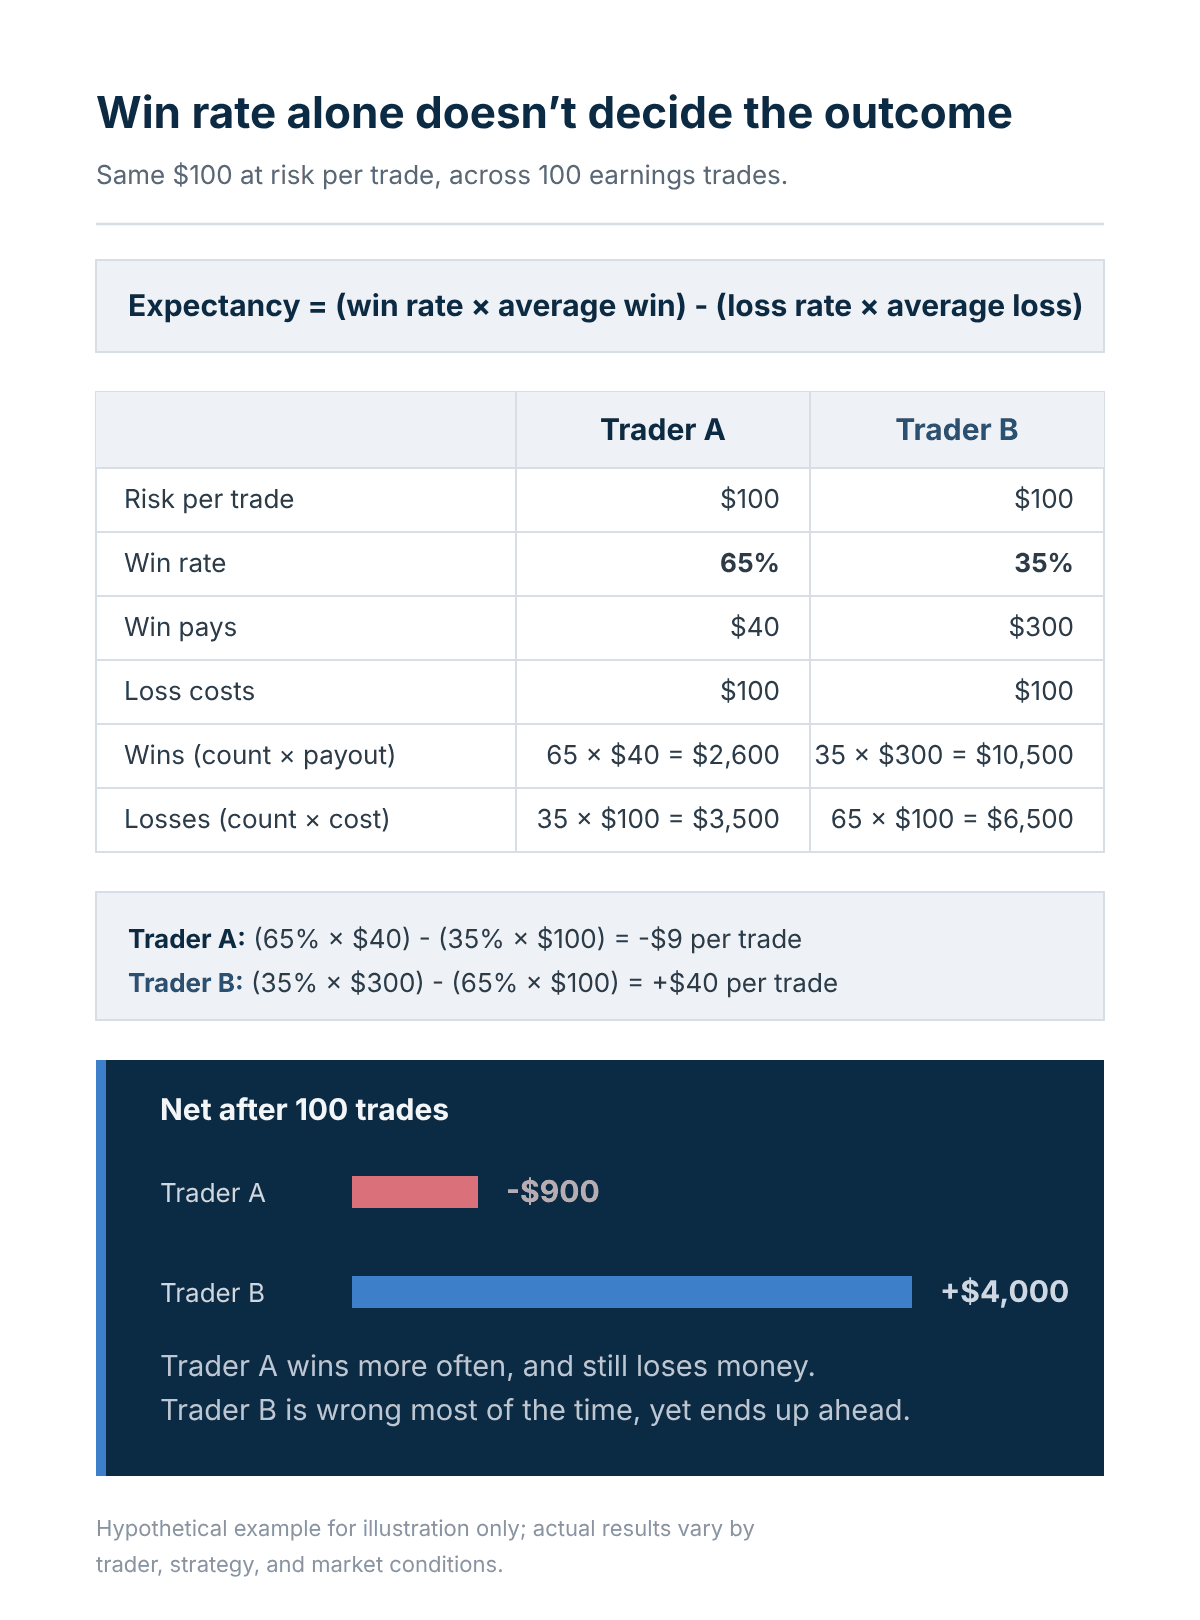 Trader A and Trader B compared over 100 hypothetical earnings trades, same $100 risked per trade. Hypothetical example for illustration only; actual results vary by trader, strategy and market conditions. This chart is illustrative and for educational purposes only; it is not predictive. Past performance is not indicative of future results; figures are illustrative and not predictive. Source: author calculation.
Win rate, the number many newer traders focus on, barely matters on its own. What decides the outcome is win rate combined with how much a win pays relative to how much a loss costs.
The catch: the market already prices that trade-off
It would be convenient to simply decide to make winners pay out more. Win rate and payoff size pull against each other, and in our view the options market appears to price that trade-off fairly efficiently. Buying a straddle gives a payoff that is open-ended on a big move, but the stock then needs to travel further than the priced-in move just to break even, which tends to drag the win rate below 50%, and the maximum loss is the entire premium paid. Selling premium instead tends to win more often with small gains, in exchange for an occasional larger loss that can far exceed the premium received. Neither end of that spectrum is a free lunch, and picking a structure, by itself, may not create an edge. Costs and charges apply to each leg; see Saxo pricing for full details.
If price, structure and odds are all roughly fair, where could an edge realistically come from? A handful of places, each one reusable no matter which names report in a given quarter:
- The price of the move. Is the priced-in move rich or cheap compared with how this stock has actually moved after its own past reports?
- The shape of the outcome. A structure built for an average move can be the wrong tool when the result lands far from average.
- The size of the worst case. Capping risk by design, rather than hoping it stays small, means the maths are known before the trade is placed.
- The exit. Implied volatility usually falls once the number is out, and a winning position left unmanaged can hand gains back through that decline.
- The willingness to skip a name. Not every report is mispriced, and passing on the ones that are not is a deliberate decision, not a lack of conviction.
Options carry a high risk of rapid loss and are not suitable for every investor.
Because any single trade is still close to a coin flip, the group of trades a trader builds matters more than any one name inside it. Take a hypothetical trader with a 40% hit rate and a 2-to-1 payoff, a profile loosely comparable to Trader B’s. Even that trader has roughly a 38% chance of ending a run of just ten trades in the red, purely from bad luck (illustrative binomial calculation that assumes independent trades; not a forecast for any specific trader or season). That chance falls steadily as the number of trades grows toward several dozen across a full year, which is why judging results season by season, rather than year by year, can be misleading. Future outcomes are uncertain and may result in losses.
Important note: The strategies and examples provided in this article are purely for educational purposes. They are intended to assist in shaping your thought process and should not be replicated or implemented without careful consideration. Every investor or trader must conduct their own due diligence and take into account their unique financial situation, risk tolerance, and investment objectives before making any decisions. Remember, investing in the stock market carries risk, and it’s crucial to make informed decisions.
Building a sample instead of a bet
A single earnings trade cannot prove an edge exists. It can only confirm or deny it on that one occasion, and even then, not reliably. Building one position around one name this season carries roughly the same uncertainty as flipping a coin and calling it a strategy.
A more durable approach starts earlier, before the season opens, by building a list of candidates rather than reacting to whichever name happens to be in the headlines once reports begin. One way is to narrow the full list of companies reporting in a given window down to the ones with liquid weekly options, meaning a tight bid/ask spread and real open interest at the strikes that would actually be used, because an illiquid name can erase a theoretical edge through trading costs alone before the earnings result even matters. From that shorter list, the candidates can be ranked by comparing today’s priced-in move against how much each stock has actually moved after its own past reports. That ranking is a basis for choosing trades that has nothing to do with guessing direction.
A working range for many traders sits around ten to fifteen positions per season: enough trades to start smoothing out the luck of any one of them, but not so many that quality is sacrificed to fill a quota. Ten positions crammed into the same narrow week, all leaning on the same kind of volatility bet, behave more like one large trade than ten independent ones. Spreading candidates across sectors and across the calendar, rather than loading them all into the first wave of bank earnings, keeps the trades closer to genuinely independent. Sizing each position small enough that losing on all of them would not seriously damage the account respects the fact that, even with a real edge, a bad run of luck is a realistic outcome, not a remote one. Options carry a high risk of rapid loss and are not suitable for every investor.
Putting this to work this season
With the first reports landing on 8 October 2026 and the banks following on 13 and 14 October, there is a narrow window to set this up before the pace picks up. A practical sequence a trader might follow, this season and every season after it:
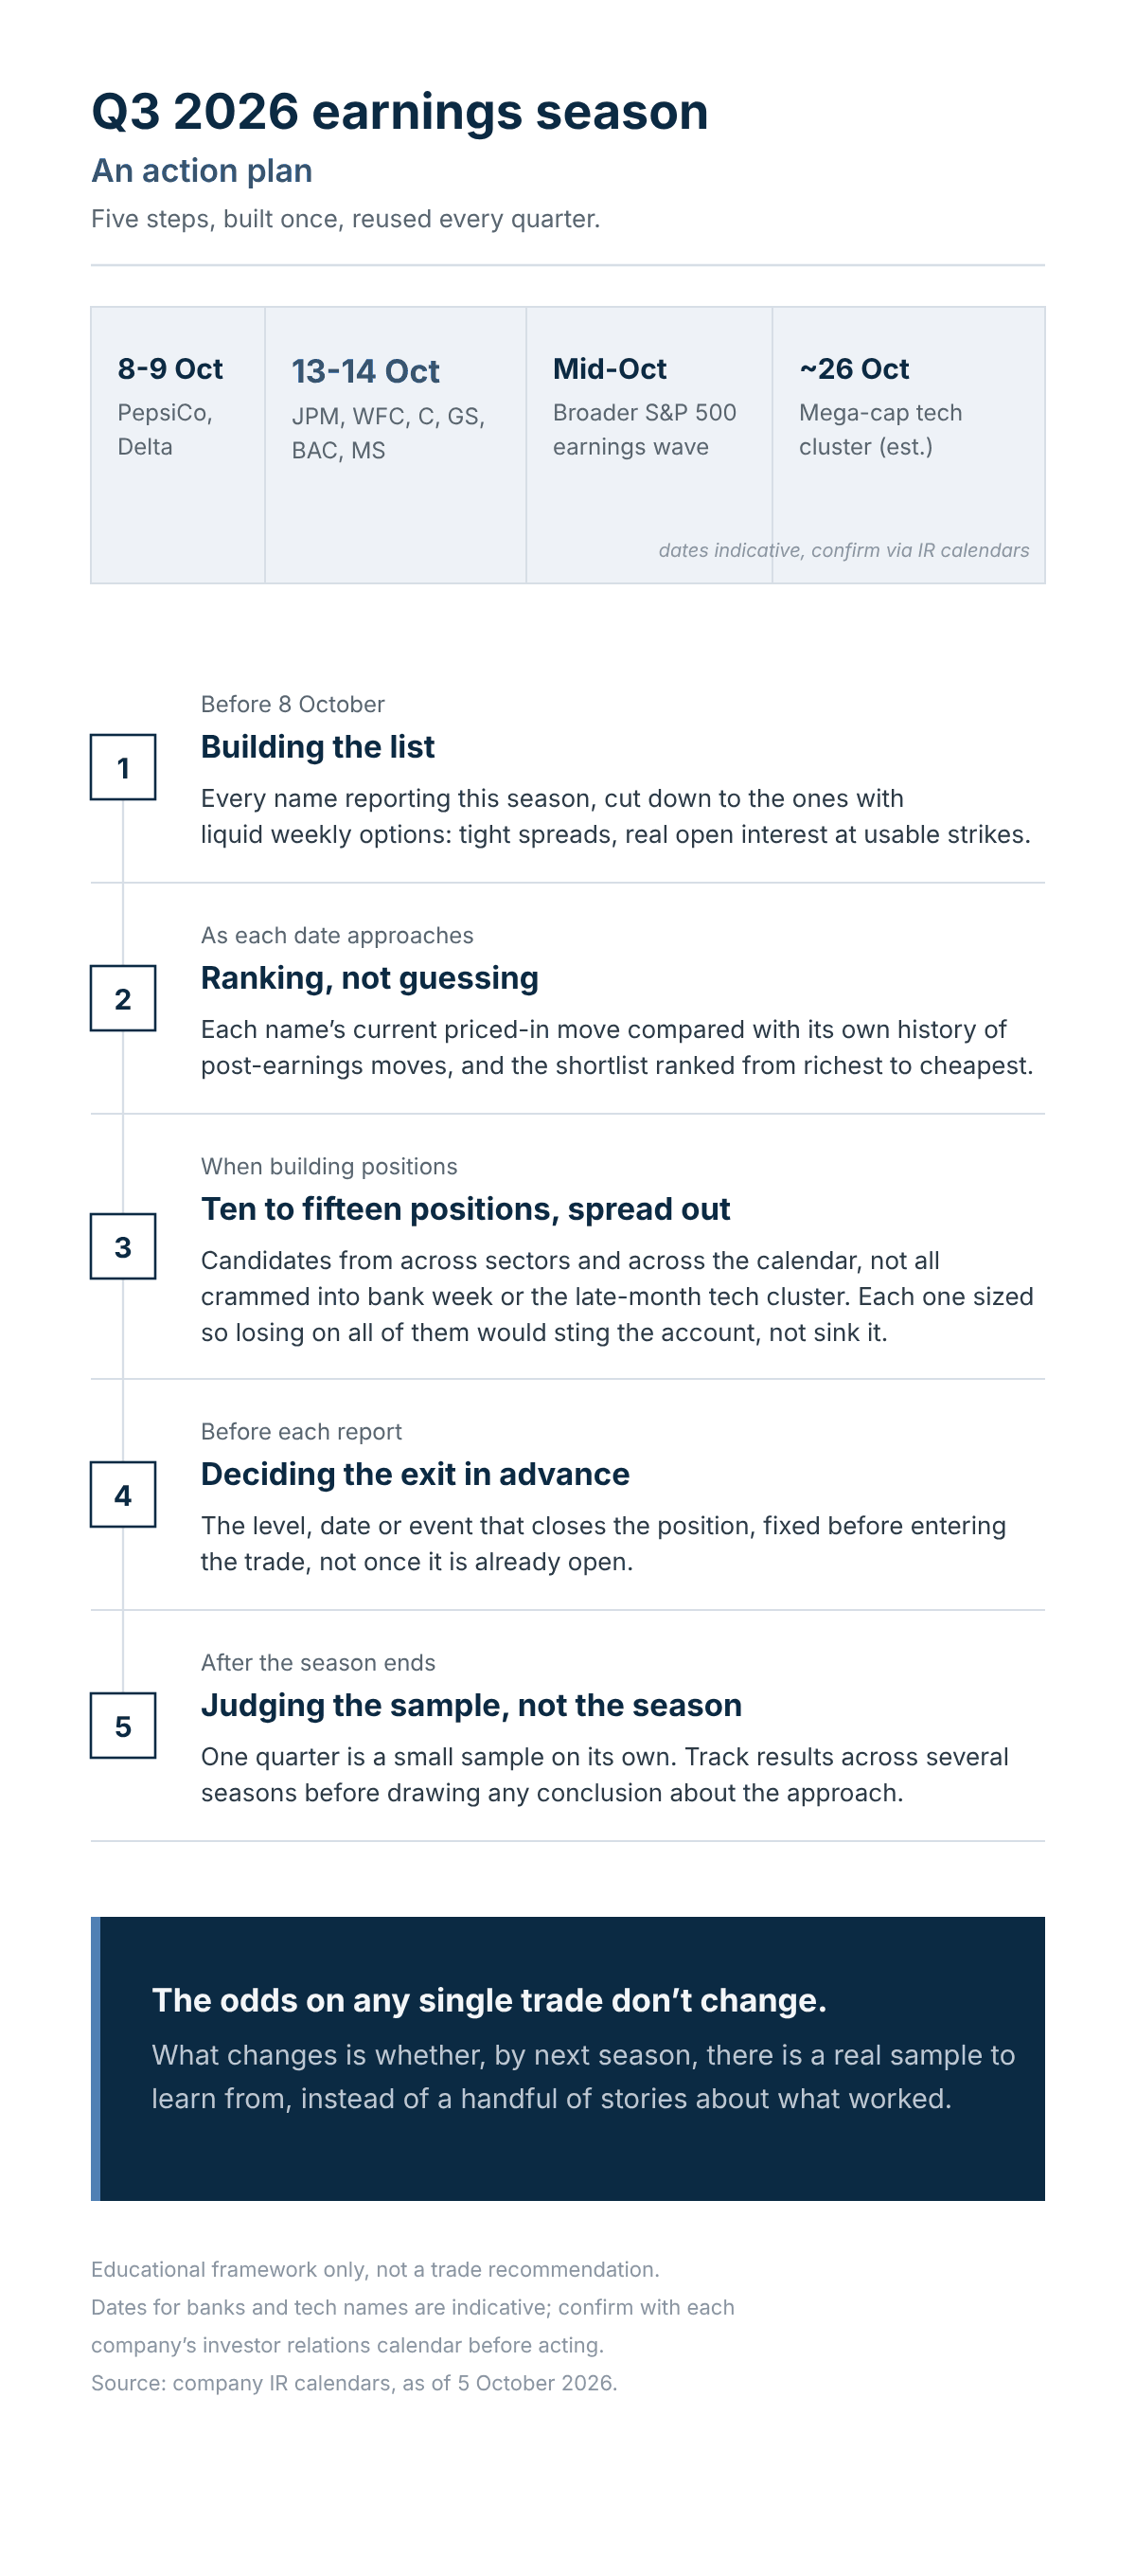 Five-step framework for Q3 2026 earnings season, with the season’s key report dates. Dates are indicative; confirm with each company’s investor relations calendar. Educational framework only, not a trade recommendation. This chart is illustrative and for educational purposes only; it is not predictive. Source: company announcements, as of 5 October 2026.
- Before 8 October: pull the full list of names reporting between now and late October, and cut it down to those with liquid weekly options.
- As each name approaches its report date: compare its current priced-in move against its own history of post-earnings moves, and rank the shortlist from most to least attractive.
- When building positions: take candidates from across sectors and across the calendar rather than clustering them in the bank-earnings week or the late-October technology cluster, and size each one so that losing on all of them would hurt, not sink, the account.
- Before each report: decide the exit in advance, meaning the level, the date or the event that closes the position, rather than deciding in the moment.
- After the season ends: judge the results as one data point in a multi-season sample, not as a verdict on the approach.
The odds on any single trade stay exactly where they started. What changes, by the time next earnings season arrives, is whether there is a real sample to learn from instead of a handful of stories about the trades that worked. Options carry a high risk of rapid loss and are not suitable for every investor.
The author does not hold positions in any of the instruments mentioned in this article. The Author is permitted to wait at least 24 hours from the time of the publication before they trade the instruments themselves.
| Related articles/content |
|---|
| Oracle three option strategies for three market views | 2 Oct 2026 Finding unusually expensive or cheap options in the Saxo screener | 18 Sep 2026 Implied volatility rank what it measures and what it misses | 11 Sep 2026 Nine prints later what Q2 earnings season taught us | 11 Aug 2026 What IV crush really means in practice reviewed version | 9 April 2026 Trading earnings with defined | 31 Mar 2026 The front end emptied the back end held - Options Brief - 5 October 2026 |
| More from the author |
|---|