
Access all our platforms from a single account.

Twenty-one names where option premium moved away from its own normal

Summary: A nightly screen of 512 option underlyings ranked every implied volatility reading against its own past year. Twenty-one names sat well away from their own normal at Friday’s close, and the two ranking columns disagreed about four of them.
A reading near the top of a name’s own range says nothing about whether the move it is pricing will arrive.
An implied volatility figure on its own says little about whether an option is dear. A biotech quoting 60 percent may be cheap against its own record, while a utility quoting 20 percent sits at the top of everything it has printed in a year. The only way to judge a level is against the instrument’s own history, which is what IV rank and IV percentile each attempt in a different way.
The nightly screen covering 185 US and 327 euro zone optionable names produced its latest reading at the close of Friday 2 October 2026, recorded in the run of 3 October 2026. Three clusters stood out: US health care heading into late October reporting dates, euro zone names whose rank had climbed for two straight weeks, and a precious metals and digital assets complex sitting near the bottom of its own range despite high absolute volatility. (Source: Saxo OpenAPI, close of 2 October 2026, recorded 3 October 2026. Past performance is not indicative of future results; figures are illustrative and not predictive.)
Important note: The strategies and examples provided in this article are purely for educational purposes. They are intended to assist in shaping your thought process and should not be replicated or implemented without careful consideration. Every investor or trader must conduct their own due diligence and take into account their unique financial situation, risk tolerance, and investment objectives before making any decisions. Remember, investing in the stock market carries risk, and it’s crucial to make informed decisions.
Reading the two columns together
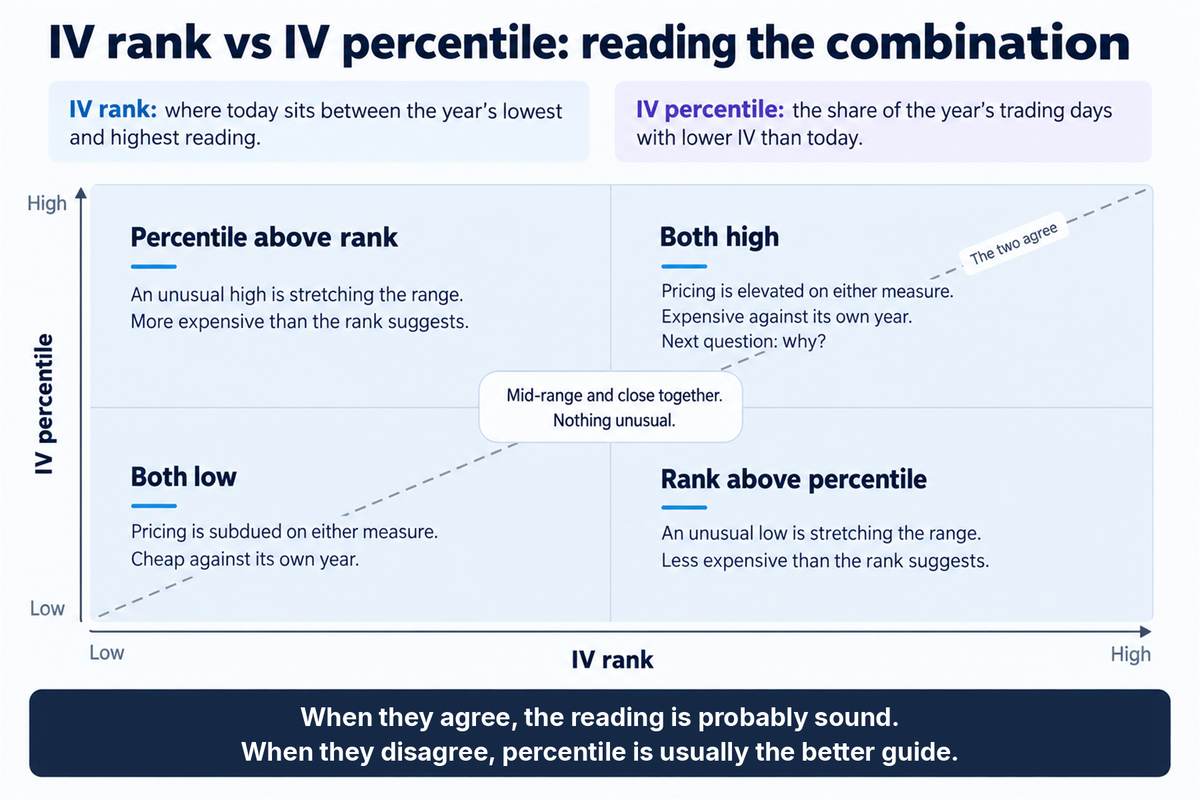
IV rank places the current reading between the highest and lowest implied volatility the underlying has shown over the past year, on a zero to one hundred scale. IV percentile answers a different question: what share of that year’s sessions closed below the current level. Rank 95 with percentile 45 says the level is near the top of a wide range most sessions sat only a little below; the reverse, low rank with high percentile, usually means a compressed range punctuated by one spike.
Neither column is a signal. Rich optionality can grow richer and cheap optionality can stay cheap for months, and options carry a high risk of rapid loss and are not suitable for every investor. Every reading below comes from the same 2 October snapshot, reporting dates are from company announcements, and tickers are Saxo instrument symbols resolved through reference data rather than the option root, which frequently differs from the listed symbol.
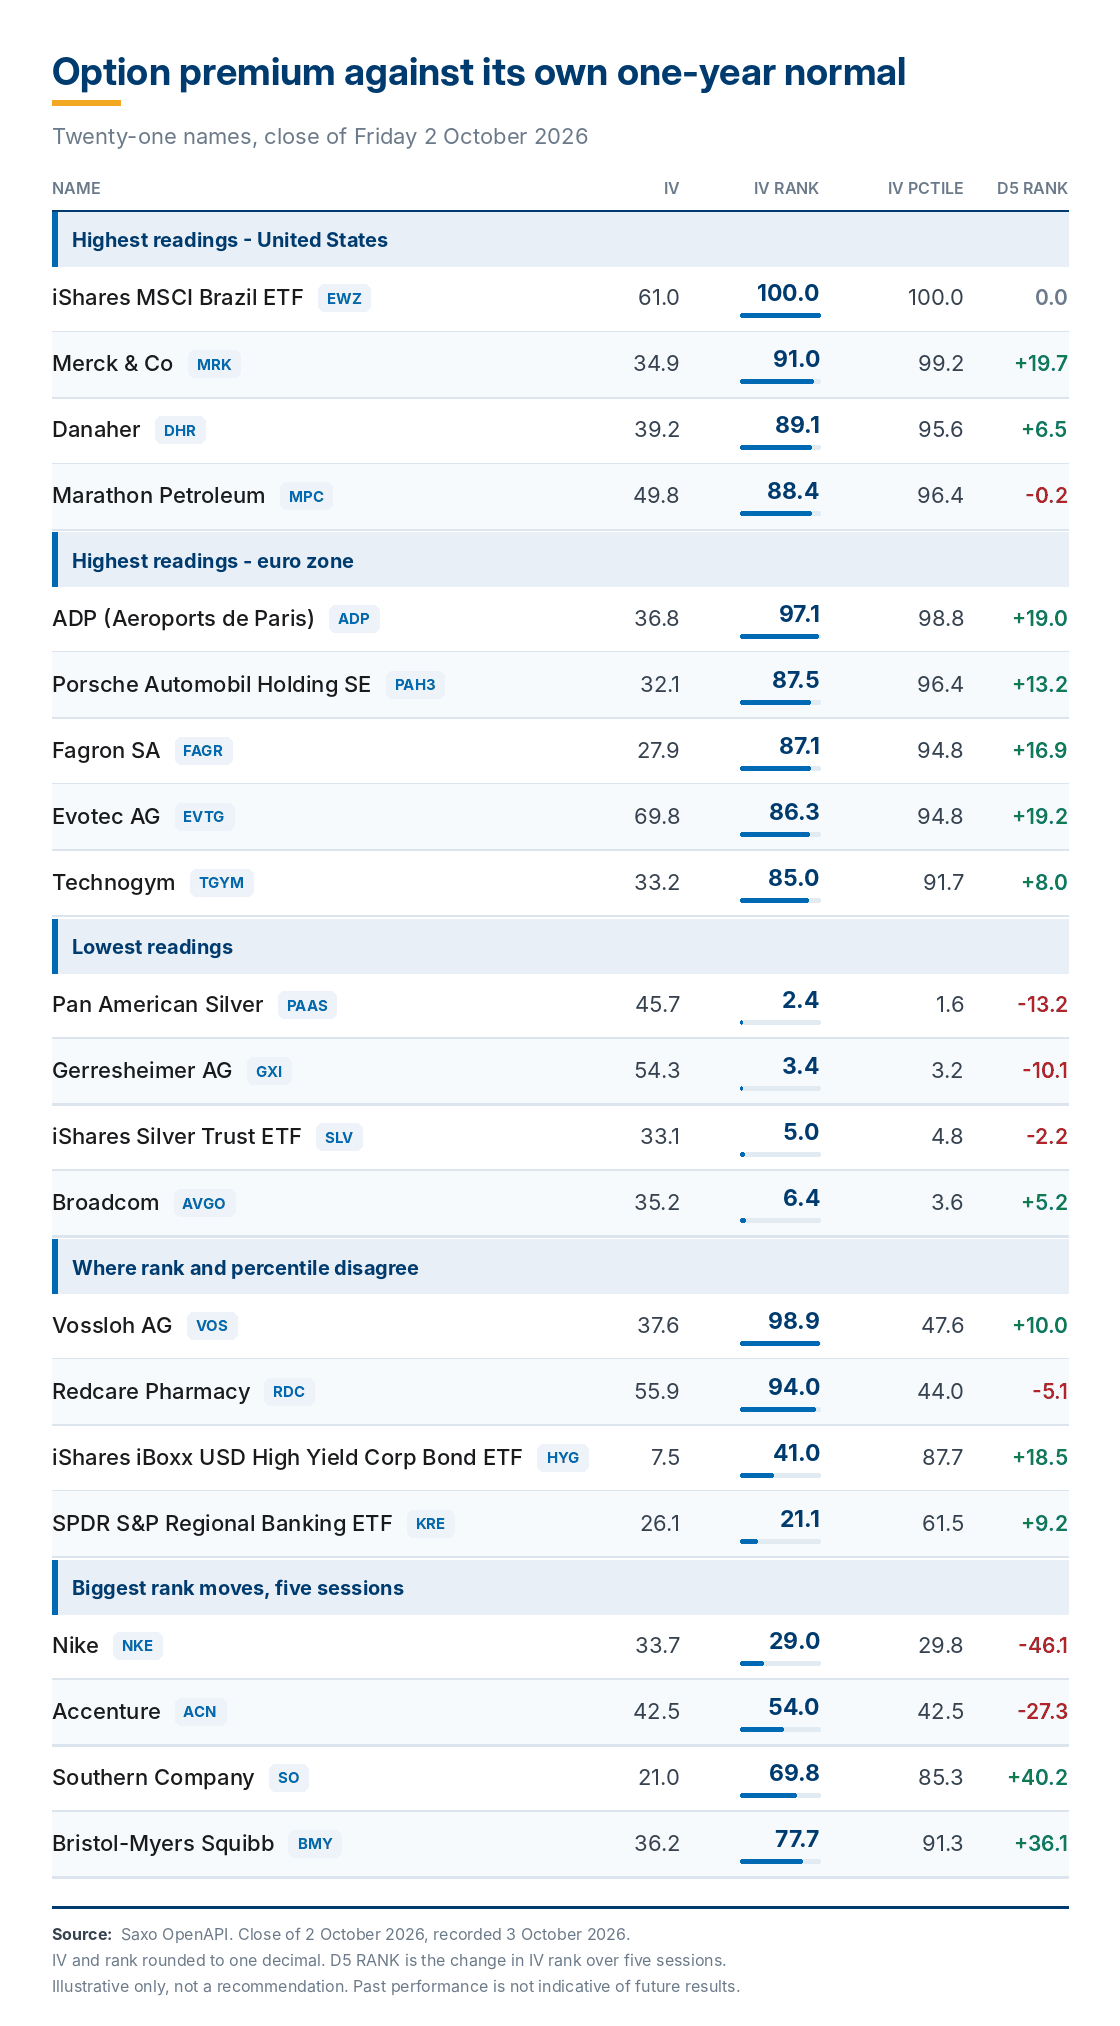 IV, IV rank, IV percentile and five-session rank change for the twenty-one names, close of 2 October 2026. Source: Saxo OpenAPI
Past performance is not indicative of future results; figures are illustrative and not predictive.
Highest readings, United States
In our view these four may reflect event premium rather than a changed volatility regime; options carry a high risk of rapid loss and are not suitable for every investor.
- iShares MSCI Brazil ETF (EWZ) - IV 61.0, rank 100, percentile 100. The reading has held at the top of its range for two weeks while implied volatility climbed from roughly 42, which appears to reflect a first round presidential vote on 4 October 2026 and the possibility of a 25 October run-off. See Saxo pricing for ETF costs and applicable charges.
- Merck & Co (MRK) - IV 34.9, rank 91.0, percentile 99.2. Rank rose about 20 points over five sessions ahead of a third quarter call scheduled for 29 October 2026.
- Danaher (DHR) - IV 39.2, rank 89.1, percentile 95.6. The highest reading of the three large life sciences names, with a third quarter call scheduled for 21 October 2026.
- Marathon Petroleum (MPC) - IV 49.8, rank 88.4, percentile 96.4. Rank was flat over five sessions, so the elevation looks established rather than fresh, with third quarter results scheduled for 3 November 2026.
Thermo Fisher Scientific, Intuitive Surgical and Bristol-Myers Squibb also screened above rank 77, making health care the richest US sector on the median measure alongside rates and credit.
Highest readings, euro zone
Euro zone names enter this group only with at least seven listed expiries and a reading already elevated two sessions earlier; three below carry six expiries and are marked. In our view the levels may point to event risk being priced; again, options carry a high risk of rapid loss and are not suitable for every investor.
- ADP (Aeroports de Paris), Paris listing (ADP) - IV 36.8, rank 97.1, percentile 98.8. Rank climbed from the high fifties across the fortnight. Six listed expiries, so a thinner book. Not the identically ticketed US payroll company on Nasdaq.
- Porsche Automobil Holding SE (PAH3) - IV 32.1, rank 87.5, percentile 96.4. A near doubling of rank over three weeks from the low forties, on eight expiries.
- Fagron SA, Brussels listing (FAGR) - IV 27.9, rank 87.1, percentile 94.8. Rank moved up about 17 points in five sessions. Six listed expiries.
- Evotec AG (EVTG) - IV 69.8, rank 86.3, percentile 94.8. The highest absolute implied volatility in the euro zone top ten, and the reading was still rising at the snapshot.
- Technogym (TGYM) - IV 33.2, rank 85.0, percentile 91.7. The steadiest of the group, holding in the high seventies to mid eighties all fortnight. Six listed expiries.
Air Liquide screened at rank 100 but was excluded: a December front expiry while the rest of the euro zone book sat on the October cycle, five expiries, and a contract adjusted for a bonus issue, so not a like for like comparison. MFE-MediaForEurope was excluded for six expiries and barely a week of history behind its rank.
Lowest readings
Three of these four carry high absolute implied volatility, which is the point: cheap against its own history is not the same as quiet. Options carry a high risk of rapid loss and are not suitable for every investor.
- Pan American Silver (PAAS) - IV 45.7, rank 2.4, percentile 1.6. The lowest US rank in the screen, and rank fell a further 13 points over five sessions.
- Gerresheimer AG (GXI) - IV 54.3, rank 3.4, percentile 3.2. The lowest euro zone rank, with implied volatility still above 50 in absolute terms.
- iShares Silver Trust ETF (SLV) - IV 33.1, rank 5.0, percentile 4.8. Sits with the silver miners at the bottom of the range. See Saxo pricing for ETF costs and applicable charges.
- Broadcom (AVGO) - IV 35.2, rank 6.4, percentile 3.6. The only large cap technology name this far down, and the reading was drifting up slightly.
The digital assets cluster was the broadest low reading: fourteen names, median rank 8.7, twelve below rank 20, despite absolute implied volatility above 70 on several.
Where the two columns disagree
These four are the clearest divergences, and where a single-column view would mislead. In our view each may argue for checking the longer window before treating a reading as extreme; options carry a high risk of rapid loss and are not suitable for every investor.
- Vossloh AG (VOS) - IV 37.6, rank 98.9, percentile 47.6. Near the very top of its one-year range, yet barely half the year’s sessions closed below the current level, which appears to reflect a wide range rather than an unusual reading.
- Redcare Pharmacy (RDC) - IV 55.9, rank 94.0, percentile 44.0. The same shape, and the widest absolute volatility range of the euro zone divergence names.
- iShares iBoxx USD High Yield Corporate Bond ETF (HYG) - IV 7.5, rank 41.0, percentile 87.7. The inverse case: a mid-range reading that still sits above roughly 88 percent of the year’s closes, which may point to a compressed range with occasional spikes. See Saxo pricing for ETF costs and applicable charges.
- SPDR S&P Regional Banking ETF (KRE) - IV 26.1, rank 21.1, percentile 61.5. A low rank against a clearly higher percentile, the same compressed-range shape. See Saxo pricing for ETF costs and applicable charges.
Biggest rank moves over five sessions
Thirteen days of stored history now support a five-session comparison. Two of these moves have an identifiable cause and two do not; options carry a high risk of rapid loss and are not suitable for every investor.
- Nike (NKE) - rank 29.0, down 46.1 over five sessions. Implied volatility fell from roughly 50 to 34 between the Thursday and Friday closes, the pattern a chain typically shows once an event has passed. Nike reported first quarter fiscal 2027 results after the close on 1 October 2026.
- Accenture (ACN) - rank 54.0, down 27.3. A comparable decline a session earlier, consistent with results Accenture released before the open on 1 October 2026.
- Southern Company (SO) - rank 69.8, up 40.2. The largest rise in the screen, and with third quarter results not scheduled until 5 November 2026 there is no imminent report that appears to explain it.
- Bristol-Myers Squibb (BMY) - rank 77.7, up 36.1. Rank more than doubled over thirteen sessions, again well ahead of a 29 October 2026 reporting date.
What the screen does not show
Three limitations matter before any reading here is used. The figures come from one close, and a chain can reprice overnight. Several names quote a front expiry only days away, where implied volatility is noisiest and least comparable with a name quoting a month out. And a rank built on one year of history is sensitive to what that year contained: one spike twelve months ago compresses every reading since. Separately, sixteen euro zone names returned no usable volatility block and are absent from the screen rather than scoring low, which is a data gap and not a reading.
Final thoughts
The two columns earn their place by disagreeing. Vossloh and Redcare both sat within a few points of the top of their one-year ranges while fewer than half the year’s sessions closed below where they were, and a trader reading only rank would have treated both as extreme. Nike and Accenture show the opposite: falls of 46 and 27 points, each coinciding with a reporting date that had just passed rather than with any change in the underlying business. What the screen cannot do is say what to do about it. A reading near the top of a range describes pricing, not movement, and the two largest rank increases have no scheduled catalyst within three weeks.
The author holds positions in the iShares MSCI Brazil ETF (EWZ), one of the instruments named in this article, and no position in any of the others mentioned.
| More from the author |
|---|