
Access all our platforms from a single account.

The average stock led, correlation got bid - Options Brief - 2 October 2026

Summary: On Wednesday the average stock fell three times as much as the index. On Thursday it did the lifting instead, and the option market has quietly started charging more for things to move together.
On Wednesday the average stock fell three times as much as the index. Thursday ran the other way.
MARKET REGIME: TRANSITIONING | VIX 16.39 | TERM STRUCTURE: CONTANGO | SKEW: ELEVATED (142.77) | FRONT-MONTH VIX FUTURES: 18.00
Key findings
- Breadth did the lifting. The equal-weight S&P 500 fund rose 0.47% against the cap-weighted fund’s 0.18%, with four of the seven largest names lower.
- The option market leaned the same way. Implied correlation rose 5.10% to 11.74, above 55 of our 60 stored sessions, while dispersion eased to 35.57.
- Rate volatility is still the only extreme on the board. MOVE sits at 108.14, higher than 59 of those 60 readings, even after easing.
European sovereign debt moved to the top of the agenda. After a 2027 budget reached the French National Assembly, the German-French ten-year spread widened 14 basis points to 141, a fresh fourteen-year high, with France near 4.92% and the Bund down toward 3.51% on the first real safe-haven bid of this cycle. Short-dated European yields collapsed as expectations for further European Central Bank tightening were pared, and the euro fell to its lowest since early 2025.
Crude supplied the second shock. Brent settled 4.4% higher at 102.31 after a report that the United States is deploying a third carrier group and 10,000 more troops to the Middle East.
US yields reversed. The ten-year tested a cycle high of 5.34% before closing about four basis points lower near 5.25%, while the two-year fell nine to just under 4.80%.
- US (Thursday 1 October close): The S&P 500 rose 0.19% to 7,666.45, the Nasdaq 100 0.31% to 30,501.56, the Dow flat. The equal-weight fund gained 0.47% against the cap-weighted 0.18%. Alphabet fell 1.70%, Apple 0.81% and Amazon 0.37%, against Nvidia 1.09%. Accenture rose about 16%, a record one-day gain. Energy led, up 1.95%; health care lagged 1.32%, biotech 2.01%.
- Europe: The Stoxx Europe 600 fell 1.14% to 627.65, its lowest close since June, and the Euro Stoxx 50 1.49%. Euro-zone banks fell 3.90%, the largest sector move on the board. London lost 1.7%, thirty-year gilt yields touching 6%.
- Asia (Friday morning): Hong Kong is the weak point, the Hang Seng down 2.64% to 23,964 and its technology sub-index 2.45%, the sharpest fall since March. Tokyo gave back 0.85%. Mainland China is shut for Golden Week, so nothing is quoted there.
- Commodities and rates: Brent holds near 102, gold spot at 4,186 is up 0.4% and still down 2.3% on the week. The thirty-year yield was unchanged at 5.628%, and high-yield spreads widened seven basis points to 318, widest since March.
- Market regime: Transitioning, with the VIX at 16.39, the cash curve in contango, twenty-day realised volatility at 10.42% and rising, and the index near its fifty-day average.
Source: Saxo, Bloomberg, CBOE. Levels as of the 1 October close unless stated. Yield changes are derived from the prior session’s reading. Past performance is not indicative of future results.
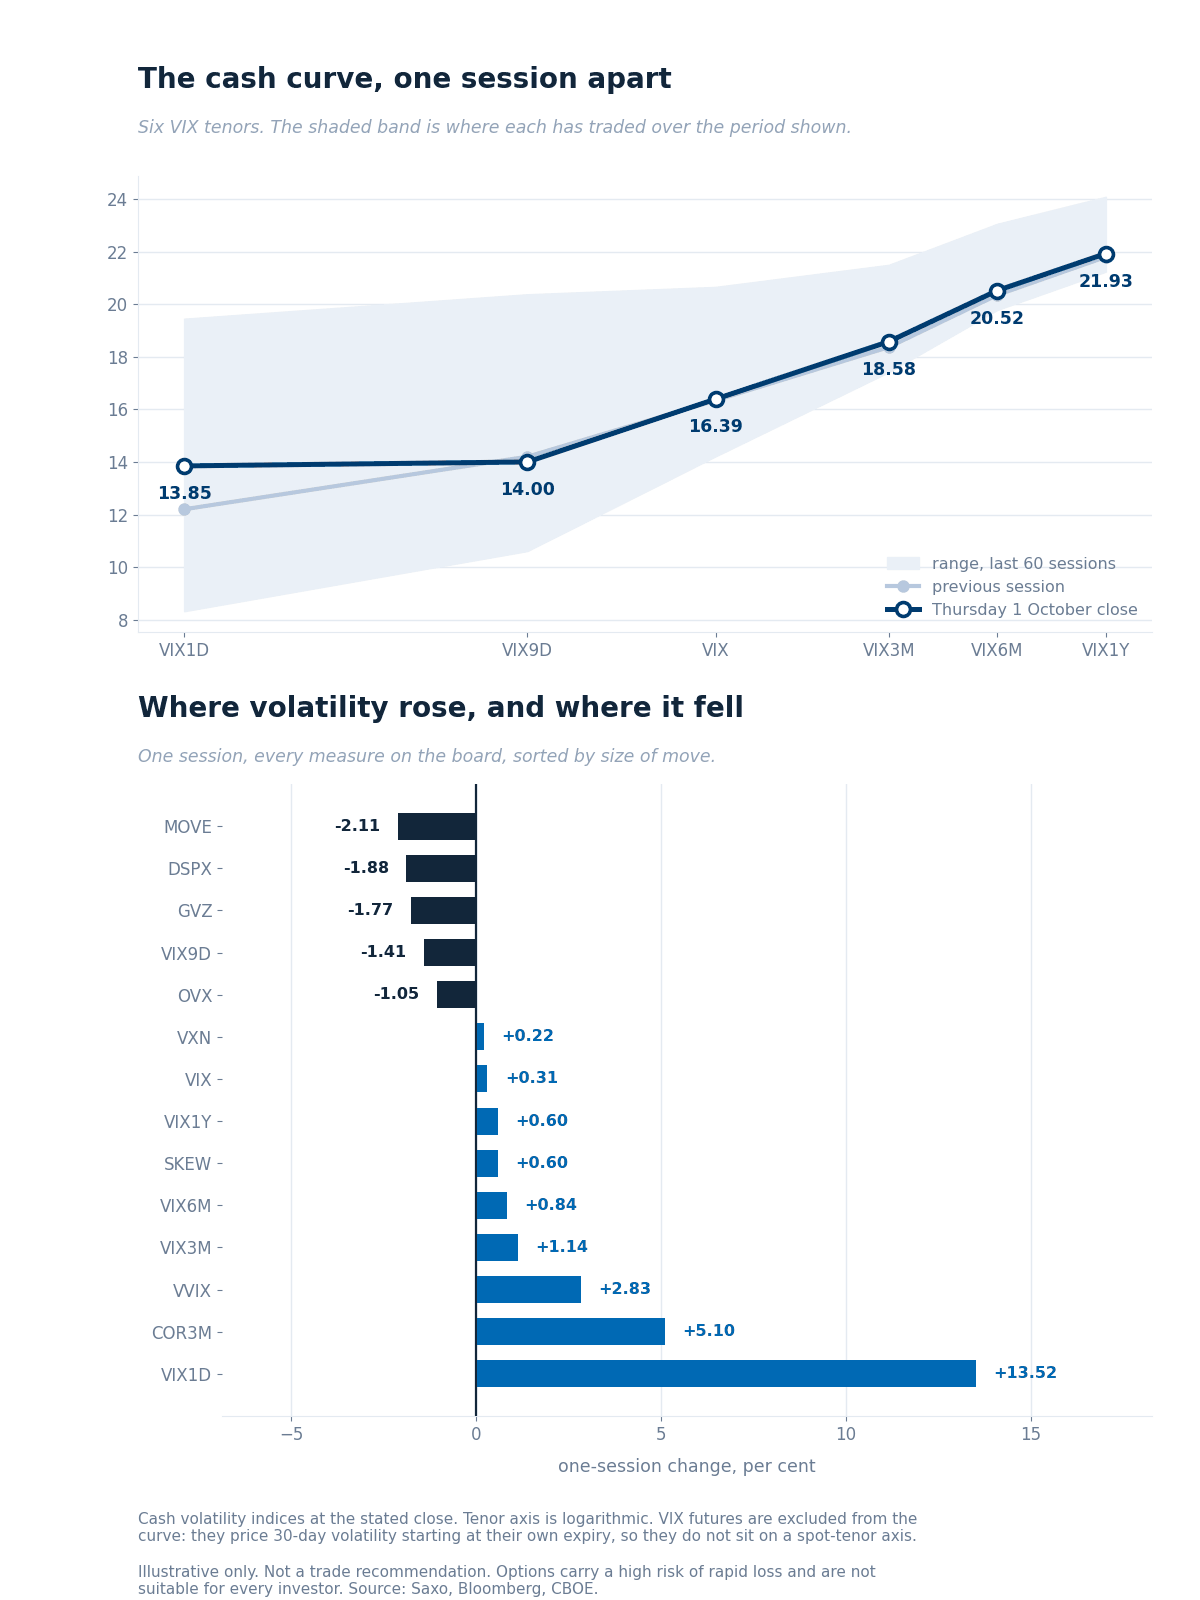 The six cash VIX tenors at Thursday’s close against the previous session, over their 60-session ranges.
Reading the curve
- The front end did all the work. VIX1D rose 13.52% to 13.85 into today’s payrolls, while VIX9D eased to 14.00 and the VIX added 0.31% to 16.39. The tenors out to a month sit above their 60-session medians; the three beyond it sit below.
- Rates still hold the extreme. MOVE at 108.14 is higher than 59 of our last 60 readings even after easing 2.11%, while gold volatility at 23.32 is lower than 55 and oil volatility eased to 51.69.
- Ratios the graphic does not carry. VIX3M to VIX is 1.13 and the Nasdaq-to-S&P ratio 1.37. SKEW rose to 142.77, high against a long-run norm nearer 115, though 43 of our last 60 were higher.
VIX futures
- The front contract is 18.00 and the second 18.52, a contango ratio of 0.970. The premium to spot widened to 1.61 from 1.39.
- Put-call parity puts the October forward at 18.08 and the November at 18.63, within 0.11 of each feed, so neither has rolled and the comparison holds. Neither sits in the graphic: both price thirty-day volatility from their own expiry.
Source: Saxo, Bloomberg, CBOE, 2 October 2026, approx. 06:00 CET. Past performance is not indicative of future results.
Saxo’s implied-volatility rank across 187 US and 335 euro-zone option underlyings, where 0 is a one-year low and 100 a high. The US universe held the same names across both sessions, so the comparison is like for like.
- The typical name got dearer. The median US rank rose to 45.8 from 43.6 and the median percentile to 61.5 from 58.7; the euro-zone median is 46.9.
- The index wrappers are still the cheapest things on the board against their own year. The S&P 500 fund sits on 18.6, the Russell 2000 fund 23.5 and the Dow fund 25.5, a group median of 24.5 against a board 45.8, while the seven largest names carry 56.2. In our view the wrappers may charge less for that spread than the correlation measures now do.
- Rates and credit keep the top. The long-bond fund holds its one-year high at 100.0, the investment-grade credit fund 92.9 and the intermediate Treasury fund 69.3.
- Health care is where single-name volatility is bid, a sector median of 68.1 behind only rates and credit, with Merck at 96.7, on a session the sector fell. The two largest rank falls were events clearing: Accenture 19.0 points and Micron 14.1, leaving Micron at 6.7 and Nvidia at 4.4, near its one-year low. See Saxo pricing for costs and charges.
Data source: Saxo, as of 2 October 2026, reflecting the 1 October close. Past performance is not indicative of future results.
Based on end-of-day 1 October, Thursday’s positioning and not today’s price action.
The flow does not speak to today’s reading, which is worth stating plainly rather than dressing up. Eight of the ten groups carry a low-conviction label and the dominant content is deep in-the-money ladders crossed at mid, paired legs and roll machinery.
- Single-name flow had no net lean. Where an aggressor side is legible it offsets, and the largest premium in the set is financing structure rather than conviction.
- Sector and ETF flow was neutral to hedging, with index-level activity built deliberately delta-neutral. Nothing reads as a dispersion position being unwound, which is the one signature today’s framing would have predicted. Named funds are market context only; see Saxo pricing for costs and charges on exchange-traded fund trades.
What the option market priced for this week, drawn around last Friday’s close.
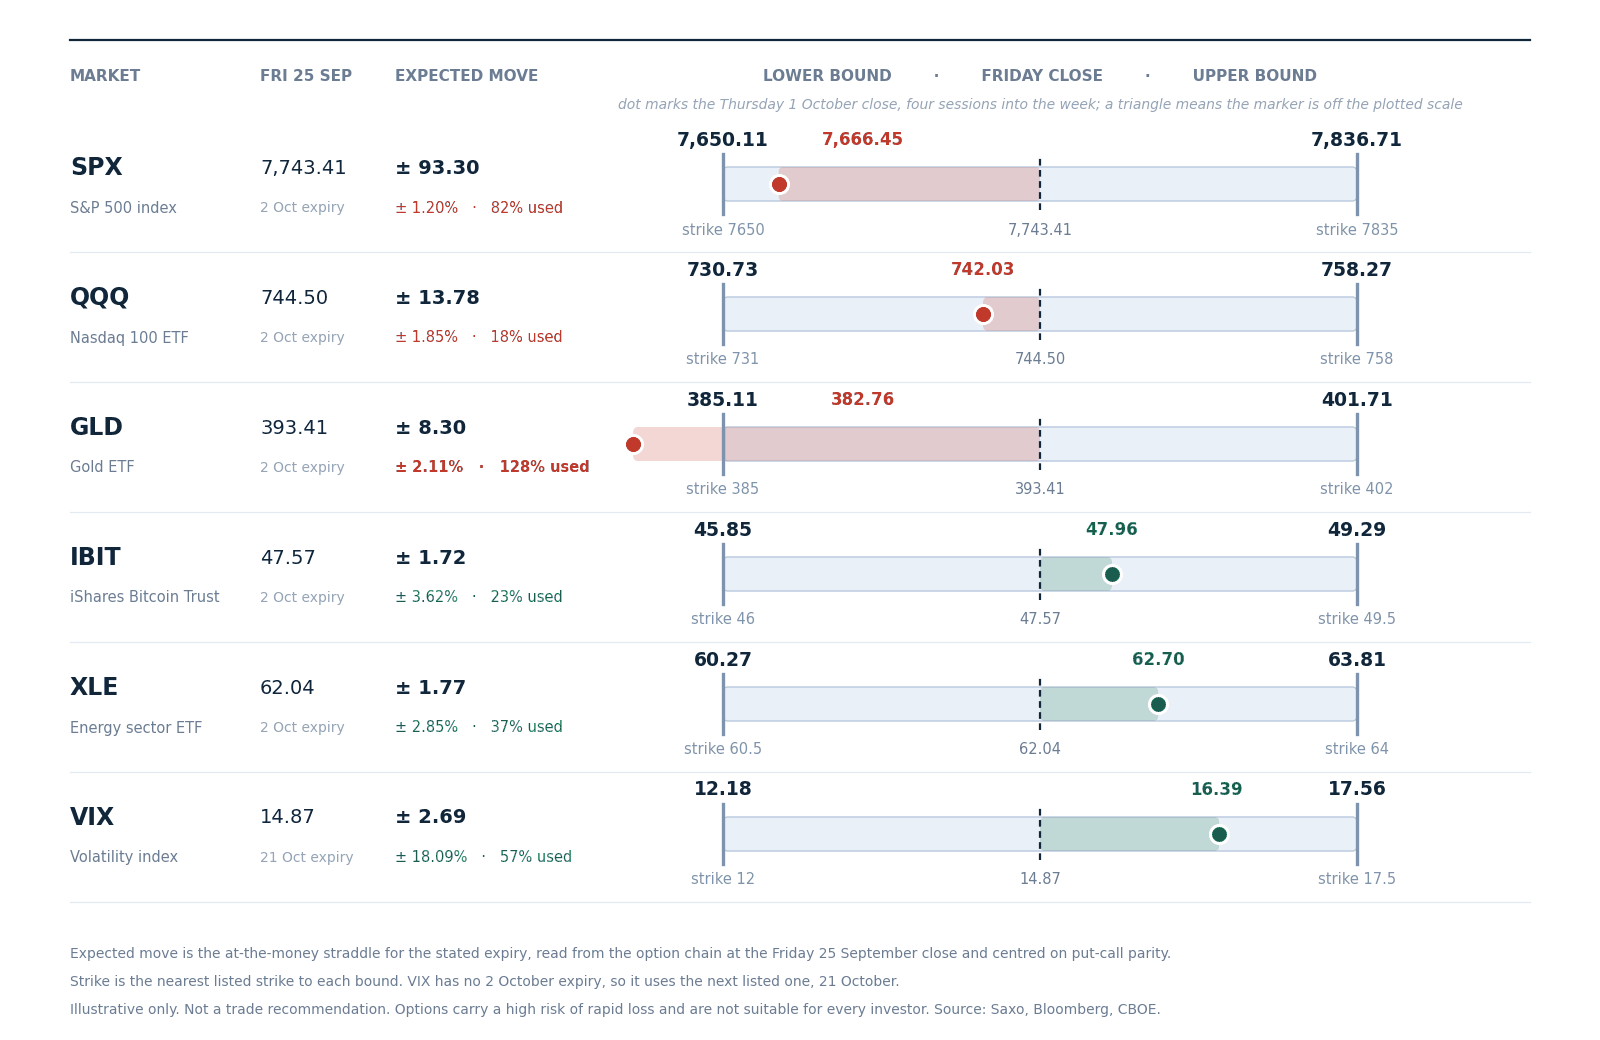 Expected move to Friday 2 October, drawn around the 25 September close with the nearest listed strike at each bound. Volatility uses the 21 October expiry, which is the next listed one. Read from the chain at Friday’s close, not a forecast.
- Four sessions into five, the index has bought back room. It sits at 7,666.45 against a lower bound of 7,650.11, having used 82% of the week’s priced range against 98% a session ago.
- The gold fund is still the outlier, at 128% used and below its 385.11 floor, though down from 151% yesterday. It has travelled further in four sessions than the option market priced for the whole week.
- The rest of the board barely moved. The Nasdaq 100 fund has used 18%, energy 37% and the bitcoin fund 23%, while volatility has used 56% and is the only row above its anchor.
- Options carry a high risk of rapid loss and are not suitable for every investor; see Saxo pricing for costs and charges.
The US cash session runs 15:30 CET to 22:00 CET. Euro-zone flash inflation lands at 11:00 CET, headline forecast 3.6% against 3.2%, into a market that has just marked euro-zone banks down almost four per cent.
The September employment report follows at 14:30 CET, an hour before the open, with payrolls forecast at 90,000 against 162,000. Today’s expiry settles at the 22:00 CET close, so it prices the number and the session’s whole response to it, not the run-up alone. Dallas Fed president Logan, the most hawkish voice of this week’s split, speaks at 16:00 CET. Future outcomes are uncertain and may result in losses.
- Session implied move. SPXW options price 52.50 points, or 0.685%, to tonight’s close, covering payrolls and the session after it; next Friday’s prices 115.75 points, or 1.510%. Quotes before the open are indicative.
- What the clock did not explain. The same expiry priced about 70 points yesterday with two sessions to run; flat-volatility decay would have left roughly 49. Three points have been added rather than taken out, which is what VIX1D’s rise also says.
- Where volatility is not paid for. Correlation got dearer and dispersion cheaper, yet the index wrappers are still the cheapest volatility on the board, the S&P 500 fund at 18.6 against a median of 45.8. In our assessment the market may have nudged toward things moving together without repricing the index.
- Tail risk signal. MOVE sits above 59 of 60 readings and the long-bond fund at a one-year rank high, against gold volatility lower than 55. In our view the paid-for risk may sit in rates, not equity tails.
The thing to watch is whether the two measures keep converging. Correlation has been bid from a low base, dispersion has eased, and the tape has delivered a session where the average stock did the work. The index is priced as though neither happened. Options carry a high risk of rapid loss.
Important note: The strategies and examples provided in this article are purely for educational purposes. They are intended to assist in shaping your thought process and should not be replicated or implemented without careful consideration. Every investor or trader must conduct their own due diligence and take into account their unique financial situation, risk tolerance, and investment objectives before making any decisions. Remember, investing in the stock market carries risk, and it’s crucial to make informed decisions.
| More from the author |
|---|