
Access all our platforms from a single account.

Rate vol breaks 100, the index sits still - Options Brief - 25 September 2026

Summary: The Treasury volatility index closed above 100 for the first time in three months on Thursday. The S&P 500 closed flat, and the VIX did not move off its median.
MOVE, the Treasury volatility index, closed above 100 for the first time in the three-month record on Thursday. The S&P 500 closed flat.
MARKET REGIME: LOW VOL BULL | VIX 15.67 | TERM STRUCTURE: CONTANGO | SKEW: ELEVATED (146.04) | FRONT-MONTH VIX FUTURES: 17.95
Key findings
- Rate volatility broke 100. MOVE rose 9.56% to 104.58, above all 60 prior readings and up 33% in two sessions.
- The index went still while it did. The S&P 500 closed 0.02% lower as the equal-weight index fell 0.53%.
- The Treasury ETF gauge followed. It rose 18.07% to 16.07, a three-month high and 4.4 points above its own median.
Past performance is not indicative of future results.
Headline driver
The long end went further before it stopped. The thirty-year yield reached 5.50% on Thursday, its highest since 2004, then gave back a few basis points. The ten-year traded as high as 5.22% before easing to 5.18% early Friday, up six basis points, while the two-year rose only a couple and sits just under 4.90%. The average yield across the USD 32 trillion Treasury market is now 5.05%.
The index absorbed that without moving. Meta Platforms rose 4.50% to 777.59 after its Connect event, and Oracle fell hard after declaring force majeure at a New Mexico data centre. A large gain and a large loss is how an index closes unchanged without anything being calm.
Market snapshot
- US (Thursday 24 September close): The S&P 500 slipped 0.02% to 7,704.13, the Nasdaq 100 rose 0.03% to 30,478.86 and the Dow fell 0.31% to 51,355.15. Breadth was weaker than the headline: the equal-weight S&P 500 fell 0.53% and seven of the ten sector funds tracked here closed lower. Communication services led on 1.27%, with materials down 1.19%. The long-bond fund lost 1.29%.
- Europe: The Stoxx Europe 600 fell 0.55% to 636.44 and the DAX 0.57% to 25,266.53, its lowest since 24 July. Euro-zone banks were the weakest major sector at 0.90% lower, and the Germany to France ten-year spread touched a fourteen-year high of 112 basis points.
- Asia: Japan’s Nikkei 225 is 1.01% higher on Friday at 66,174.88. Mainland China, South Korea and Taiwan are shut for holidays, so Thursday’s closes stand: the CSI 300 1.73% lower and the Hang Seng 1.69% lower with its technology sub-index off 2.14%.
- Commodities and rates: Brent trades near USD 105.4, close to unchanged on the week after a range of more than USD 10. Gold is down about 3% on the week and silver 5%. The ten-year yield is 5.18%, the thirty-year near 5.47% and the two-year just under 4.90%.
- Market regime: Low Vol Bull, with the VIX at 15.67, the cash curve in contango and twenty-day realised volatility at 10.66%.
Source: Saxo, Bloomberg, CBOE. Levels as of the 24 September close unless stated. Past performance is not indicative of future results.
Volatility surface - 25 September 2026, approx. 06:00 CET
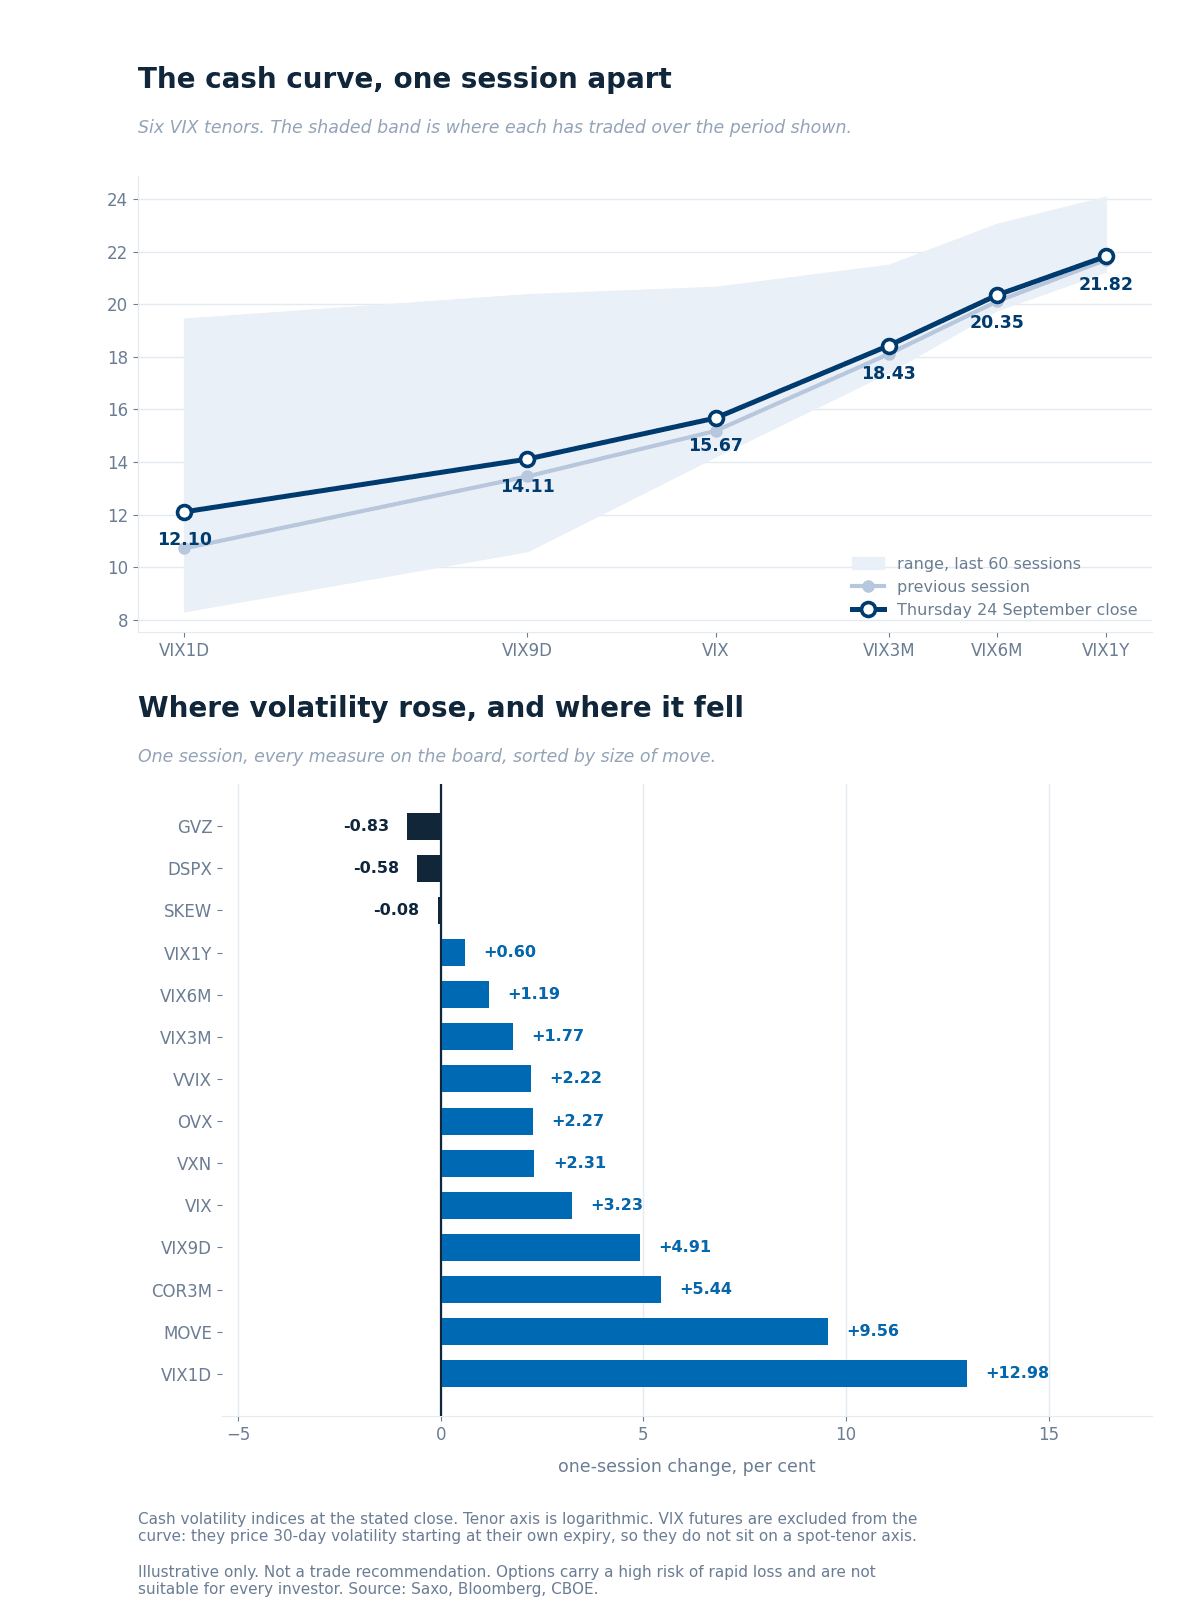
The six cash VIX tenors at Thursday’s close against the previous session and the 60-session range of each, with every measure’s one-session change below.
Reading the curve
- The front lifted, the back did not. VIX1D rose 12.98% to 12.10 and VIX9D 4.91% to 14.11, against 0.60% at one year. A second such session has lifted the curve off its 60-session floor.
- The two largest moves on the board are not on this curve. MOVE rose 9.56% to 104.58, above all 60 prior sessions in a store ranging 68.16 to 95.45, and the Treasury ETF gauge 18.07% to 16.07. Both price Treasury movement, so neither belongs on an equity tenor axis.
- Ratios the graphic does not carry. VIX3M to VIX eased to 1.18, VXN to VIX to 1.35, with 51 of the previous 60 wider.
VIX futures
- Front-month 17.95, the October contract, confirmed by put-call parity at 17.88, so it has not rolled. Against a 15.67 cash close that is a premium of roughly 2.28 points, narrowed from 2.62.
- Second-month 18.62, ratio 0.965, contango. Neither sits in the graphic: both price volatility starting at their own expiry.
Data source: Saxo, Bloomberg, CBOE, as of 25 September 2026, approximately 06:00 CET. Past performance is not indicative of future results.
Single-name volatility - where implied volatility sits against its own year
Saxo’s implied-volatility rank across 186 US and 326 euro-zone option underlyings, where 0 is a one-year low and 100 a one-year high. Both US sessions cover the same names.
- The typical name got dearer, mildly. The median US rank rose to 38.6 from 37.2 and the median percentile to 48.2 from 46.6.
- The rates group went to the top of the board. Its median rank rose to 67.7 from 50.4, moving ahead of energy at 52.4, which had led a session earlier. The long-bond fund carries a rank of 80.1 against a percentile of 98.0, and the seven-to-ten-year fund 67.7 against 98.4. Rank measures distance from the year’s extremes; percentile, how many days looked like today.
- The index group still sits near the floor, at a median rank of 18.5, with the S&P 500 fund at 12.7. The mega-cap group is little changed at 38.0. In our view a board where Treasury funds price near their yearly extreme and index funds near their yearly low is the single-name version of the same split. Options carry a high risk of rapid loss and are not suitable for every investor; see Saxo pricing for costs and charges.
Data source: Saxo, as of 25 September 2026, reflecting the 24 September close. Day counts are Saxo’s one-year implied-volatility percentile. Past performance is not indicative of future results.
Options flow sentiment
Based on end-of-day 24 September, Thursday’s positioning and not today’s price action.
The flow supports the rates half of this brief and is silent on the equity half. Rates and credit activity was duration and credit protection bought into a higher-yield regime, with no volatility-buying signature behind it. Index-level activity was two-sided and delta-flat, three mega-caps carried opened upside into the late-October earnings window, and nothing in the volatility complex survived the opening filter.
In our view that makes the flow context rather than evidence. Named funds are market context only; see Saxo pricing for costs and charges on exchange-traded fund trades.
Where the week’s range sits
What the option market priced for this week, against where Thursday left it.
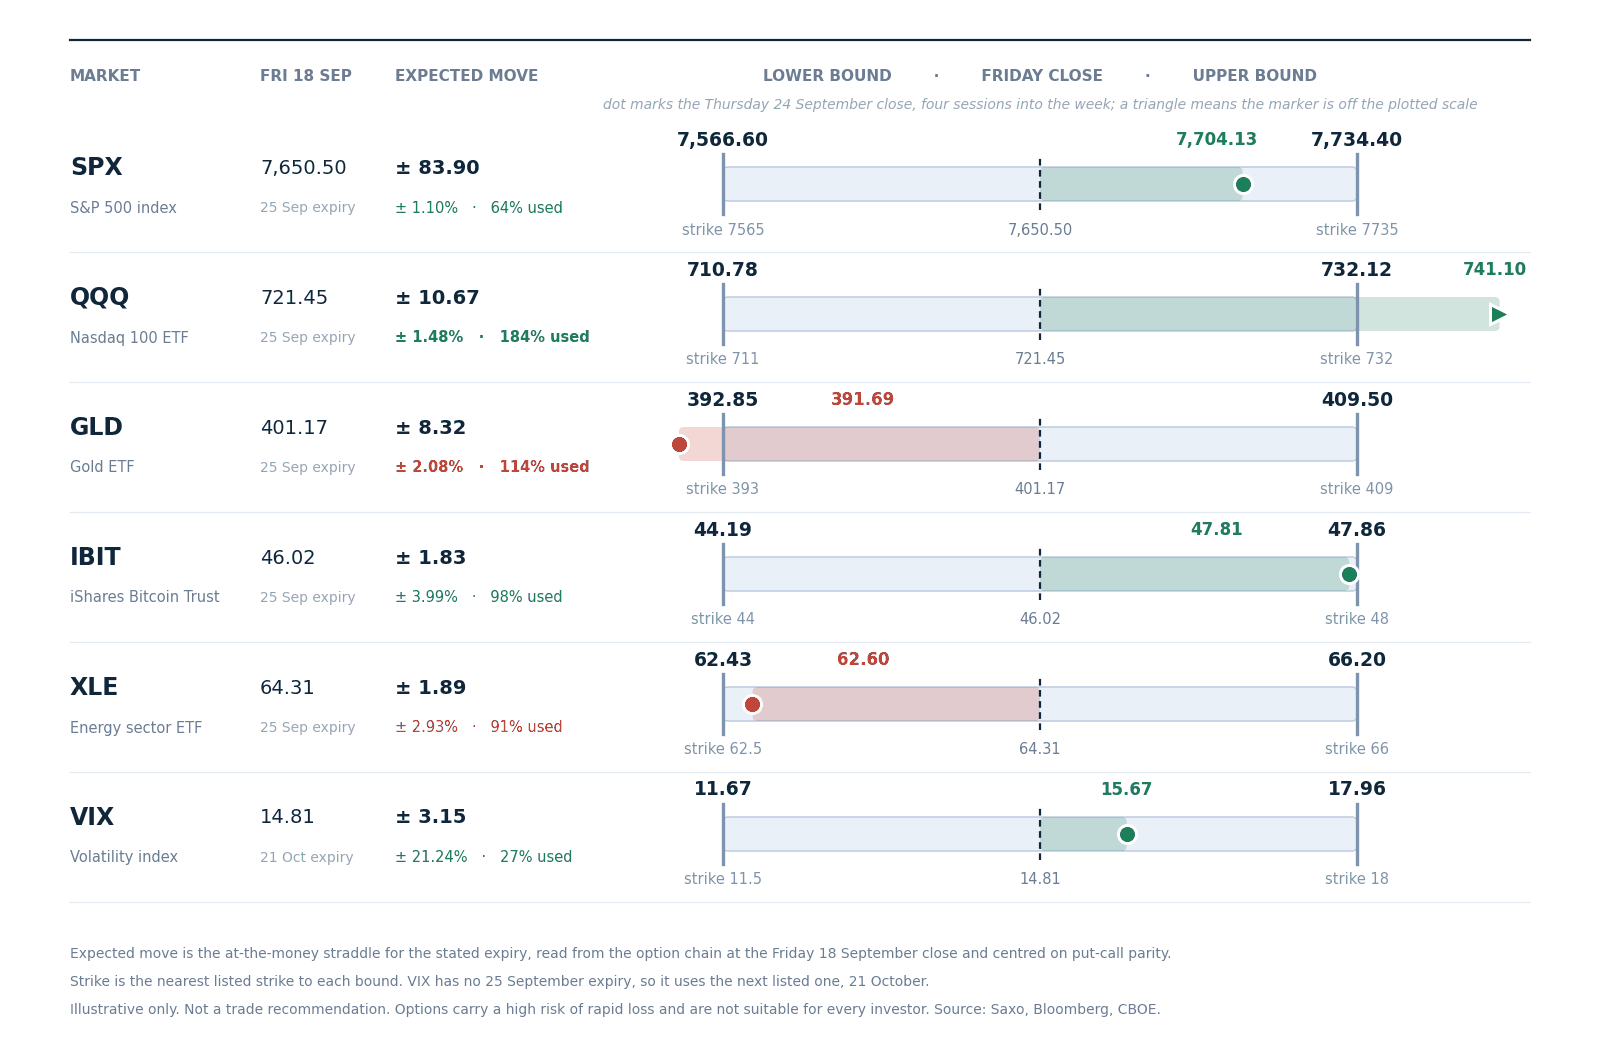 Expected move to today’s expiry, drawn around the Friday 18 September close with the nearest listed strike at each bound, and Thursday’s close marked. Volatility uses the 21 October expiry, so its band covers a month. Read from the chain at Friday’s close.
- Two of the six have spent the week’s range. The Nasdaq 100 fund sits 184% through its 10.67 point band and gold 114% through the other way. The bitcoin fund at 98% and the energy fund at 91% both stepped back inside theirs during Thursday’s session, having been beyond them a day earlier.
- The index and volatility still have room. The S&P 500 has used 64% of its 83.90 point band and volatility 27% of a month-long one. In our view a week that leaves the index mid-band while its own components run through theirs describes dispersion, not calm. Options carry a high risk of rapid loss and are not suitable for every investor; see Saxo pricing for costs and charges on exchange-traded fund trades.
Today’s catalysts
The final University of Michigan consumer sentiment reading for September arrives at 16:00 CET, half an hour into a cash session running 15:30 CET to 22:00 CET.
Today is also a quarterly expiry, so index and single-stock open interest rolls off into this afternoon’s close. Future outcomes are uncertain and may result in losses.
What the market is pricing
- Session implied move. SPX options price about 0.54% to tonight’s close, roughly 42 points, derived from at-the-money pricing rather than a forecast.
- Event implied range. Yesterday this expiry priced 0.70% with two sessions left. It prices 0.54% with one, against 0.50% from decay alone, so about 9% came from volatility. The 2 October expiry prices 1.44%, and carries payrolls.
- Where volatility is being paid for. MOVE at 104.58 is above every reading in the three-month store and 42% above its median of 73.78, while the VIX sits within 0.2 of its own median. In our assessment the repricing is in rates, and equity index volatility has not participated.
- Tail risk signal. SKEW was little changed at 146.04, 22 of the previous 60 higher, while three-month implied correlation rose 5.44% to 10.66 from a depressed base. In our view that pairs a market still paying for the unusual with one only starting to price its components together.
Thursday’s flat close was not stillness. In our view the open question is whether equity index volatility, still sitting at its three-month median, eventually follows the move in rates or goes on ignoring it. Options carry a high risk of rapid loss and are not suitable for every investor. Past performance is not indicative of future results.
Important note: The strategies and examples provided in this article are purely for educational purposes. They are intended to assist in shaping your thought process and should not be replicated or implemented without careful consideration. Every investor or trader must conduct their own due diligence and take into account their unique financial situation, risk tolerance, and investment objectives before making any decisions. Remember, investing in the stock market carries risk, and it’s crucial to make informed decisions.
| More from the author |
|---|