
Access all our platforms from a single account.

The index held, the average stock did not - Options Brief - 1 October 2026

Summary: The index barely moved yesterday. The average stock in it fell three times as much, and the option market is charging less than usual for the difference.
The S&P 500 lost a quarter of a per cent yesterday. The average stock in it lost three times that.
MARKET REGIME: TRANSITIONING | VIX 16.34 | TERM STRUCTURE: CONTANGO | SKEW: ELEVATED (141.92) | FRONT-MONTH VIX FUTURES: 17.73
Key findings
- The tape ran a gradient. The Nasdaq 100 rose 0.23%, the S&P 500 fell 0.25%, its equal-weight version 0.75% and the Dow 0.86%.
- The option market charges less for that spread than usual: implied correlation held at 11.17, above 72 of our 85 stored sessions, and dispersion eased to 36.25, below its median.
- Rate volatility set a third straight high. MOVE rose 3.61% to 110.46, above all 84 readings we hold.
The August inflation report came in soft and the revisions came in softer. Core personal consumption expenditures rose 0.2% on the month against 0.3% expected, and the annual rate printed 3.0% against 3.3%, most of the difference coming from revisions to June and July under a new calculation method. Private payrolls were firmer, at 90,000 against 75,000 expected.
The curve read that as steepening rather than easing. The ten-year yield touched a new post-crisis high just above 5.30% before settling near 5.28%, about four basis points higher, while the two-year ended just under 4.90%. That puts the two-to-ten slope back near 40 basis points from roughly 20 less than two weeks ago.
Equities closed mixed into quarter end, capping the weakest month for the S&P 500 since June. Overnight, Micron's record quarter and a guide roughly 13% above it lifted Asian memory and equipment names.
- US (Wednesday 30 September close): The S&P 500 fell 0.25% to 7,651.54 while the Nasdaq 100 rose 0.23% to 30,408.50 and the Dow fell 0.86% to 50,911.09. The equal-weight S&P 500 fell 0.75%, three times as much. Apple rose 1.10%, Amazon 1.01%, Alphabet 0.93% and Microsoft 0.77%, while Meta Platforms fell 1.84%. Nine of eleven sector funds fell, health care 1.35%, industrials 1.27% and financials 1.13% lower, against technology 0.64% higher.
- Europe: The Stoxx Europe 600 eased 0.50% to 634.88 and the Euro Stoxx 50 0.81% to 6,269.03, with euro-zone banks 1.13% lower. The DAX fell 0.79% and Paris 0.89%.
- Asia (Thursday morning): Chip exposure split the region. The Nikkei 225 is up about 2.8% on Micron's outlook and the Kospi 1.15% higher, while the CSI 300 added 0.29%. Hong Kong is closed for National Day, so the Hang Seng's 24,613 is Wednesday's level rather than a move.
- Commodities and rates: The gold fund fell 0.54% to 380.84, silver 1.75% and the miners 1.43%. The ten-year yield rose about four basis points to 5.279% and the thirty-year about six to 5.624%, while the two-year eased one to 4.881% and the one-year four to 4.550%.
- Market regime: Transitioning, with the VIX at 16.34, the cash curve in contango and twenty-day realised volatility at 10.52% and rising.
Source: Saxo, Bloomberg, CBOE. Levels as of the 30 September close unless stated. Yield changes are derived from the prior session's reading. Past performance is not indicative of future results.
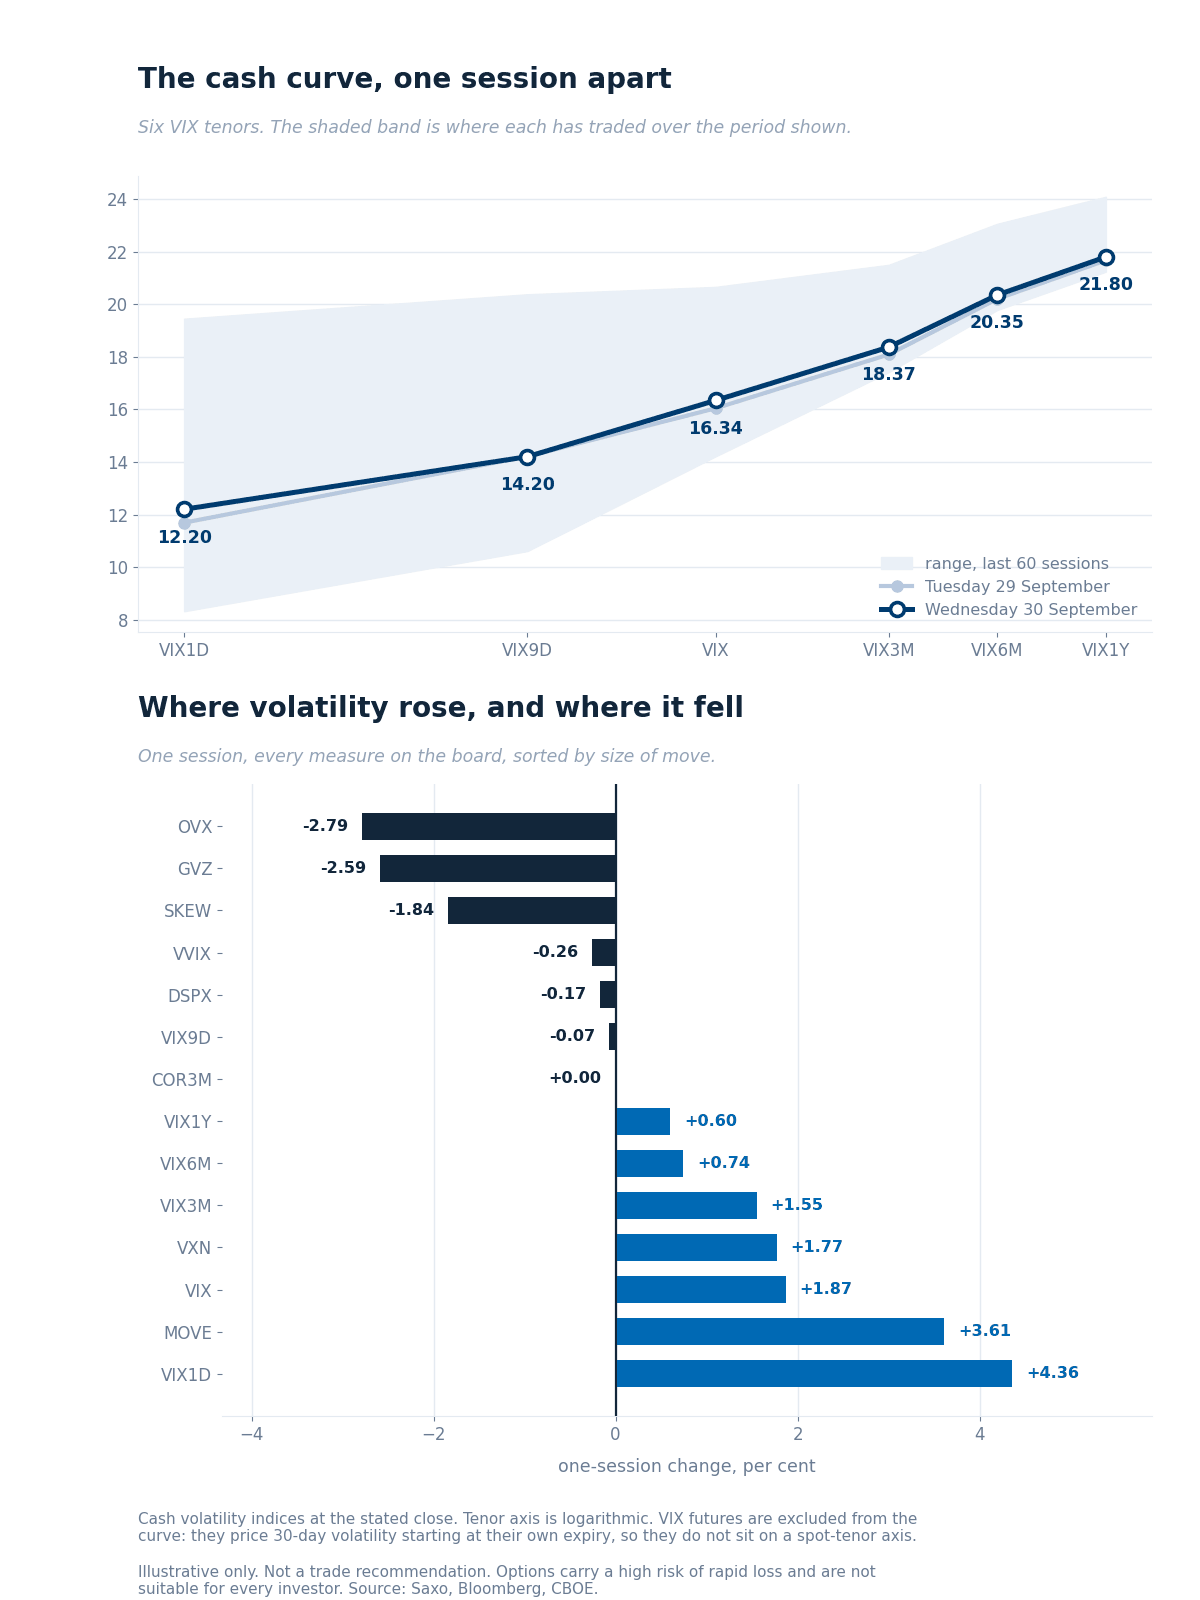 The six cash VIX tenors at Wednesday's close against the previous session, over their 60-session ranges, with changes below.
Reading the curve
- The whole cash curve lifted and the front lifted most. VIX1D rose 4.36% to 12.20, the VIX 1.87% to 16.34 and VIX3M 1.55% to 18.37, while VIX9D held at 14.20. Every tenor sits inside its band.
- Rates again did the largest moving. MOVE gained 3.61% to 110.46 and the Treasury ETF gauge 2.23% to 18.30, while oil volatility eased 2.79% and gold volatility 2.59% to 23.74. Both price a different underlying from the VIX and are never set against it here.
- Ratios and tails, which the graphic does not carry. VIX3M to VIX is 1.12 and the Nasdaq-to-S&P ratio 1.38, while SKEW eased 1.84% to 141.92, below 64 stored sessions.
VIX futures
- The front contract is 17.730 and the second 18.410, a contango of 0.965. The premium to spot narrowed to 1.39 from 1.49.
- Put-call parity puts the October forward at 17.89 and the November at 18.49, within 0.16 of each feed, so no roll has occurred and the session comparison stands. Neither is in the graphic: both price 30-day volatility from their own expiry.
Source: Saxo, Bloomberg, CBOE, 1 October 2026, approx. 06:00 CET. Past performance is not indicative of future results.
Saxo's implied-volatility rank across 187 US and 335 euro-zone option underlyings, where 0 is a one-year low and 100 a one-year high. The US universe held the same 187 names across both sessions, so the comparison is like for like.
- The typical name barely moved. The median US rank eased to 43.6 from 44.1 and the median percentile to 58.7 from 59.5; the euro-zone median is 41.8.
- The index wrappers are the cheapest things on the board against their own year. The S&P 500 fund sits on a rank of 17.7, the Russell 2000 fund 21.7 and the Dow fund 23.1, all well under the board median, while the seven largest names carry a median rank of 56.3. In our view the ranks may be saying what the correlation measures are not.
- The exception is the biggest name of all. The largest semiconductor name sits on a rank of 4.7, close to its own one-year low, which is a striking place for it to be in a week this heavy.
- Rates and credit still own the top. The long-bond fund holds its one-year high at 100.0 and the investment-grade credit fund 98.7, with the intermediate Treasury fund up 4.6 rank points to 71.5. Energy supplied three of the six largest falls. See Saxo pricing for costs and charges.
Data source: Saxo, as of 1 October 2026, reflecting the 30 September close. Past performance is not indicative of future results.
Based on end-of-day 30 September, Wednesday's positioning and not today's price action.
- Single-name flow read as supplied more often than bought. Seven of the ten groups were unsided or income-shaped and two more were collar-shaped, with direction only in the hedging sense. Semiconductors were the one group carrying a real lean, and it was long-dated upside accumulated against near-dated premium sold into a scheduled event.
- Sector and ETF flow contradicted the day's framing, which is worth stating plainly. Index-level volatility was bought rather than supplied, including a far out-of-the-money tail hedge on the largest lot count in the set, and there was no mega-cap accumulation against broad-market selling. Protection with a readable side sat at sector level, in banks and broad financials, while the weakest sector of the day had its downside sold. Named funds are market context only; see Saxo pricing for costs and charges on exchange-traded fund trades.
What the option market priced for this week, drawn around Friday's close.
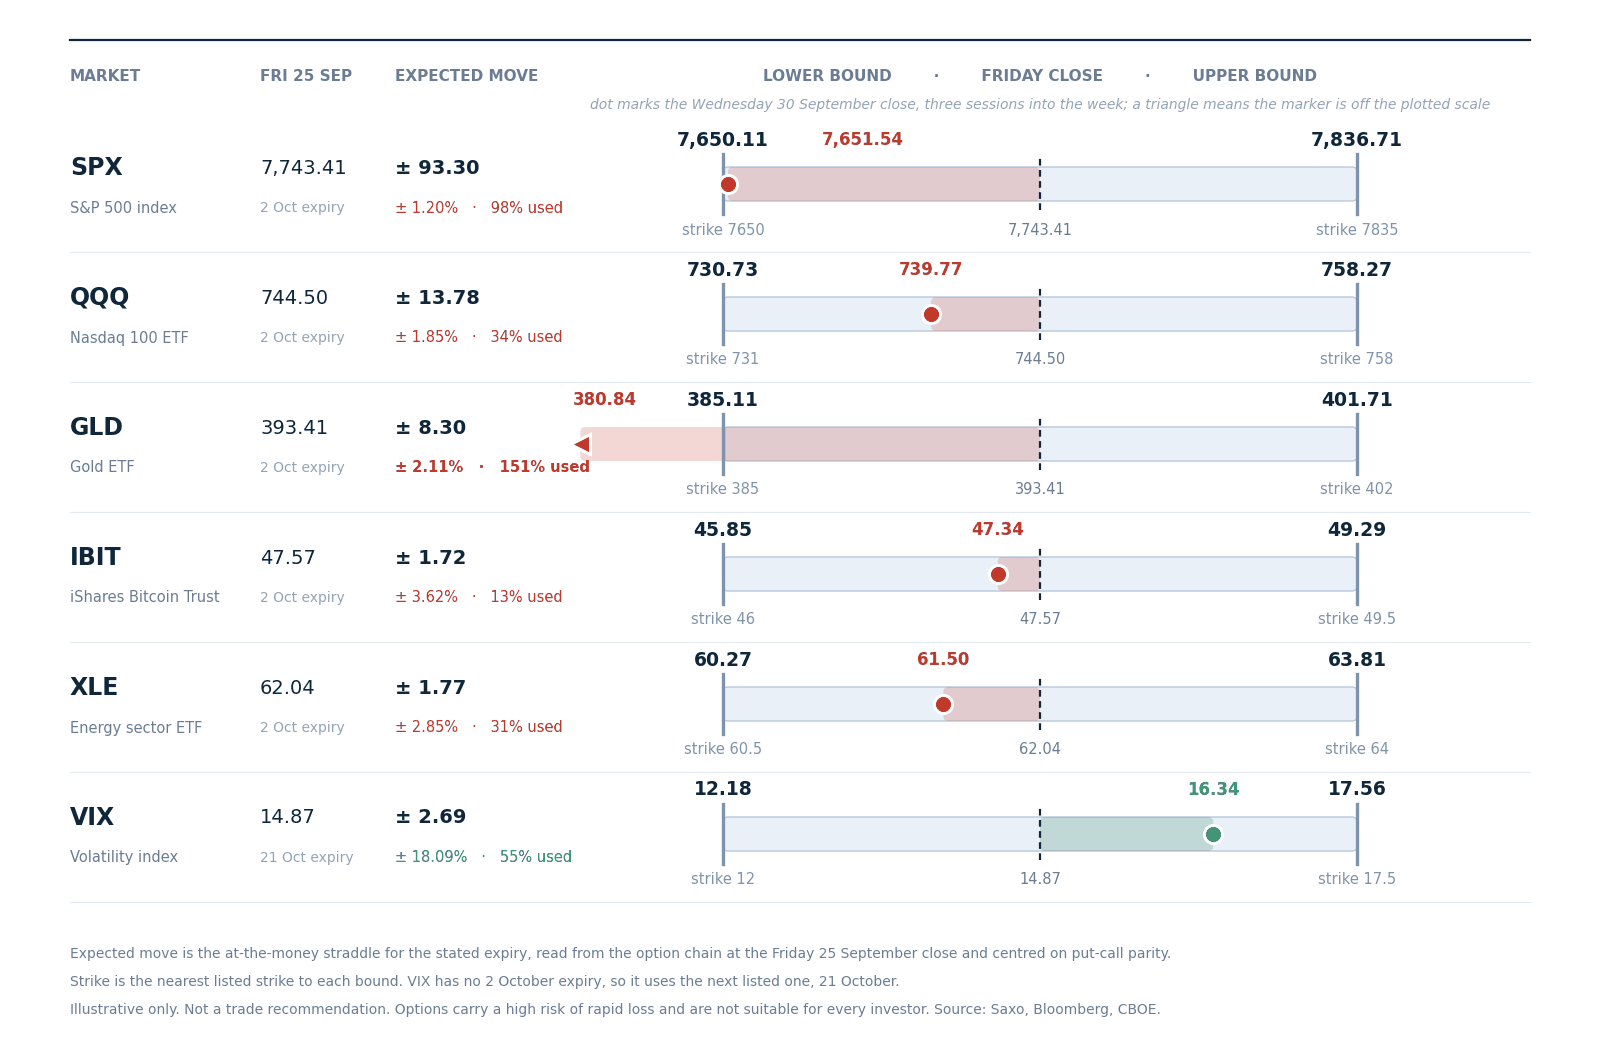 Expected move to Friday 2 October, drawn around the 25 September close with the nearest listed strike at each bound. Volatility uses the 21 October expiry, which is the next listed one. Read from the chain at Friday's close, not a forecast.
- Three sessions into five, the index has all but spent its week. The S&P 500 sits at 7,651.54 against a lower bound of 7,650.11, having used 98% of the week's priced range with two sessions to run, 1.43 points from the floor.
- The rest of the board has plenty left. The Nasdaq 100 fund has used 34%, energy 31% and the bitcoin fund 13%. Volatility has used 55% and is the only row above its anchor.
- The gold fund is the outlier again, at 151% used and below the 385.11 floor, against 127% a session ago.
- Options carry a high risk of rapid loss and are not suitable for every investor; see Saxo pricing for costs and charges.
The US cash session runs 15:30 CET to 22:00 CET. The September ISM manufacturing survey arrives at 16:00 CET, half an hour after the open, which puts it inside the session that today's expiry settles rather than ahead of it. Accenture and Nike report.
Tomorrow brings the September employment report, the week's largest scheduled item and the reason the Friday expiry carries what it does. Hong Kong is closed for National Day, so Asian liquidity may be thinner than usual through the European morning. Future outcomes are uncertain and may result in losses.
- Session implied move. SPXW options price 0.61%, about 47 points, to tonight's 22:00 CET close, the at-the-money straddle for today's expiry. Quotes ahead of the US open are indicative.
- Event implied range. The 2 October expiry prices 0.91%, about 70 points, covering ISM today and tomorrow's employment report. A session ago it priced 78.3 points with three sessions to run; decay alone would have left about 64, so roughly six points have been added.
- Where volatility is not paid for. Implied correlation at 11.17 is above 72 of our 85 stored sessions and dispersion at 36.25 below its median, on a day the equal-weight index moved three times the headline one. In our assessment the market may be pricing less of that spread than the tape delivered.
- Tail risk signal. SKEW eased to 141.92, below 64 stored sessions, while the front of the curve rose. In our view the bid may be for the next two sessions, not the far tail.
The gap that matters is between the index and its own members, not between tenors. Very few names are holding the headline level up, the cost of insuring the difference has not moved, and the week's two biggest items land inside two sessions. Options carry a high risk of rapid loss.
Important note: The strategies and examples provided in this article are purely for educational purposes. They are intended to assist in shaping your thought process and should not be replicated or implemented without careful consideration. Every investor or trader must conduct their own due diligence and take into account their unique financial situation, risk tolerance, and investment objectives before making any decisions. Remember, investing in the stock market carries risk, and it’s crucial to make informed decisions.
| More from the author |
|---|