Outrageous Predictions
Carry trade unwind brings USD/JPY to 100 and Japan’s next asset bubble
Charu Chanana
Chief Investment Strategist
A Trump-driven Fed pivot crashes the carry trade, hurling USD/JPY to 100 and unleashing Japan’s wild...

Summary: Sitting on significant unrealized gains in tech, but worried the second half of the year could give some back? Options give investors a third path: keep the position, add a floor, and in some cases get paid to do it. This article walks through three practical hedging approaches using one investor's USD 250,000 tech portfolio as the guide.
A USD 250,000 tech portfolio, significant unrealized gains, and a nervous feeling about the months ahead – here is how one investor thought about protecting what he had built. (fictional, but educational use-case)
Thomas holds a concentrated tech portfolio – NVDA, AAPL, MSFT, AMZN, and META making up roughly 75% of his USD 250,000. He still believes in the long-term thesis. But mid-year, with macro uncertainty building, he wants a floor without triggering a sale: selling means a capital gains event, re-entry timing risk, and losing positions he intends to hold for years. Options offer a different path.
Three approaches are worth understanding – the protective put, the collar, and the portfolio-level index hedge – each with a different trade-off between cost, simplicity, and coverage.
Important note: The strategies and examples provided in this article are purely for educational purposes. They are intended to assist in shaping your thought process and should not be replicated or implemented without careful consideration. Every investor or trader must conduct their own due diligence and take into account their unique financial situation, risk tolerance, and investment objectives before making any decisions. Remember, investing in the stock market carries risk, and it’s crucial to make informed decisions.
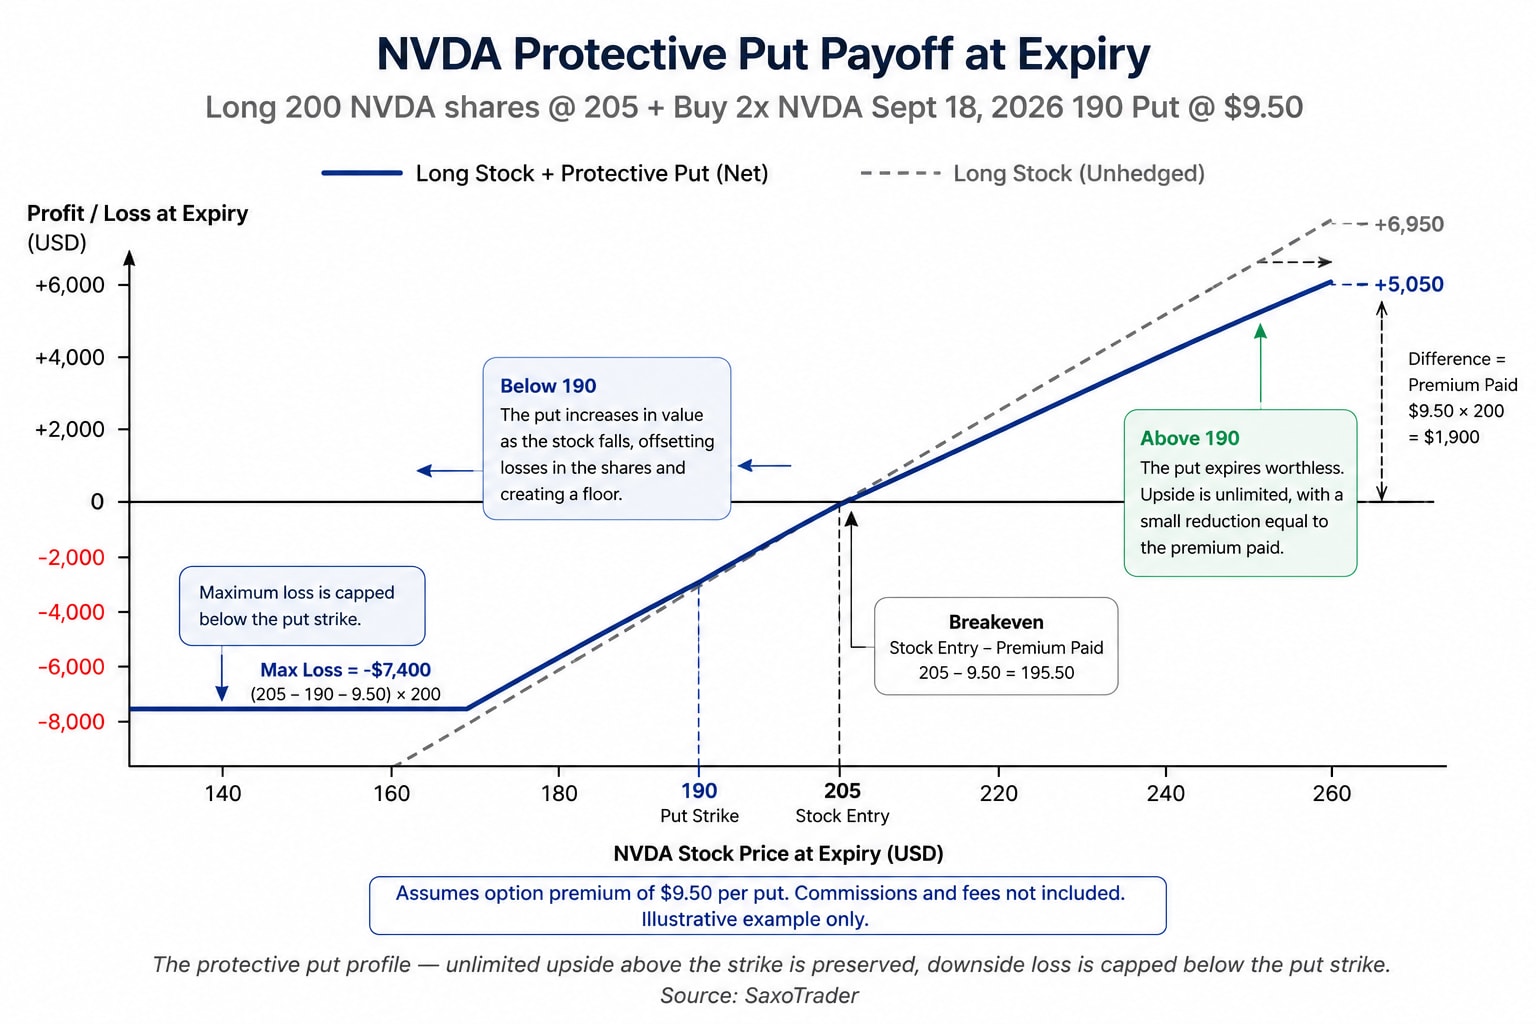
The simplest way to add a floor to a position is a protective put. Buying a put option gives Thomas the right – but not the obligation – to sell his shares at a specified price (the strike) before the expiry date. If the stock falls below that strike, the put gains value and offsets some or all of the decline in the shares. Above the strike at expiry, the put expires worthless.
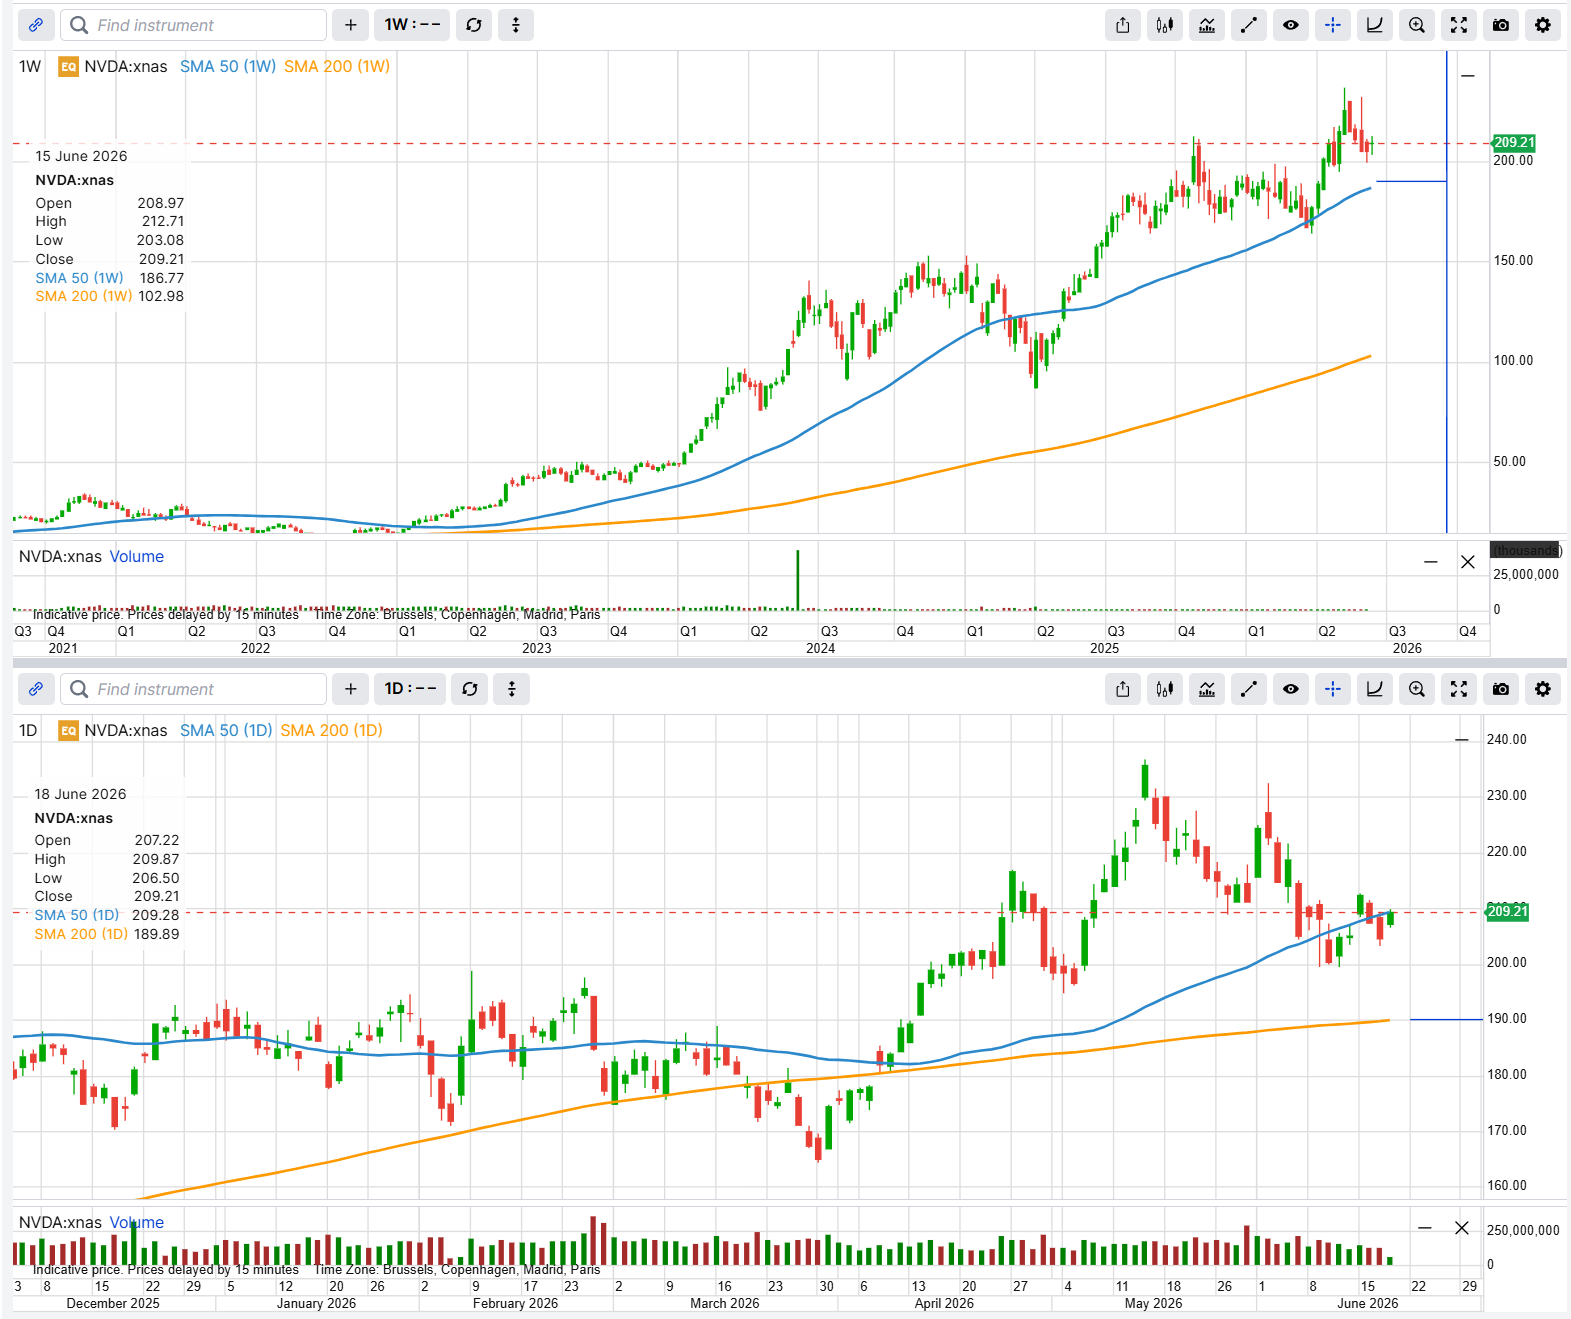
Thomas starts with his largest and most volatile holding: NVDA, which closed at approximately USD 209 on 18 June 2026 (Source: SaxoTrader as of 18 June 2026). For the illustrative example below, a round entry price of USD 205 is used – consistent with the payoff diagrams provided – with the 190 put strike sitting roughly 7–8% below that level.
The most relevant Greek here is delta: the 190 put gains approximately USD 0.40–0.50 for every USD 1 NVDA falls below the strike. This provides a meaningful but partial offset to the decline in the shares.
Thomas likes the protective put concept but finds the premium steep – especially across multiple positions. The collar addresses this directly. And at current NVDA prices, it goes one step further: Thomas does not just reduce the cost of the hedge, he gets paid to put it on.
A collar adds one leg to the protective put: Thomas sells a covered call at a higher strike, collecting a premium that offsets the cost of the put. At current market prices, the 225 call generates more premium than the 190 put costs – making this a credit collar. Thomas receives USD 3.65 per share upfront (USD 730 for his 200-share position) simply for agreeing to cap his upside at USD 225 through September.
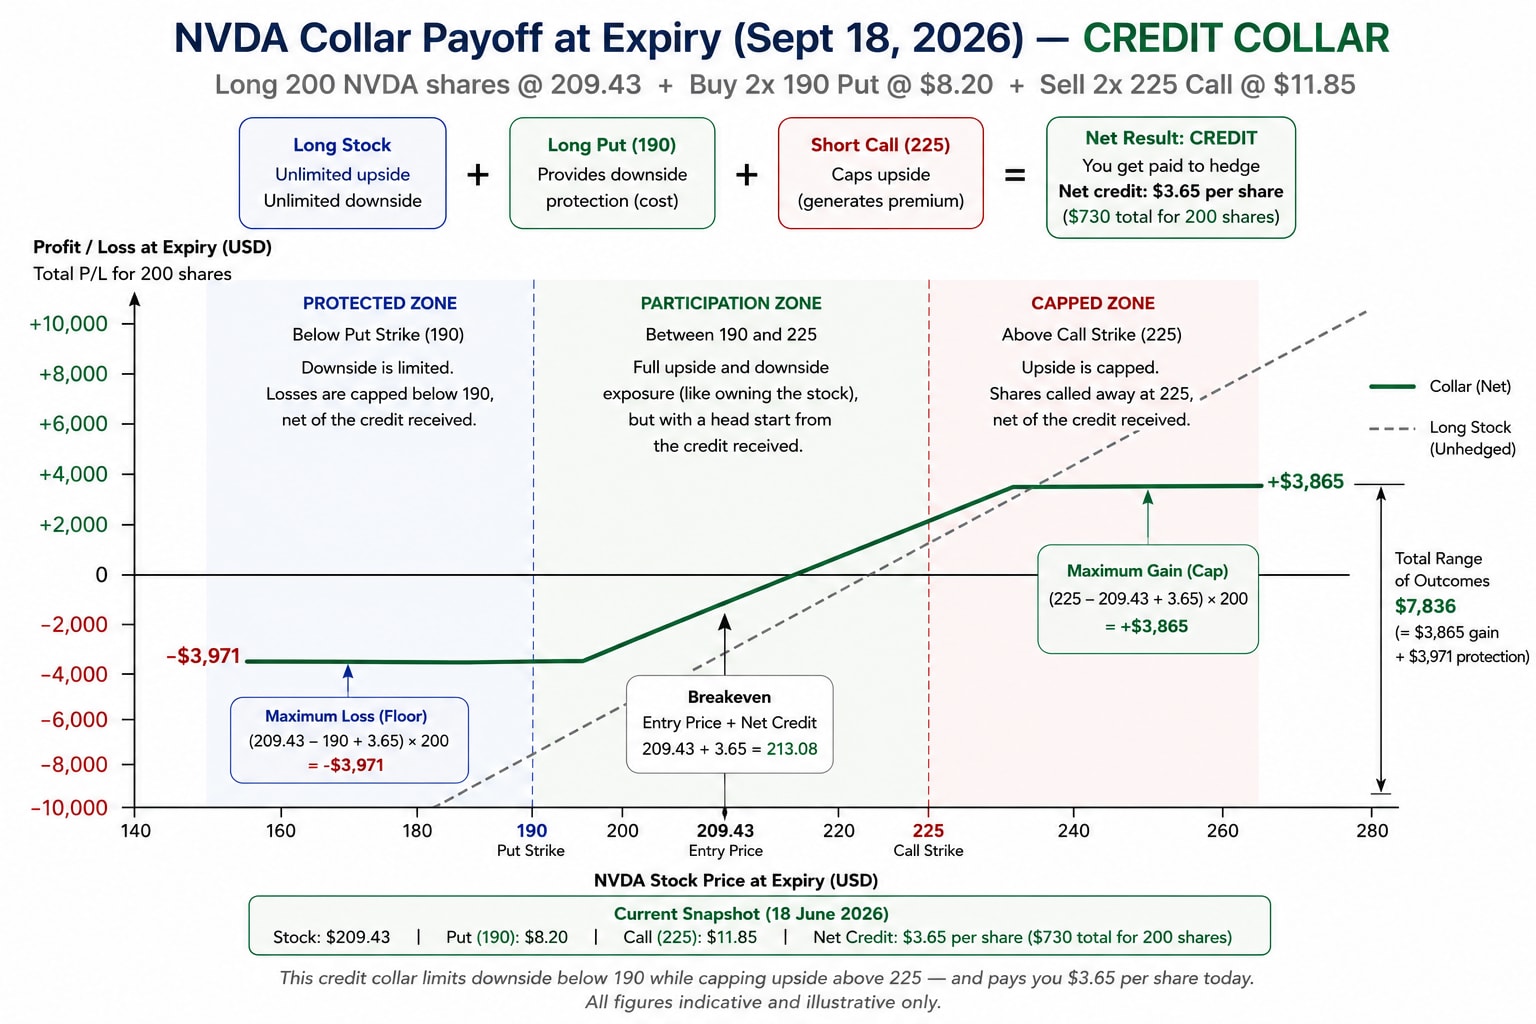
The result is better than a zero-cost hedge – Thomas receives USD 730 to establish it. He retains full participation in NVDA between USD 190 and USD 225, with the credit giving him a head start in the participation zone. The trade-off is real: gains above USD 225 are capped, and the retained downside risk below USD 190 – though limited – remains meaningful.
Strategy insight – the credit collar (illustrative only – not a trade recommendation). When the call strike generates more premium than the put costs, the collar becomes a credit collar – the investor may receive a net credit to establish the hedge, though this depends on prevailing market conditions and is not guaranteed. This strategy carries defined risk: if NVDA falls below USD 190 at expiry, losses on the shares below that level are not fully offset by the put, and the maximum loss on the combined position remains meaningful (as illustrated, approximately USD 3,971). For many buy-and-hold investors, capping near-term upside may be an acceptable trade-off – individual circumstances and risk tolerance vary. Delta measures the directional sensitivity of each leg; the collar can be adjusted or closed before expiry if the view changes. The short call carries assignment risk if it moves in the money – monitor short options as expiry approaches.
Running collars on five separate positions – AAPL near USD 299, MSFT near USD 391 (Source: SaxoTrader as of 18 June 2026), AMZN, META – quickly becomes unwieldy: different strikes, different premiums, different expiry mechanics on every name.
Thomas then notices that his portfolio moves almost in lockstep with QQQ (the Invesco Nasdaq 100 ETF), trading near USD 732 (Source: SaxoTrader as of 18 June 2026). The 12-month correlation between his portfolio and QQQ is approximately 0.93 (R² = 0.86) – illustrated in the chart below, which shows both series indexed to 100 from June 2025. Rather than hedging each position individually, a single QQQ put position could cover the whole basket.
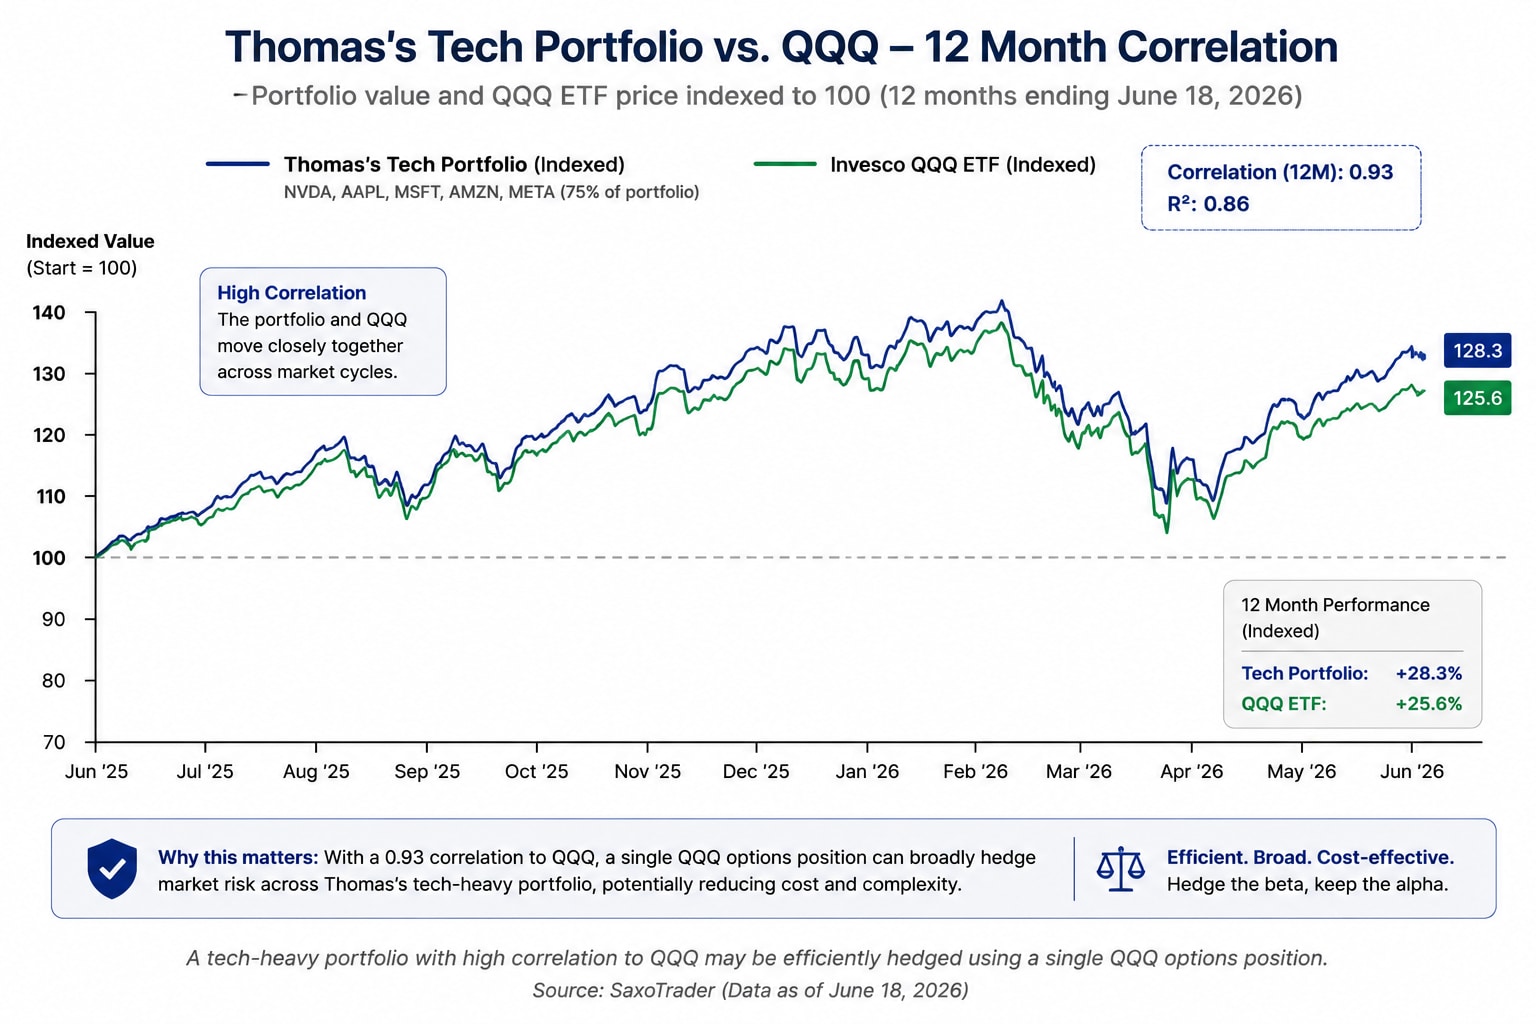 A tech-heavy portfolio with a 0.93 correlation to QQQ may be efficiently hedged using a single QQQ options position. All data illustrative. Source: SaxoTrader (Data as of 18 June 2026)
With the VIX near 16.4 – relatively subdued by historical standards (Source: CBOE as of 16 June 2026) – portfolio-level puts are, in our view, reasonably priced compared with elevated-volatility periods.
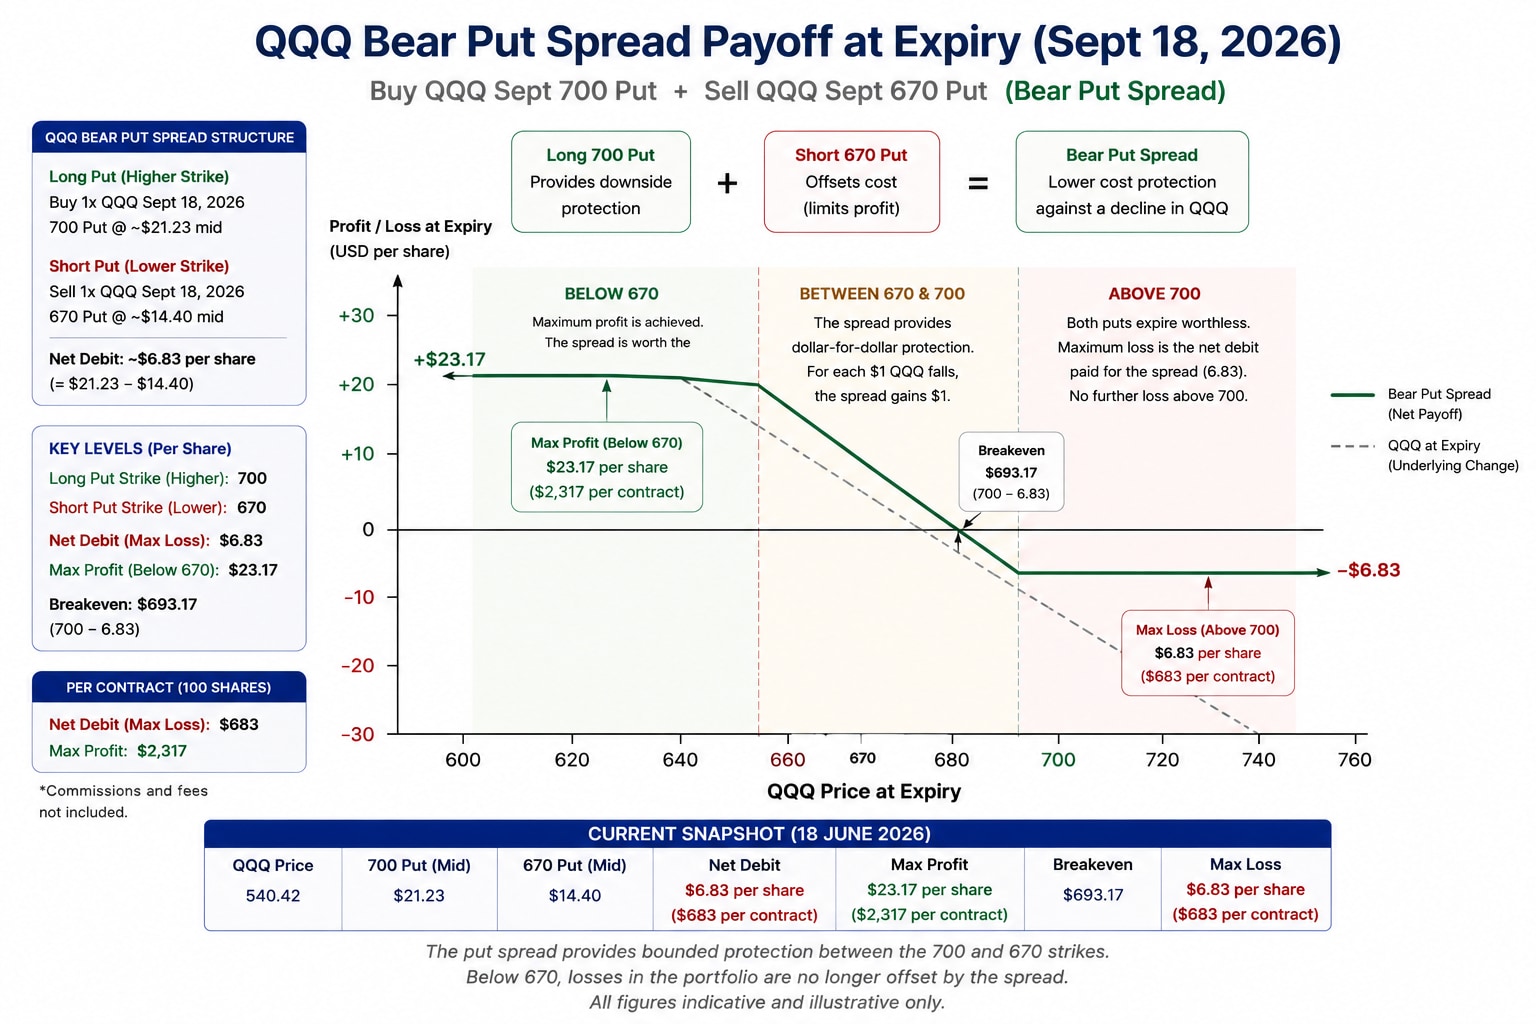 The put spread provides bounded protection between the 700 and 670 strikes. Below 670, losses in the portfolio are no longer offset by the spread. All figures indicative and illustrative only. Commissions and fees not included. Source: SaxoTrader
Strategy insight – efficiency versus basis risk (illustrative only – not a trade recommendation). One trade, simple execution, full basket covered. The trade-off is basis risk: Thomas’s portfolio is not QQQ. If NVDA falls 25% while QQQ drops only 10%, the hedge offsets less than expected. For portfolios with very high Nasdaq correlation – like Thomas’s – basis risk is usually manageable. For portfolios that diverge meaningfully from QQQ through sector concentration, smaller-cap exposure, or non-US holdings, individual position hedging may prove more precise.
Which approach fits which situation?
The protective put offers maximum flexibility and clean downside protection – at a cost. The collar goes further: at current NVDA prices, it generates a net credit, making it not just affordable but income-positive while still providing meaningful downside protection. The QQQ bear put spread offers portfolio-wide coverage in a single trade at modest cost, at the expense of some precision. None of these is universally superior; each reflects a different trade-off between cost, simplicity, and coverage accuracy.
Before placing the trade, check:
Assignment risk note: Because NVDA and QQQ options are American-style, short legs can be assigned before expiry if they move in the money – particularly close to expiration or around ex-dividend dates. As the buyer of a put, you face no assignment risk. Only the seller of an option carries assignment risk.
Options do not eliminate risk – they redistribute it. Thomas’s decision to hedge is not a market prediction. In the case of the credit collar, it is not even a cost – it is a decision to accept a ceiling on near-term upside in exchange for both a floor and a USD 730 credit in his account today.
These positions can also be managed before expiry. If NVDA rallies, Thomas may close the collar or roll it higher. If the market sells off and the put gains value, he can sell it before September to capture the benefit. The hedge is a tool to be managed, not set and forgotten – and for long-term investors, that active dimension may be the most useful thing options have to offer.
The author does not hold positions in any of the instruments mentioned in this article.
This content is marketing material and should not be regarded as investment advice. Trading financial instruments carries risks and historic performance is not a guarantee of future results.
The Author is permitted to wait at least 24 hours from the time of the publication before they trade the instruments themselves.
The instrument(s) referenced in this content may be issued by a partner, from whom Saxo receives promotional fees, payment or retrocessions. While Saxo may receive compensation from these partnerships, all content is created with the aim of providing clients with valuable information and options.
This content will not be changed or subject to review after publication.
| Related articles/content |
|---|
| What is a cash-secured put Using Oracles post-earnings pullback as an example | 12 Jun 2026 What investors misunderstand about covered calls | 10 Jun 2026 Covered call or cash-secured put | 2 Jun 2026 From shareholder to options user | 26 May 2026 Micron before earnings - using a covered call after a strong rally | 29 May 2026 Alphabet after earnings - how a covered call can help investors manage a strong rally | 30 Apr 2026 Tesla shares after earnings could a covered call make sense | 27 Apr 2026 A structured way to buy IWDA at a lower price using options | 20 Mar 2026 How to improve the yield on a long-term IWDA holdings | 12 Mar 2026 How to use a collar to protect stock gains - a Tesla case study | 20 Feb 2026 Palantir after earnings - using options to define a potential entry price | 4 Feb 2026 Golds pullback - thinking beyond buy or sell | 3 Feb 2026 Why options got so popular in recent years | 28 Jan 2026 |
| More from the author |
|---|
Outrageous Predictions
Chief Investment Strategist
Outrageous Predictions
Chief Investment Strategist
Outrageous Predictions
Chief Investment Strategist
Outrageous Predictions
Chief Investment Strategist
Outrageous Predictions
Global Head of Investment Strategy
Outrageous Predictions
Investor Content Strategist
Outrageous Predictions
Global Head of Macro Strategy
Outrageous Predictions
Global Head of Macro Strategy
Outrageous Predictions
Saxo Group
Outrageous Predictions
Global Head of Macro Strategy