Options Brief - The fear gauge already knows - 10 June 2026
Headline driver
US equities retreated on Tuesday as AI-sector profit-taking and reports of US military strikes on Iranian nuclear facilities compounded caution ahead of today’s May CPI release (source: exchange data / Bloomberg, 9 June 2026). The S&P 500 slipped 0.3%, the Nasdaq Composite fell 1.0% as AI-related names bore the brunt, while the Dow Jones Industrial Average edged 0.2% higher on defensive rotation. See the Saxo Market Quick Take – 10 June 2026 for the full macro picture.
Market snapshot
- S&P 500 closed at approximately 7,386, down 0.3%;
- Nasdaq Composite down 1.0%;
- Dow Jones Industrial Average closed at 50,877, up 0.2%
- VIX closed at 19.87, up 5.0%; front-month VIX futures at 20.85, up 9.7%; S&P 500 futures pre-market down 0.8%
- Market regime: Neutral / Chop – VIX 19.87, 20-day realised vol 12.9% (rising), S&P 500 +3.22% above its 50-day moving average
- Key event today: US May CPI at 08:30 ET (12:30 GMT); consensus expects readings that may push the year-on-year print above 4% for the first time in three years; FOMC meeting follows on 17–18 June 2026
(source: exchange data / Bloomberg, 9 June 2026)
Options flow sentiment
Based on end-of-day 9 June – yesterday’s positioning, not today’s price action.
Single-name flow remained net bullish in AI and semiconductor names — led by NVDA October call demand and TSM July upside — though notable MSFT put buying and TSLA/META hedges kept the overall picture closer to selective risk-taking than broad conviction.
Index and ETF flow leaned clearly defensive: consumer staples protection dominated (XLP September puts in size), broad equity index put openings outpaced calls, and metals and crypto saw meaningful downside hedging ahead of today’s CPI and next week’s FOMC.
Options angle: the VIX term structure and what it’s telling us
Illustrative only — not a trade recommendation.
Most traders track the VIX as a single number — the 30-day implied volatility reading for the S&P 500. But the VIX is really a curve, and right now that curve is telling a more nuanced story than the headline 19.87 suggests.
The spot index curve: event risk at the 9-day horizon
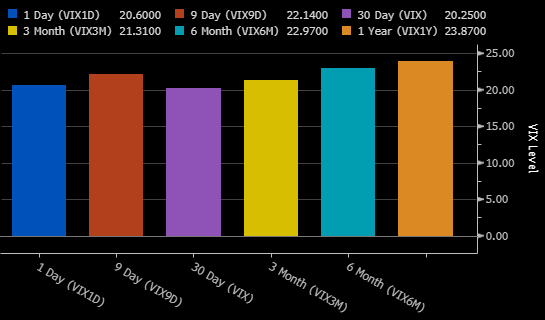 Short-term volatility expectations remain contained, with the VIX near 20. The upward-sloping volatility curve toward six- and twelve-month horizons suggests investors expect somewhat greater uncertainty over the longer term than in the coming weeks. Source: Bloomberg
 Looking at the CBOE’s spot volatility indices as of this morning, the curve is not flat (source: Bloomberg, 10 June 2026). VIX1D sits at 20.60, but VIX9D — the 9-day tenor — jumps to 22.14, the highest point on the short end of the curve. The 30-day VIX at 20.25 dips below both, before the curve resumes its upward slope: VIX3M at 21.31, VIX6M at 22.97, and VIX1Y at the long-end high of 23.87.
The hump at VIX9D is the key tell. A 9-day window measured from today (10 June) extends to approximately 19 June — fully capturing the FOMC meeting on 17–18 June. VIX9D at 22.14 sits 1.89 points above the 30-day VIX: a clean signal that the market is pricing FOMC event risk in the most relevant window rather than spreading fear more broadly. This is more information than the headline VIX alone can provide.
The futures curve: inversion, then a kink
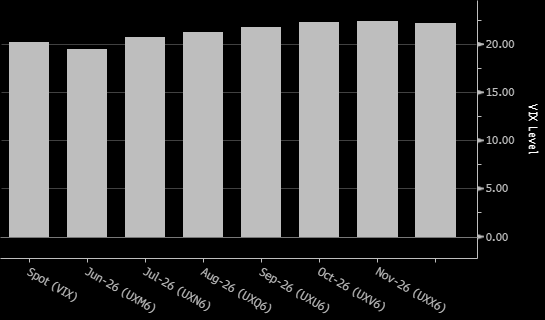 The VIX futures curve remains in contango, with longer-dated contracts trading above spot volatility. This typically reflects expectations of stable market conditions in the near term while maintaining a premium for future uncertainty and event risk. Source: Bloomberg
 The VIX futures curve adds another dimension (source: Bloomberg, 10 June 2026). The June contract (UXM6) sits at 17.81 — the lowest point on the curve, trading below spot VIX. The July contract (UXN6) jumps to 20.71, a step of approximately 3.3 points. From August onwards, the curve rises steadily into contango, reaching approximately 22.35 by November.
The June inversion exists for a structural reason: UXM6 expires on 18 June — the same day as the FOMC decision. The contract settles before any post-decision repricing can be captured, which explains why the market assigns it a lower risk premium. The July contract captures the full aftermath of the Fed’s statement and any subsequent market adjustment. The ~3.3-point June-to-July jump is the market’s explicit price of the post-FOMC tail risk.
SKEW: the fear gauge’s quieter companion
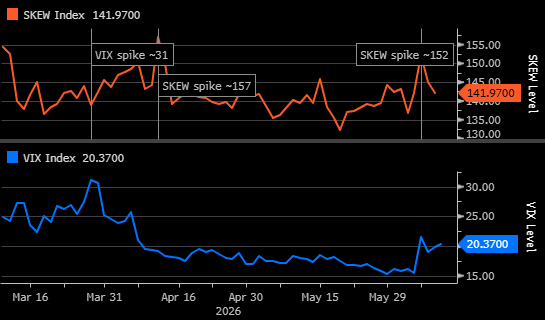 The SKEW Index remains elevated near 142 while the VIX sits around 20, suggesting investors continue to pay for downside protection even as headline volatility remains moderate. Recent SKEW spikes above 150 indicate persistent concern about low-probability market shocks. Source: Bloomberg
 The CBOE SKEW index — currently at 141.97 — measures a different kind of fear (source: Bloomberg, 10 June 2026). While VIX reflects at-the-money implied volatility, SKEW captures the relative pricing of out-of-the-money puts versus calls, measuring the implied probability of outlier S&P 500 moves. Readings above 130 are generally considered elevated.
Looking at the past three months, SKEW and VIX have followed a consistent inverse pattern. In mid-March, when VIX spiked to approximately 31, SKEW pulled back as broad-based fear replaced targeted tail hedging. As VIX compressed through April, SKEW surged to its 3-month high of approximately 157 as investors rotated into cheap out-of-the-money puts. In early June, SKEW re-elevated to approximately 152 even as VIX stayed near 20, pointing to renewed FOMC-related tail hedging demand. Today’s 141.97 remains elevated relative to post-April lows, consistent with residual FOMC hedging demand.
The current combination — moderate VIX near 20, elevated SKEW at 141.97 — is a classic “complacent on the base case, hedged for the shock” setup.
What this means for options thinking (illustrative)
Important note: All strategies carry significant risk; options trading can result in losses that exceed the initial premium paid.
The strategies and examples provided in this article are purely for educational purposes. They are intended to assist in shaping your thought process and should not be replicated or implemented without careful consideration. Every investor or trader must conduct their own due diligence and take into account their unique financial situation, risk tolerance, and investment objectives before making any decisions. Remember, investing in the stock market carries risk, and it’s crucial to make informed decisions.
The term structure offers three practical lenses:
- First, event risk is already priced: VIX9D at 22.14 and the June-July futures step of approximately 3.3 points both reflect FOMC uncertainty. Strategies designed to capture the event move should account for that premium already embedded in options pricing.
- Second, the June futures inversion suggests the market expects near-term vol to resolve. A benign CPI and neutral FOMC could see front-end vol compress materially — positive-theta strategies expiring around FOMC benefit in that scenario, though they carry meaningful risk if outcomes surprise.
- Third, elevated SKEW at 141.97 means out-of-the-money puts are relatively expensive: hedgers using OTM puts should account for the tail-risk premium currently embedded in put skew.
Conclusion
Today’s US May CPI at 08:30 ET (12:30 GMT) is the first real data point in the FOMC window. The vol curve has already done the math. VIX9D elevation, the June-July futures kink, and SKEW at 141.97 all describe a market that is not complacent — it is selectively positioned for specific outcomes. The central question is whether today’s CPI and next week’s FOMC deliver results that match the priced-in scenarios, or force a repricing in one direction or the other. The fear gauge already knows something. Today we find out if it was right.
