Outrageous Predictions
Carry trade unwind brings USD/JPY to 100 and Japan’s next asset bubble
Charu Chanana
Chief Investment Strategist
A Trump-driven Fed pivot crashes the carry trade, hurling USD/JPY to 100 and unleashing Japan’s wild...

Summary: Friday’s S&P 500 fell 2.64%. But VIX surged almost 40% on the same session - and that gap tells you everything about what happened beneath the surface. In today’s Options Brief, I look at the dealer gamma mechanics that turned a bad payrolls print and a Broadcom disappointment into a selloff that went further than fundamentals warranted.
When dealer gamma mechanics turn a macro selloff into a cascade – and what that means for Monday.
Friday’s 2.64% S&P 500 decline and 39.68% VIX spike were driven by a real macro catalyst, but in our view the options market amplified the move well beyond what fundamentals alone would have produced. This edition examines the dealer gamma mechanics behind Friday’s session, the market structure indicators that flagged the overshoot, and what the institutional bifurcation in options flow may mean for Monday’s open.
May payrolls printed at 172,000 on Friday, more than double the 80,000 consensus, pushing Treasury yields sharply higher and reviving rate-hike fears. Broadcom’s failure to raise its AI chip outlook sent semiconductors sharply lower, erasing over $1 trillion in sector market value. The Monday setup carries an added complication: Iran launched ballistic missiles at Israel overnight Sunday, breaking a fragile ceasefire and sending oil more than 4% higher in Asian trading while South Korea’s KOSPI triggered a circuit breaker at -8.4%.
The S&P 500 closed Friday at 7,383.74 (-2.64%), the Nasdaq 100 fell 4.77% to 28,957.60, and the Russell 2000 dropped 3.47%. The Dow Jones Industrial Average closed at 50,872 (-1.35%). The 10-year Treasury yield ended at 4.576%. Heading into Monday’s session, WTI crude is up 4.42% to $94.54 on the Iran escalation, while S&P 500 futures point to a 0.16% additional decline and Nasdaq 100 futures indicate a 0.10% further drop, a notable divergence from the KOSPI’s 8.4% circuit-breaker collapse.
Market regime: Neutral/Chop – VIX 21.51 (Friday close), 20-day realised vol 13.2% (increasing), S&P 500 +3.18% above its 50-day moving average.
Based on end-of-day 5 June 2026 – yesterday’s positioning, not today’s price action.
Single-name confirmed-opening flow leaned selectively constructive in mega-cap technology, with upside structures in leading semiconductor names suggesting a portion of institutional money was positioning for recovery rather than bracing for further capitulation. Index and broad equity ETF put demand was heavy and clustered around upcoming inflation data and the June Federal Reserve meeting window, while cross-asset hedging in precious metals, credit, and energy reinforced a read of systematic portfolio risk reduction rather than outright directional selling.
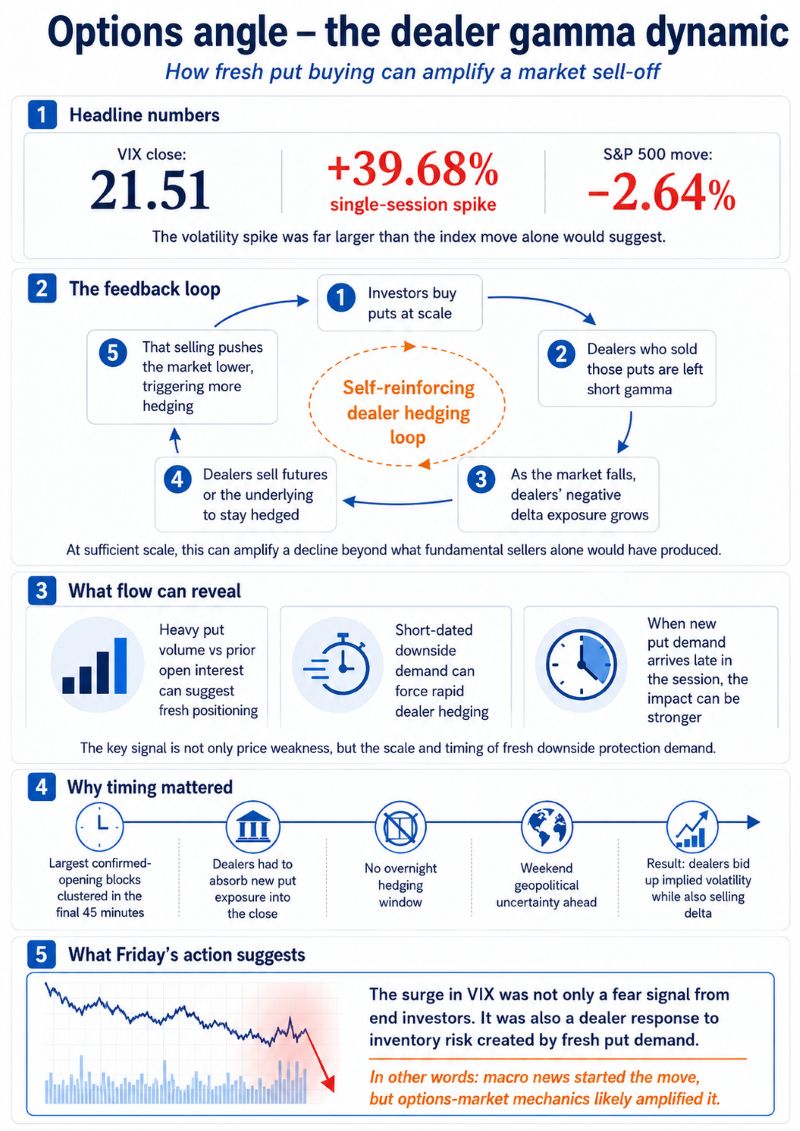
VIX closed Friday at 21.51, a 39.68% single-session spike. That kind of move does not emerge from news-driven selling alone. To understand why Friday was as severe as it was, the options market mechanics are worth examining in some detail.
When market participants buy puts at scale, the dealers who sell those contracts are left short gamma. As the underlying falls, their negative delta exposure grows, forcing them to sell futures or the underlying asset to stay hedged. That selling pushes the market lower, which triggers more hedging, which pushes it lower again. At sufficient scale, this feedback loop can significantly amplify a move that fundamental sellers alone would not have driven as far.
Friday’s flow data shows this dynamic at work. The most revealing figures are not the index closing levels but the relationship between single-session contract volume and prior open interest on key short-dated index ETF puts.
In one S&P 500 ETF expiry sitting directly on the date of Wednesday’s May CPI release, daily put volume reached more than 83,000 contracts against standing open interest of just 1,356. Since daily volume at that level can only be sustained if a substantial proportion of it represents new positions being opened, virtually all of that activity was fresh institutional demand. In short-dated Nasdaq 100 ETF puts capturing the Federal Reserve meeting window, volumes of roughly 37,000 and 33,000 contracts printed against prior open interest of 31,557 and 30,676 respectively. In the small-cap ETF, a single put cluster printed 66,647 contracts against prior open interest of 13,069.
These are not hedge rolls or adjustments to existing positions. They represent fresh put demand landing on dealers who had no choice but to immediately sell index futures to manage the resulting delta exposure. Into a session already soft on the jobs number and the Broadcom disappointment, that additional selling pressure compounded the move in a way that a purely macro-driven day would not have.
The timing amplified the effect further. The largest confirmed-opening blocks clustered in the final 45 minutes of the session. Dealers absorbing that put paper into the close, with no overnight hedging window and a full weekend of geopolitical uncertainty ahead, had to bid up implied volatility sharply while simultaneously selling delta. That is a significant reason why VIX rose 39.68% on a session where the S&P 500 itself moved 2.64%: the implied-volatility bid was partly a dealer response to their own inventory risk, not solely a fear signal from end investors.
Fresh put demand can do more than signal investor fear. When dealers are left short gamma, their hedging activity can reinforce selling pressure, helping explain why volatility may rise faster than the underlying market falls. - Source: Saxo
Three readings from Friday illustrate how structurally unusual the session was.
SKEW closed at 152.25, up 7.11% on the day. The CBOE SKEW index measures the relative cost of out-of-the-money downside protection versus at-the-money options. A normal reading sits in the 110–120 range; readings above 140 are materially elevated. At 152.25, the market was pricing severe left-tail risk at a level consistent with genuine institutional concern about a disorderly move, not routine end-of-week hedging.
VVIX, the volatility-of-volatility index, closed at 102.04, up 19% on the session. When VVIX trades above 100, options on the VIX itself are expensive, meaning the market is not only positioned defensively but is uncertain about how defensive it may need to become. A reading at this level reflects second-order fear: uncertainty about the uncertainty itself.
Three-month implied correlation (COR3M) rose 38.51% to 12.23. When implied correlation spikes, individual stocks are expected to move as a bloc rather than on their own fundamentals. That is the signature of a systematic risk-off event, not a sector-specific repricing. It confirms that dealers were pricing market-wide risk, not isolated weakness in semiconductors.
Put/call ratios across equity indices and single names spiked 20–30% during the session, with the equity put/call ratio reaching 0.841 and the index put/call ratio reaching 1.31. Historically, readings at these levels have been more frequently associated with short-term selling exhaustion than with the beginning of sustained downtrends, though they are sentiment indicators and require price confirmation before they carry any directional weight.
One aspect of Friday that the headline numbers do not capture is that the same session generating all of the above also saw substantial confirmed-opening upside call positioning in leading semiconductor names. Tens of thousands of call contracts opened in structured upside packages in NVDA and TSM, consistent with longer-dated recovery positioning by portfolio-level investors, not short-term speculation. Defensive-sector ETFs saw call demand alongside the broader market put activity.
Pure capitulation is one-directional. What Friday’s flow shows instead is institutional bifurcation: the risk management desk hedging aggressively into the weekend while the portfolio management desk was adding upside convexity at lower prices, the two running simultaneously.
In our view, that pattern is meaningful for the Monday question. A genuine fundamental re-rating of growth expectations, where investors are abandoning positions outright, does not produce this kind of two-sided institutional activity. A mechanically amplified selloff, where the initial catalyst is real but dealer gamma mechanics extend the move beyond where fundamentals alone would clear, more often does. Mechanically amplified selloffs have historically tended to overshoot the fundamental clearing level, though past patterns are not a reliable guide to future outcomes and this is not a prediction of a rebound.
That distinction carries some weight when interpreting the contrarian signals now present: the inverted VIX term structure, the put/call extremes, and front-month VIX futures sitting at 19.51, well below the spot VIX of 21.51. These are not buy signals. They are evidence that the options market’s own mechanics contributed materially to Friday’s severity, which in turn suggests the fundamental case for lower prices may have been overpriced during Friday’s close.
Friday’s selloff was driven by a real macro catalyst, but in our view the options market amplified the move well beyond what fundamentals alone would have produced. The dealer gamma dynamic, the late-session institutional put clustering, and the extreme readings in SKEW, VVIX, and implied correlation all point to a session that mechanically overshot. Whether that overshoot corrects today depends on two variables that were not present on Friday: the Iran geopolitical premium, which has added fresh risk, and the absence of fresh systematic put demand at the open, which would be the signal that the cascade is resuming rather than exhausted. Market outcomes are inherently uncertain and today’s first hour carries significant informational weight.
| More from the author |
|---|
Outrageous Predictions
Chief Investment Strategist
Outrageous Predictions
Chief Investment Strategist
Outrageous Predictions
Chief Investment Strategist
Outrageous Predictions
Chief Investment Strategist
Outrageous Predictions
Global Head of Investment Strategy
Outrageous Predictions
Investor Content Strategist
Outrageous Predictions
Global Head of Macro Strategy
Outrageous Predictions
Global Head of Macro Strategy
Outrageous Predictions
Saxo Group
Outrageous Predictions
Global Head of Macro Strategy