
Access all our platforms from a single account.

Crypto’s late-summer run: where bitcoin and ethereum stand, and what comes next

Summary: Bitcoin has recovered roughly 37% and ethereum roughly 46% since mid-August, lifting the total digital asset market back above USD 3 trillion for the first time since January. Here is what drove the move, where the key levels now sit, and which hurdles could interrupt it.
A five-week recovery has repaired most of this year’s damage in the two largest digital assets. Whether it extends now depends less on crypto and more on Washington and the macro backdrop.
For investors who hold digital assets, or who follow them as a read on risk appetite, the past five weeks have been the most constructive stretch of 2026. After a long grind lower and persistent fund outflows through the first half of the year, bitcoin and ethereum have both rallied hard since mid-August. The total digital asset market capitalisation reclaimed USD 3 trillion for the first time since January, adding more than USD 740 billion in value over the period (Source: Bloomberg, 22 September 2026).
What makes this move worth a closer look is not its size but its composition. Rallies in this asset class are often retail-led and leverage-driven, and they tend to fade as quickly as they arrive. This one has been accompanied by sustained buying through regulated US spot exchange-traded funds, which in our view is a different signal to a short squeeze alone. Both elements are present, and separating them matters for anyone trying to judge how durable the move is.
Where the two majors stand
Bitcoin has recovered roughly 37% from its mid-August low and ethereum roughly 46%, with both setting their highest prints of the cycle on 21 September before easing back and consolidating just below those levels (Source: Bloomberg, 23 September 2026).
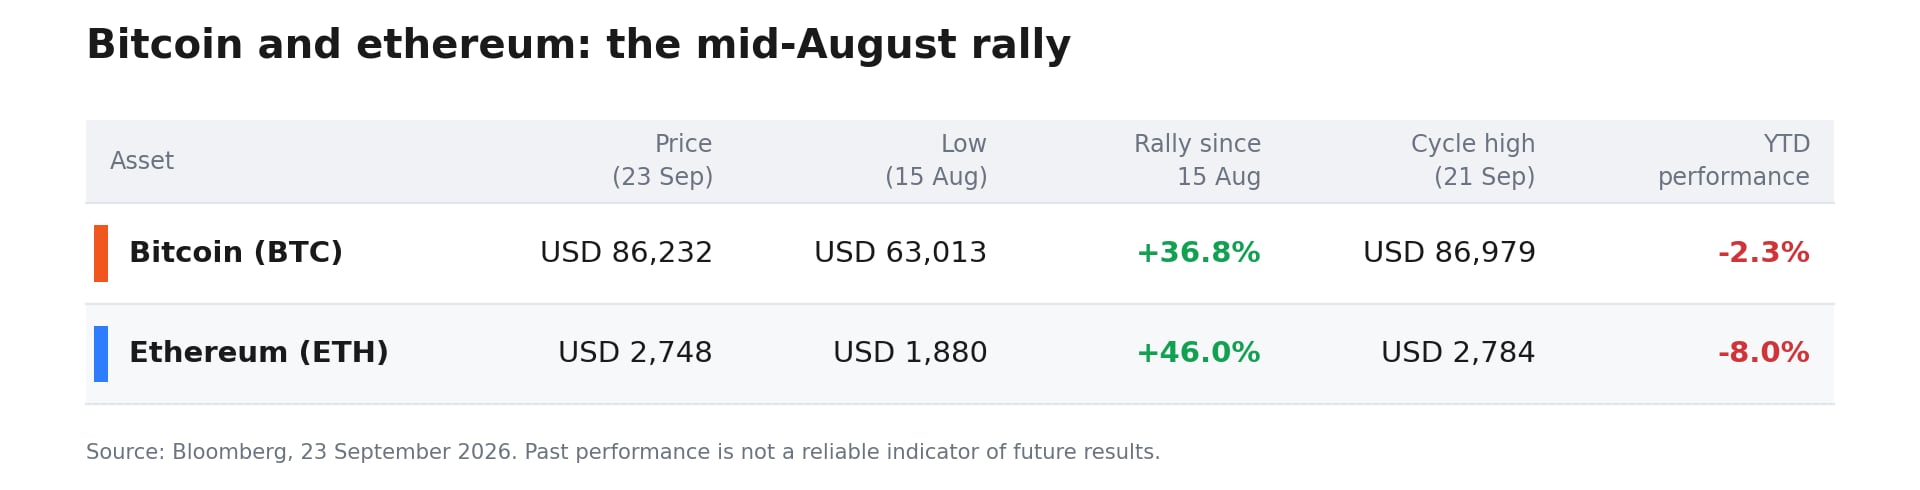 Bitcoin and ethereum: the mid-August rally in numbers. Source: Bloomberg, 23 September 2026. Past performance is not indicative of future results.
One line in that table deserves a note, because it tends to surprise people. Despite gains of that size, both assets remain negative for the year to date. A 37% advance has not been enough to get bitcoin back to where it started January, which is a useful measure of how deep the earlier drawdown was.
Widening the lens makes the point more forcefully. Bitcoin set its all-time high above USD 125,000 in October 2025 and spent most of the following year grinding lower, with its deepest levels in June 2026 and a second, higher low in mid-August (Source: Bloomberg, 23 September 2026). Even after a 37% recovery from that August low it trades roughly a third below the peak, and ethereum sits more than 40% below its own 2025 high. This is a rally off a deep low rather than a continuation of the last bull market, which is a different proposition for anyone deciding whether they have missed the move.
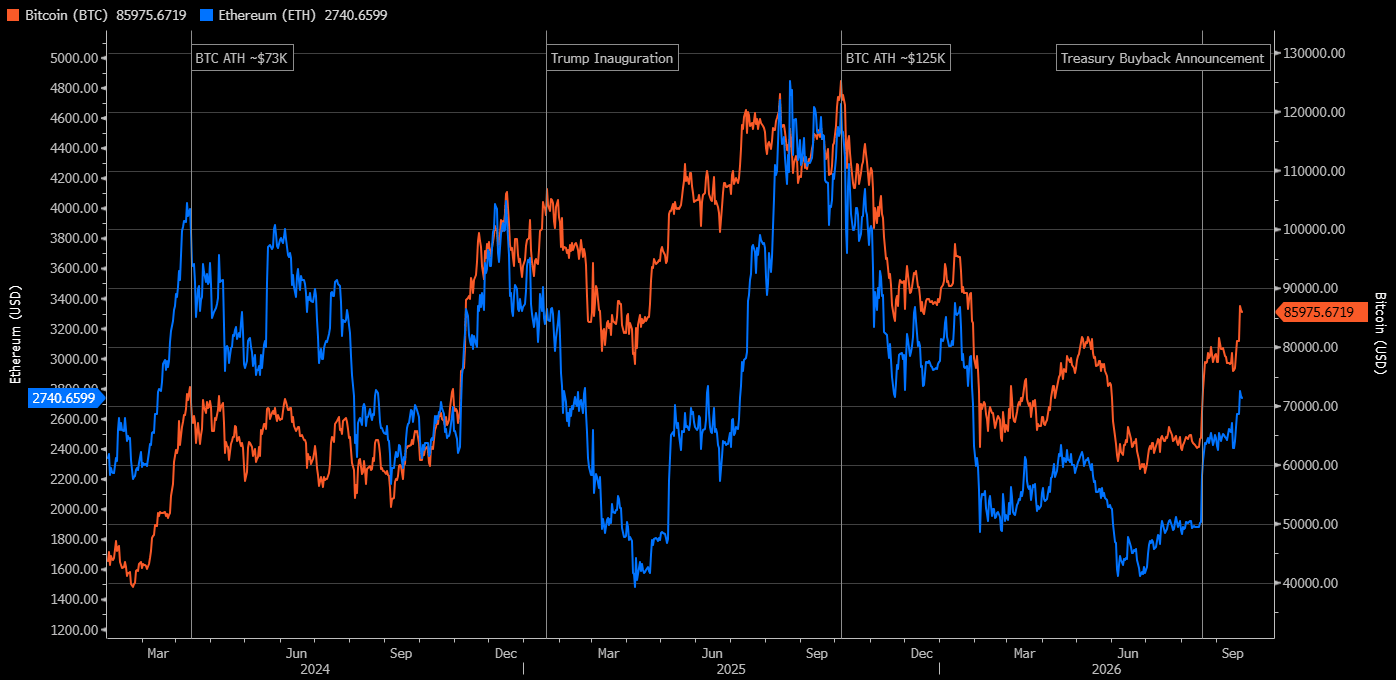 Bitcoin and ethereum daily prices, January 2024 to September 2026. The August 2026 recovery begins from a level well below the 2025 peak. Source: Bloomberg. Past performance is not indicative of future results.
The chart also dates the turn. The current leg higher starts within days of the Treasury buyback announcement, which in our view is the clearest visual evidence that this move began as a macro trade rather than a crypto-specific one.
The levels investors appear to be watching:
- Bitcoin. The 21 September high near USD 86,979 is the immediate resistance. A sustained break above it would open the path toward the USD 90,000 area. On the downside, the USD 76,000 to USD 77,000 zone held during the mid-September pullback and is the first meaningful support.
- Ethereum. The USD 2,784 high is the near-term ceiling, with the round USD 3,000 level the next point of reference above it. Support sits in the USD 2,400 to USD 2,450 region.
Round numbers carry no predictive power on their own. They matter because a large number of participants place orders and stops around them, which can make price behaviour near those levels more volatile than elsewhere.
Source: Bloomberg, 23 September 2026. Past performance is not indicative of future results.
What drove the move
- The debasement trade came back. The clearest catalyst was fiscal rather than crypto-specific. On 19 August the US Treasury said it would at least double its buybacks of long-dated bonds (Source: Bloomberg, 25 August 2026). That revived the argument that accommodative fiscal and monetary policy erodes the purchasing power of currency over time, which has historically supported demand for assets with fixed or predictable supply. Bitcoin posted its strongest week since 2023 in the seven days to 21 August, gaining around 23%, with ethereum, XRP and dogecoin each advancing more than 25% over the same stretch (Source: Bloomberg, 21 August 2026).
- Regulated fund demand followed. US spot bitcoin ETFs have absorbed roughly USD 4.6 billion of net inflows since 19 August, enough to flip the group to positive for the calendar year after heavy earlier redemptions (Source: Bloomberg, 23 September 2026). On 21 September alone, the session bitcoin set its cycle high, the group took in close to USD 1 billion (Source: Bloomberg, 22 September 2026). This is the part of the move that separates it from a purely speculative episode, and it is why the ETF flow data has become the most watched confirmation signal in the asset class.
- Leverage amplified it. Some of the 21 September surge was mechanical. As bitcoin cleared USD 85,000 for the first time in eight months, more than USD 400 million of leveraged short positions were liquidated within roughly four hours (Source: Bloomberg, 21 September 2026). Forced buying of that kind exaggerates a move that is already under way. It does not create the underlying trend, but it does mean a portion of the advance reflects positioning rather than fresh conviction.
- Supply was tight going in. Long-term holders controlled about 83% of bitcoin’s circulating supply in August, the highest share since December 2023 (Source: Bloomberg, 20 August 2026). When most of the supply sits with holders who have historically been reluctant to sell, the float available to meet new demand is smaller, and each unit of buying tends to have a larger price effect. That is a structural condition rather than a catalyst, and it helps explain why the move was as sharp as it was.
- Policy hopes did the rest. A White House digital asset summit in mid-August and speculation around the CLARITY Act, legislation that would designate the CFTC as the primary regulator for the sector, both added to the tone through late August and early September (Source: Bloomberg, 14 September 2026).
What the IBIT flows show
The iShares Bitcoin Trust (IBIT), the largest US spot bitcoin ETF, gives a reasonably clean read on institutional participation because its flows are disclosed daily. The fund held approximately USD 68.3 billion in assets and had attracted around USD 3.76 billion of net inflows since 15 August, with the single largest day, roughly USD 503 million, landing on 20 August, the session after the Treasury buyback announcement (Source: Bloomberg and Bloomberg BQL fund flow data, 23 September 2026). The shares traded near USD 48.83. Costs and charges apply to ETF trades; see Saxo pricing for full details.
The outflow days are as informative as the inflows. The two largest, approximately USD 162 million on 15 September and USD 144 million on 16 September, coincided with the failed Senate procedural vote on the CLARITY Act. Allocators appear to be treating the regulatory timetable as a live input rather than background noise.
Source: Bloomberg, 23 September 2026. Past performance is not indicative of future results.
The hurdles from here
- Legislation has stalled. The CLARITY Act (H.R. 3633) failed a Senate procedural vote on 15 September by 49 votes to 50, with several Republican senators voting against (Source: Bloomberg Government, 21 September 2026). Listed crypto-linked equities fell sharply on the day, with Coinbase down around 10% and Circle around 11% on the day (Source: Saxo, 15 September 2026). The bill is not dead, but with midterm elections approaching, the window for landmark legislation is narrowing. Regulatory uncertainty remains the sector’s most persistent overhang.
- Leverage is rebuilding. Open interest in bitcoin perpetual futures has climbed back toward levels last seen in July (Source: Bloomberg, 22 September 2026). That cuts both ways. It can accelerate a continuation, and it can accelerate a reversal just as effectively. Investors should expect two-way volatility to stay elevated rather than normalise as prices rise.
- A large holder could become a seller. JPMorgan has flagged that Strategy Inc.’s practice of selectively selling bitcoin to fund preferred-stock dividends introduces a new source of two-way flow risk, given the size of its holdings (Source: Bloomberg, 2 July 2026). One of the market’s most visible buyers is no longer only a buyer.
- The macro link is the whole thesis. Because the trigger for this move was fiscal policy rather than anything internal to the asset class, the rally is tied to the debasement narrative staying intact. Firmer inflation data, a more hawkish Federal Reserve, or a reversal in long-end yields could remove that support quickly.
- The chart is stretched. Bitcoin is pressing against multi-month resistance after a near-vertical advance, and momentum indicators reached extended readings during the initial surge (Source: Bloomberg, 24 August 2026). Consolidation, or a retest of the support zones noted above, would be an unremarkable development rather than a warning sign.
Final thoughts
The move since mid-August has been genuine in the sense that it is backed by measurable, disclosed fund flows rather than sentiment alone. It is also incomplete, in that both majors remain below where they started the year and the legislative framework the industry has been waiting for has not arrived. Those two facts sit alongside each other, and in our view an investor is better served holding both in mind than picking one. Past performance is not indicative of future results.
For anyone looking at this through an exchange-traded fund such as IBIT, the practical question is how to size and manage exposure to an asset that can move 20% in a week in either direction. That is the subject of a follow-up piece, which will look at IBIT’s listed options market and how investors with a view on the crypto recovery, bullish or cautious, may express it with defined risk. Options carry a high risk of rapid loss and are not suitable for every investor. See Saxo pricing for costs and applicable charges.
| Educational Resources |
|---|
| More from the author |
|---|