
Access all our platforms from a single account.

Vote premium drains from the front - Options Brief - 5 November 2026

Summary: One session after the vote, the one-day volatility gauge had halved and the curve sat the right way up. So why is protection against a sharp fall still priced near 150 on SKEW?
The one-day volatility gauge fell by almost half once the vote was settled, and it now sits at the bottom of a curve that climbs steadily out to one year.
MARKET REGIME: TRANSITIONING | VIX 16.61 | TERM STRUCTURE: CONTANGO | SKEW: ELEVATED (150.90) | FRONT-MONTH VIX FUTURES: 17.900
Today in brief
In our view the election premium came out of the options market in one session. The one-day volatility gauge fell 47.98% to 12.08 on Wednesday and the VIX 20.26% to 16.61, while the one-year gauge eased only 4.46%, so each tenor of the curve now sits above the one before it. Options price about 0.55% for today’s S&P 500 expiry and 0.87% for Friday’s, a window that holds today’s Bank of England decision and Friday’s payrolls.
In our view the Friday figure may show how much came out. The same expiry priced 1.68% a day earlier, and time decay alone would have left about 1.37%. Implied correlation, a gauge of how closely stocks are expected to move together, fell by about a quarter from a store high, and the typical single name’s volatility rank dropped to 37.0 from 42.7.
In our view the reading that may cut the other way is the tail. SKEW, which tracks the price of protection against a sharp fall, held near 150 while the VIX fell a fifth, and Nvidia’s rank barely moved after the stock fell 3.17% on regulation concerns. That may suggest a market that stopped paying for the vote but not for the chip debate.
The S&P 500 rose 1.58% to 7,688.62, using 78% of the week’s priced band to the upside with two sessions left, and the Dow gained 3.03%. Gold has gone through its band. Novo Nordisk closed the season’s earnings board at about 0.8 times its priced move, and Wednesday’s flow showed no readable direction in single names. Past performance is not indicative of future results.
That is the whole brief in one read. The sections below hold the detail behind each paragraph, with the charts, the full set of readings and the sources, for when you want to go deeper on one part.
Headline driver
Democrats won control of both the House and the Senate, and Wednesday’s session was the first full one to trade the result. US stocks and Treasuries rallied while oil and the dollar fell. The Dow Jones Industrial Average gained 3.03%, the S&P 500 1.58% and the Nasdaq 100 0.91%.
The rally was uneven. Microsoft rose 6.68%, Amazon 6.12% and Apple 5.31%, while Nvidia fell 3.17% on concern about tighter AI regulation and energy shares slid with crude. Overnight the Kospi fell 4.41% by 05:00 CET as Korean chipmakers sold off. Today brings the Bank of England decision at 13:00 CET, with payrolls on Friday.
Market snapshot
- US (Wednesday 4 November close): S&P 500 7,688.62, up 1.58%. Nasdaq 100 28,437.17, up 0.91%. Dow Jones Industrial Average 53,361.33, up 3.03%. The equal-weighted S&P 500 rose 1.86%. The consumer discretionary fund gained 4.26% and financials 3.51%, while energy fell 4.74%, the semiconductor fund 2.75% and the technology fund closed flat.
- Europe: the Stoxx 600 rose 1.82% to 657.41, the DAX 2.22% to 26,437.67 and the CAC 40 1.96% to 8,177.89. Euro Stoxx 50 futures traded 0.25% above their settlement at 05:00 CET.
- Asia (Thursday morning): the Kospi fell 4.41% to 5,433.31 by 05:00 CET and the Nikkei about 1.9%, while the Hang Seng rose 3.09% to 24,659.03.
- Commodities and rates: Brent trades at 93.66 and WTI at 86.85. Gold futures rose to 4,149.50 and silver to 53.20, and the gold miners fund jumped 9.01%. The two-year Treasury yield trades near 4.55% and the ten-year near 4.84%, both lower. Bitcoin trades near 80,500. S&P 500 futures sat 0.19% below their settlement and Nasdaq 100 futures 0.92% below.
- Market regime: transitioning, the VIX at 16.61, the curve in contango and SKEW elevated at 150.90.
Index levels and volatility readings from the watchlist export taken at 05:00 CET on 5 November 2026, which carries Wednesday’s US closes and overnight futures; the Nikkei and the election context from the same-morning Saxo Market Quick Take. Past performance is not indicative of future results. Source: Saxo, Bloomberg, CBOE.
Volatility surface
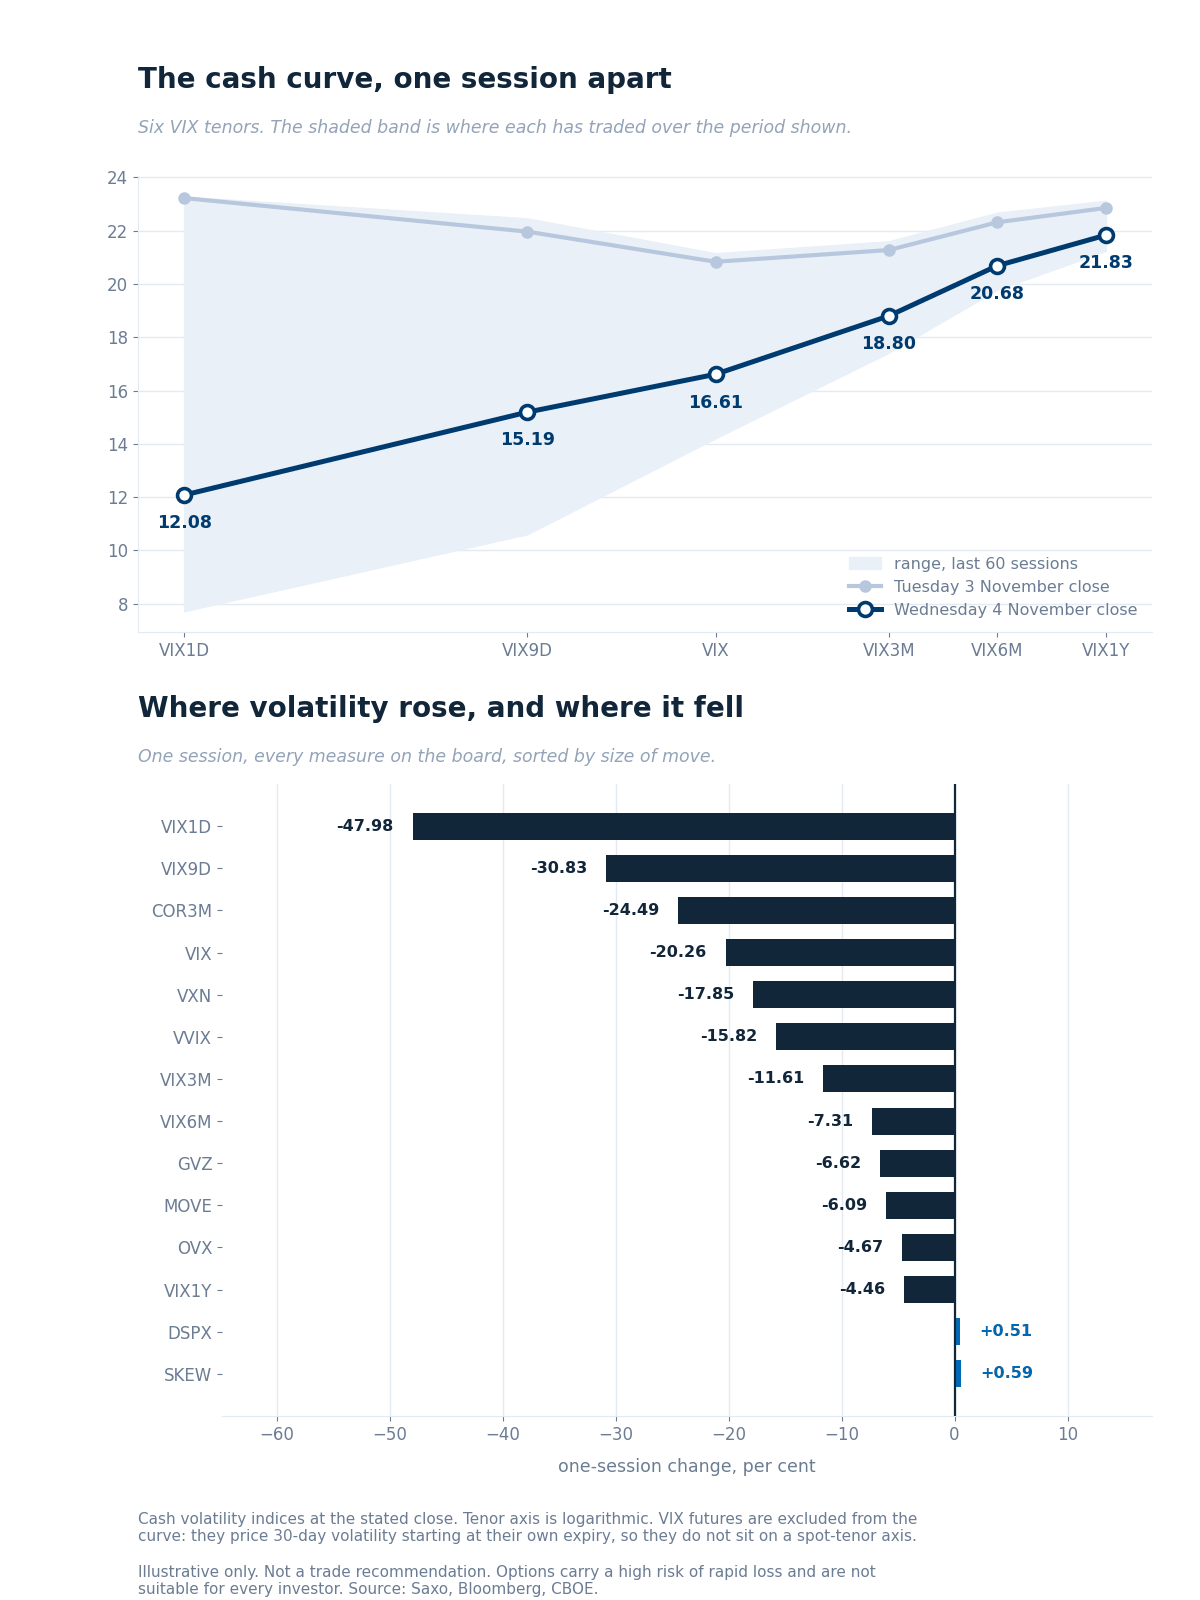
The cash curve at Wednesday’s close against Tuesday’s, over each tenor’s 60-session range, with the one-session change across every measure. Illustrative only. Past performance is not indicative of future results. Source: Saxo, Bloomberg, CBOE.
The curve turned the right way up, and the nearer the tenor, the further it fell. The one-day gauge dropped 47.98% to 12.08, the nine-day 30.83% to 15.19 and the VIX 20.26% to 16.61, while the three-month eased 11.61% to 18.80, the six-month 7.31% to 20.68 and the one-year only 4.46% to 21.83, so each tenor now sits above the one before it. For the VIX and the nine-day these are the largest one-session falls in our 103-session store. VIX futures stay off the chart, since each prices a month from its own expiry.
Ratios. The one-day gauge sits at 0.73 times the VIX, from 1.12 a day earlier. VIX3M/VIX rose to 1.13 from 1.02, and VXN/VIX to 1.51 from 1.47.
VIX futures. November trades at 17.90, 7.8% above spot and just below December at 18.11, from 4.4% above it a day earlier. Put-call parity on the 18 November options at Wednesday’s close returned 17.73, in line with the 17.74 settlement, so the series has not rolled.
Tails and correlation. SKEW edged up 0.59% to 150.90, above its 146.04 median. Implied correlation, a gauge of how closely stocks are expected to move together, fell 24.49% to 12.15, its largest one-session drop in the store, a day after a store high.
Single-name volatility
Single-name volatility fell too. On a common set of 522 underlyings the median implied-volatility rank fell to 37.0 from 42.7, and the mean to 40.0 from 46.6, with 468 names down and 45 up.
Among the index funds the falls were large. The Nasdaq 100 fund’s rank fell to 52.0 from 84.6, and the S&P 500 fund’s to 17.0 from 37.1. Nvidia barely moved, at 65.9 from 68.8, still at the 85th percentile of its year, and the semiconductor fund fell less than the index funds, to 47.3 from 57.7. In our view that may suggest the market kept paying for the chip debate while it stopped paying for the vote.
Energy stays rich. The energy sector fund sits at 77.6, the 93rd percentile, and ConocoPhillips, which reports today, at 100. Reports did the rest: CVS Health fell 42.8 points to 35.8 and Block 47.4 points to 7.8.
Implied-volatility rank and percentile from the Saxo screener, read overnight to about 03:00 CET on 5 November 2026, carrying Wednesday’s close. Source: Saxo.
Options flow sentiment
Based on end-of-day Wednesday 4 November, yesterday’s positioning, not today’s price action.
- Single-name flow was dominated by negotiated, two-sided size with no readable direction; the side-clean trades leaned toward selling premium into the rally in the megacaps.
- Sector and ETF flow showed no visible unwind of election hedges and no fresh downside positioning in chips. In our view it neither confirms nor contradicts the move in volatility.
Where the week's range sits
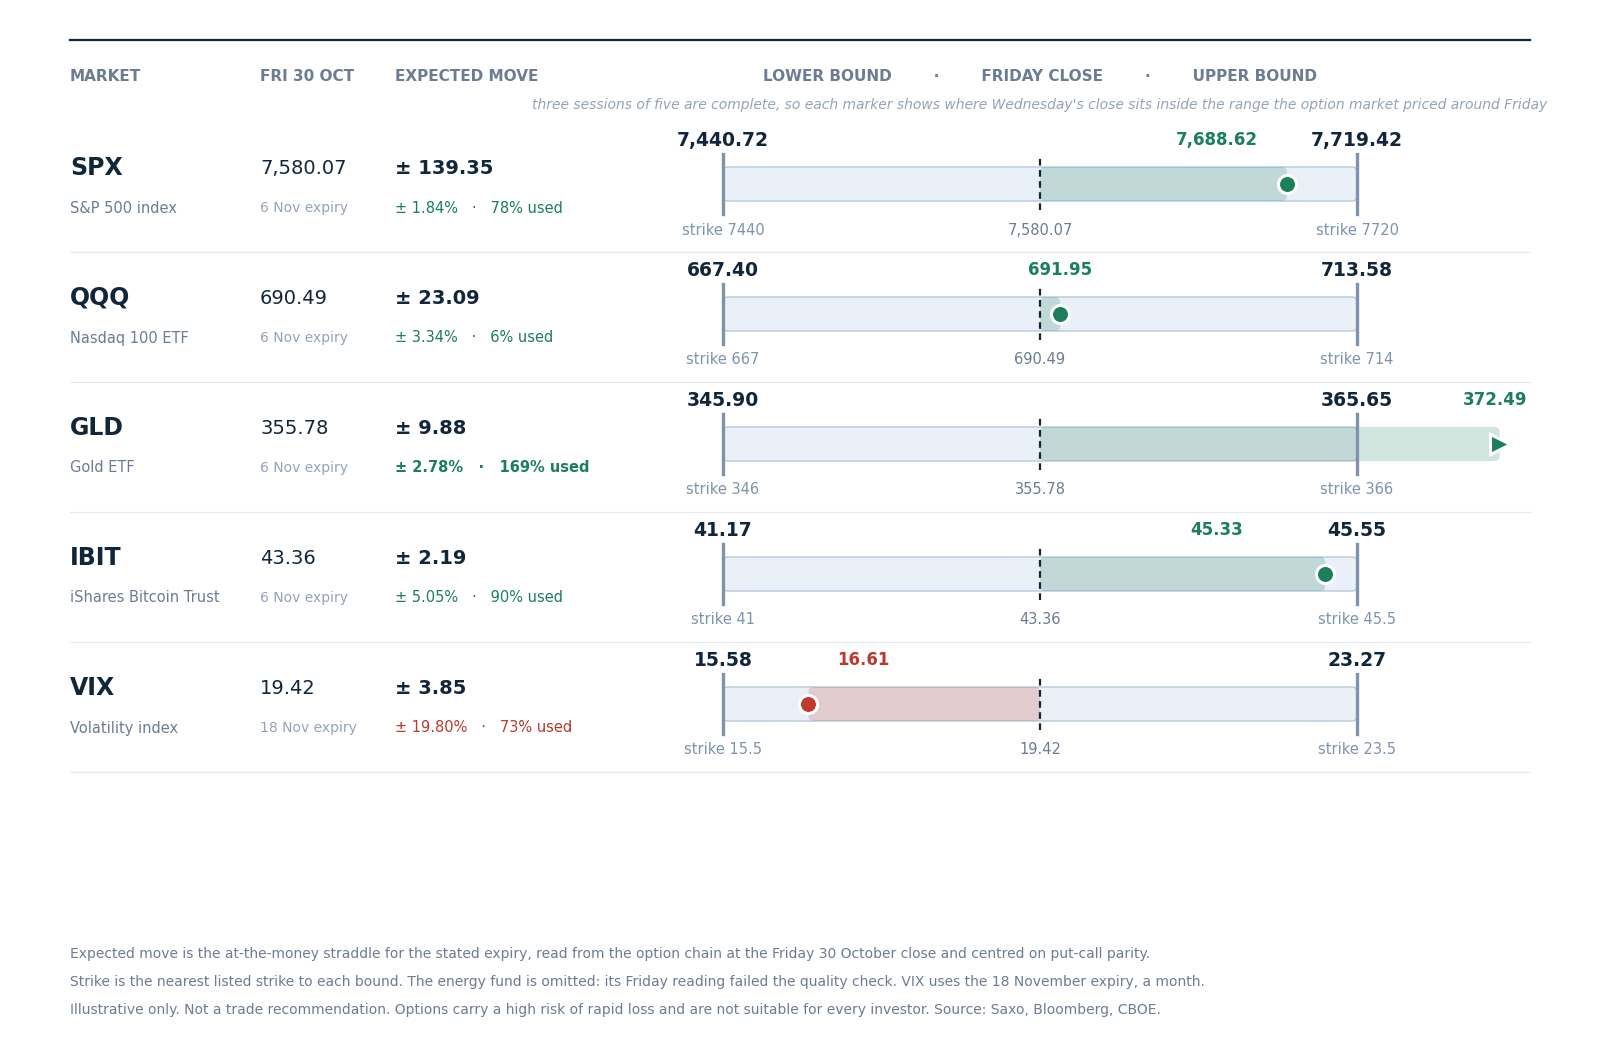
The range the option market priced for this week around Friday 30 October’s close, with each market’s Wednesday close marked inside it. Illustrative only, not a trade recommendation. Past performance is not indicative of future results. Source: Saxo, Bloomberg, CBOE.
The S&P 500 began the week with 139.35 points priced around Friday’s 7,580.07 close, 1.84%, from 7,440.72 to 7,719.42. Wednesday’s close at 7,688.62 has used 78% of that band to the upside, against 8% to the downside a day earlier, with two sessions left.
Gold has gone through its band: the gold fund has used 169% upward. The bitcoin fund has used 90% upward and the Nasdaq 100 fund only 6%. The volatility row uses the 18 November expiry, so it measures a month, not a week, and has used 73% of its band downward. The energy fund’s Friday reading failed our quality check and is left out.
Options carry a high risk of rapid loss and are not suitable for every investor. Costs and charges apply and vary by account and venue; check the rates applicable to you.
Today's catalysts
- 08:00 CET Swedish flash inflation and German factory orders; 10:00 CET Norges Bank decision.
- 13:00 CET Bank of England decision; 14:30 CET US weekly jobless claims; 17:00 CET ECB President Lagarde speaks.
- Earnings today: ConocoPhillips, Deutsche Telekom, Airbnb, Cloudflare, Booking, Marriott and Lumentum; Toyota and Sony also report.
- Friday: US October payrolls, with Moderna and Enbridge reporting.
Earnings scorecard
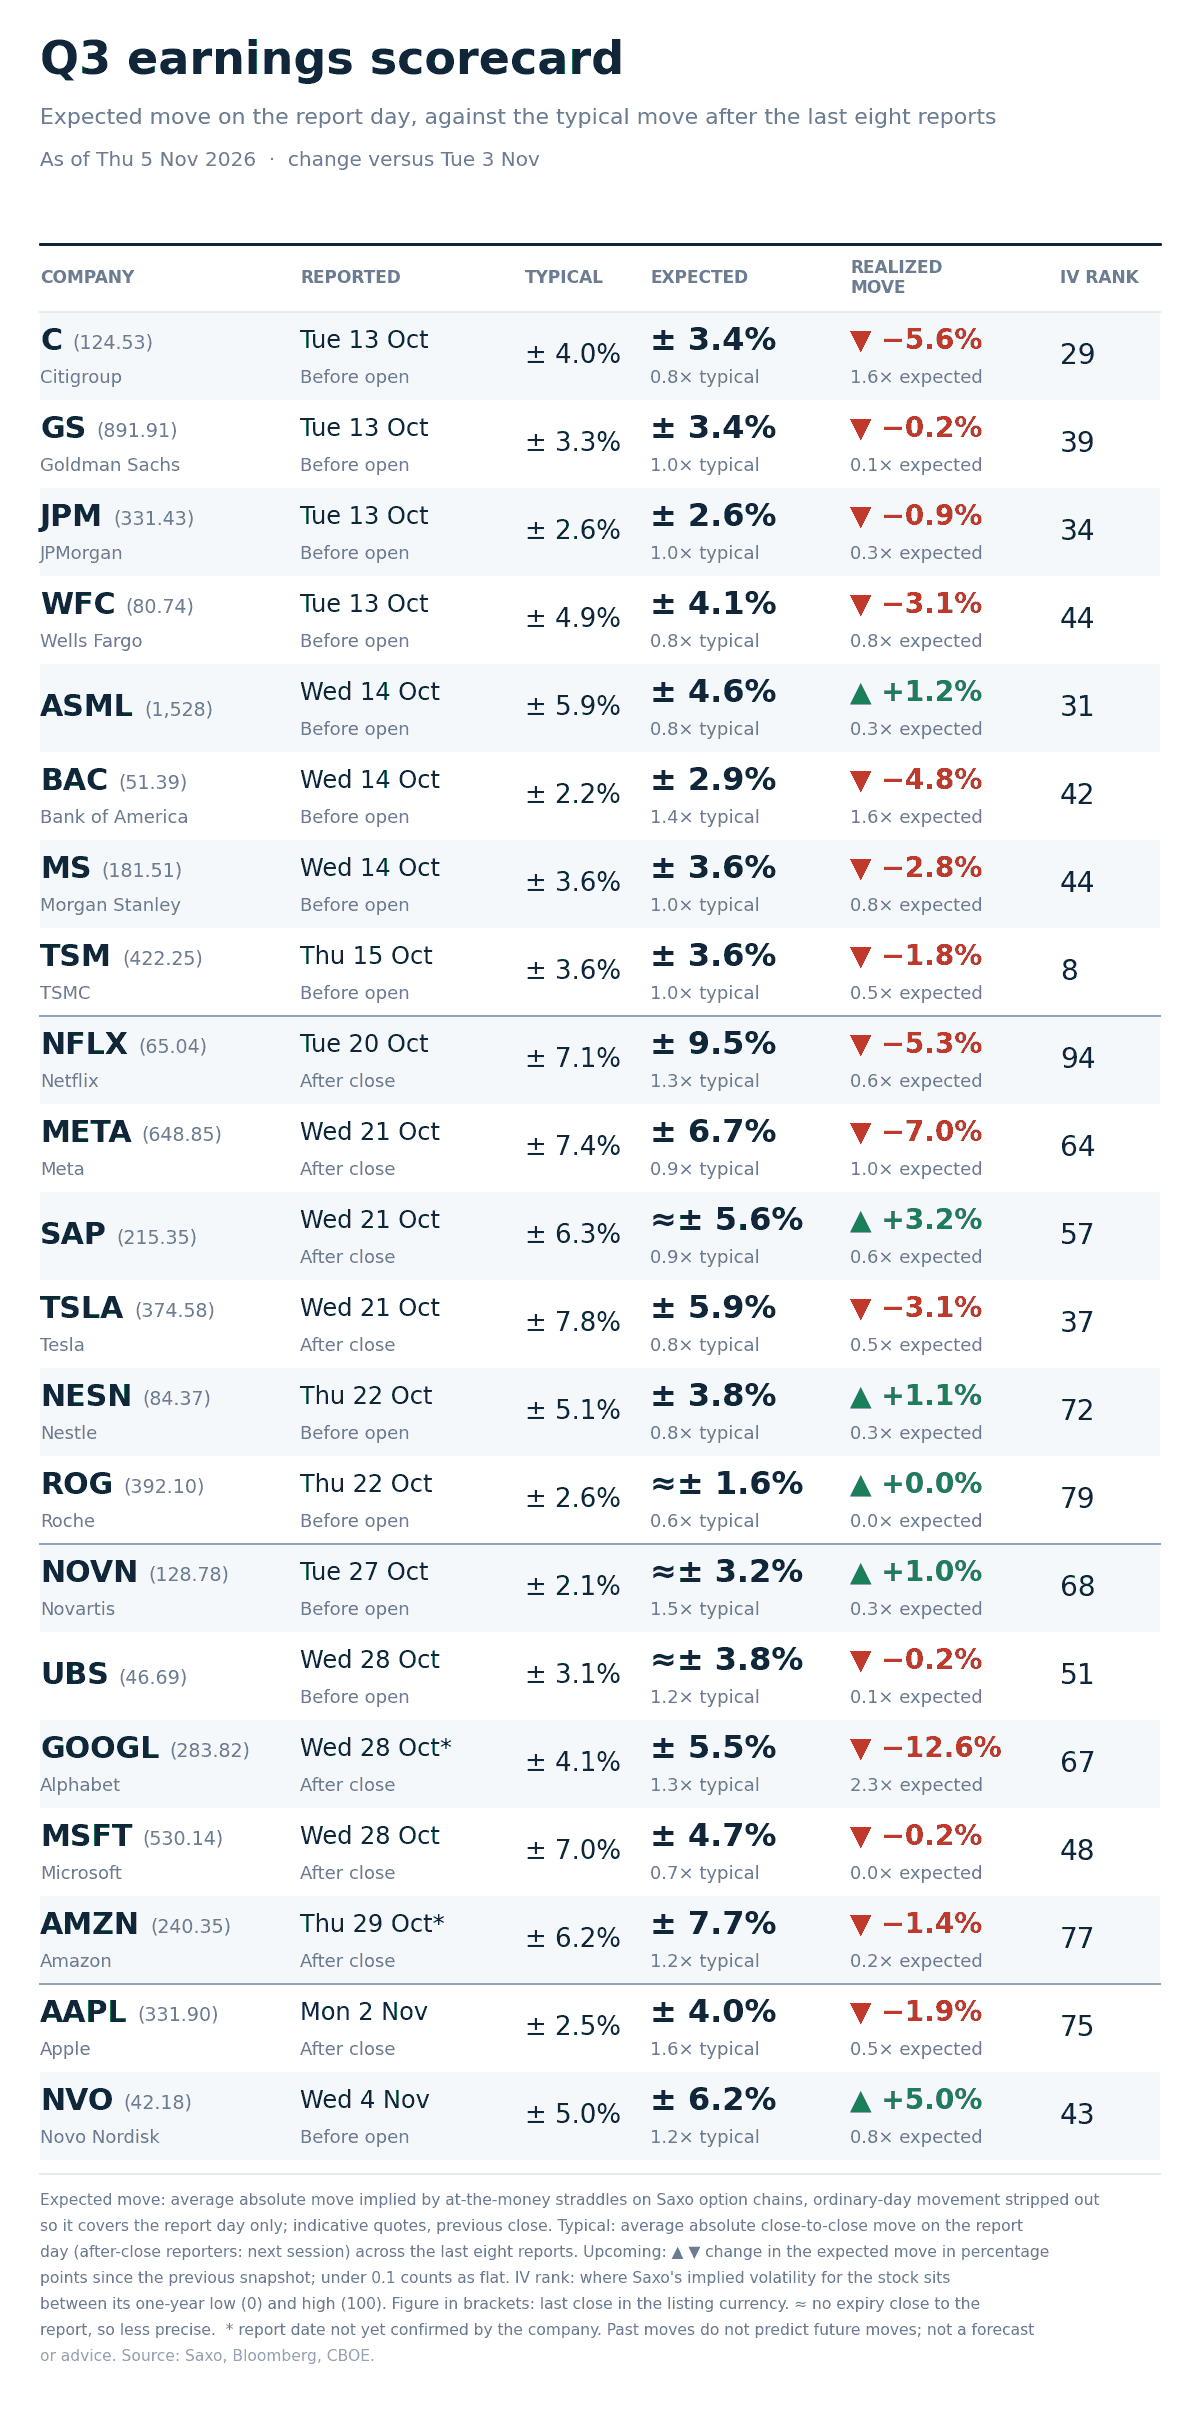
Option-implied expected move for each report day against the stock’s average move after its last eight reports, across the twenty-one names tracked this season. Past performance is not indicative of future results. Source: Saxo, Bloomberg, CBOE.
The season’s board is now closed. Novo Nordisk, the last name to report, moved 5.0% against 6.2% priced, about 0.8 times its expected move and in line with its eight-report average of 5.0%.
Across all twenty-one names the median moved about 0.5 times what was priced, and four moved at least as much as priced: Citigroup, Bank of America, Meta and Alphabet. Alphabet’s 12.6% fall against 5.5% priced, 2.3 times, stays the largest move relative to its pricing. Microsoft and Roche barely moved at all against what was priced.
In our view the season leaned toward report-day premium that was larger than the moves that followed, though four names show how wide the exceptions can be.
Options carry a high risk of rapid loss and are not suitable for every investor. Costs and charges apply and vary by account and venue; check the rates applicable to you. Past performance is not indicative of future results.
What the market is pricing
- Session implied range: S&P 500 options price about 43 points, 0.55%, for today’s expiry. The quotes are indicative before the open, and S&P 500 futures sat 0.19% below their settlement at 05:00 CET. The one-day gauge at 12.08 implies about 0.76%, a one-sigma figure rather than an expected move.
- Event repricing: yesterday the 6 November expiry priced 1.68% with three sessions to run. Time decay alone would have left about 1.37%. Today it prices 0.87%, about half a point below decay, so in our view the market took out the election premium it had added on each of the three sessions before.
- Curve read: the one-day gauge now sits 27% below the VIX, while the three-month sits 13% above it. In our view that leans toward a market that sees less risk in the next few sessions than further out, even with payrolls on Friday.
- Tail read: SKEW, which tracks the price of protection against a sharp fall, held near 150 while the VIX fell a fifth. In our view that may suggest demand for protection against a sharp fall has not left with the vote, even as the cost of protection overall dropped.
In our view the next test is whether the calm holds through two scheduled events. The Bank of England decides at 13:00 CET and payrolls land on Friday, both inside a week whose index range is already 78% used to the upside. Options carry a high risk of rapid loss and are not suitable for every investor. Costs and charges apply and vary by account and venue; check the rates applicable to you. Past performance is not indicative of future results.
| More from the author |
|---|