
Access all our platforms from a single account.

Front vol empties, correlation cracks - Options Brief - 18 September 2026

Summary: The premium paid for this week’s decision came out of the volatility curve overnight, almost all of it at the front. The question is why the index went quiet while the names inside it did not.
The premium the market had been paying for this week’s decision came out of the volatility curve yesterday, and almost all of it came out of the front. The reason is the more interesting part. The index went quiet because its components stopped moving together, not because they calmed down.
MARKET REGIME: TRANSITIONING | VIX 15.44 | TERM STRUCTURE: CONTANGO | SKEW: ELEVATED (145.70) | FRONT-MONTH VIX FUTURES: 17.92
- The whole move sat in the front of the curve. VIX1D fell 22.87% to 13.12 and VIX9D 23.05% to 13.39, against 1.59% at one year. The front-month VIX future reads 17.92, a premium of 2.48 points to spot where yesterday it was 0.79.
- Correlation did the work, not calm. COR3M dropped 11.40% to 11.58 while dispersion went the other way, DSPX up 2.88% to 32.91.
- Today’s expiry is priced under the clock. Yesterday the same expiry carried 1.07% with two sessions to run. Flat volatility and time decay alone would have left roughly 0.76%. The market is charging 0.56%.
Where the week’s range sits
What the option market priced for this week around Friday’s close, and how much of it the first four sessions used.
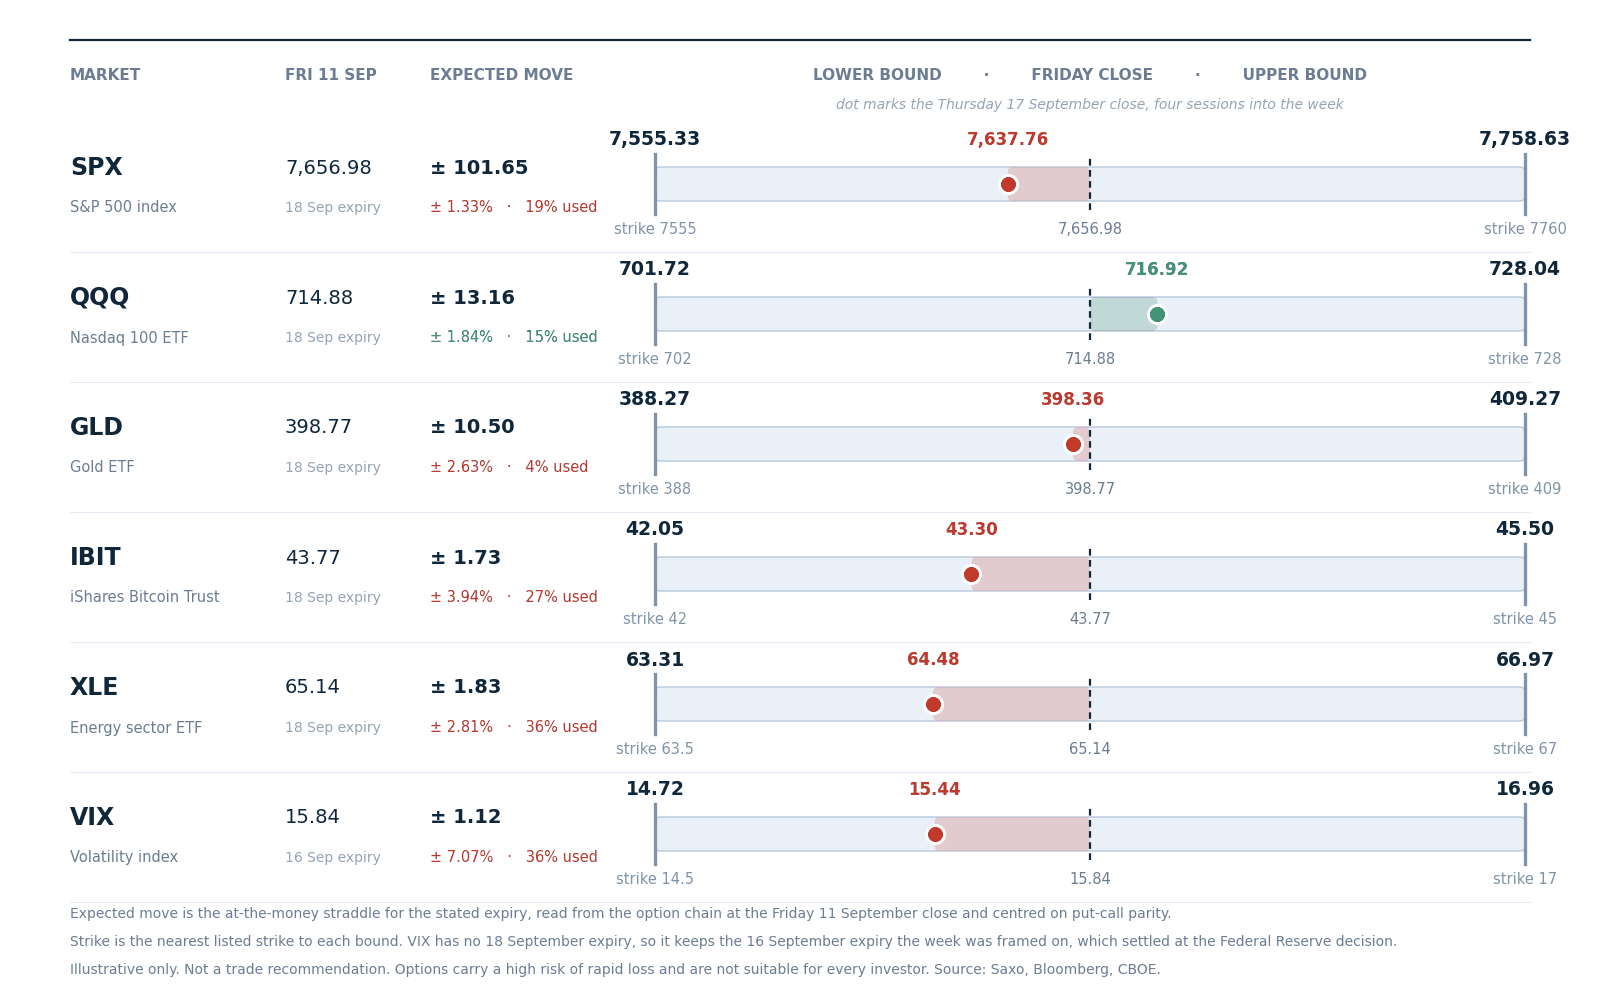 Expected move to today’s expiry, drawn around the Friday 11 September close, with the nearest listed strike at each bound. The VIX row keeps the 16 September expiry the week was framed on, which settled at Wednesday’s decision. Read from the option chain at Friday’s close and centred on put-call parity, not a forecast.
- The index came all the way back. On Wednesday the S&P 500 had spent 103% of the 101.65 point range priced around Friday’s close, to the downside. One session later it sits 19% through it. The Nasdaq 100 fund has used 15%, upward, gold 4%, the bitcoin fund 27% and the energy fund 36%.
- Volatility made the same round trip. The VIX had covered 167% of its 1.12 point priced move on Wednesday and now sits 36% through it, below where the week began. In our view a week that breached its range at midweek and ends inside it on all six markets may say more about the event being removed than about anything being resolved. Options carry a high risk of rapid loss and are not suitable for every investor. Costs and charges apply to exchange-traded fund trades; see Saxo pricing for costs and applicable charges.
Headline driver
US equities rebounded on Thursday as crude and Treasury yields both eased, with semiconductors leading after Nvidia’s chief executive said chip sales volumes could double next year.
Overnight the Bank of Japan raised its policy rate 25 basis points to 1.25%, but the 7 to 2 vote and a statement short on urgency sent the yen sharply lower. More in Saxo’s macro coverage and today’s Market Quick Take.
Market snapshot
- US (Thursday 17 September close): S&P 500 7,637.76, up 1.14%. Nasdaq 100 29,446.98, up 1.73%. Dow 51,778.04, up 0.61%. The Philadelphia Semiconductor Index gained about 3%, Nvidia 2.5% and Micron more than 5% after Intel’s chief executive said memory demand was not slowing. Coinbase rose 5.8% after regulators opened a path for tokenised US equities.
- Europe (Thursday 17 September close): the Stoxx 600 rose 0.9%, the DAX 0.7%, the CAC 40 0.6% and the FTSE 100 1.2%, with mining and autos leading. ASML added 1.6% and Allegro jumped 9.5% on raised 2026 guidance, while Raiffeisen Bank fell 6.0% after a short seller disclosed a position.
- Asia (Friday 18 September session, in progress): the Nikkei 225 traded about 1.8% higher and the Kospi 2.6%, with the Hang Seng up 0.7%. Samsung Electronics gained around 3% and SK Hynix close to 6% on the memory outlook.
- Commodities and rates: Brent has extended its pullback below USD 104, a third straight decline as the Saudi pipeline outage looks shorter than feared. Gold trades near USD 4,360, back above the post-decision low near USD 4,240. The US 10-year yield is 4.94% after falling about nine basis points on Thursday, and the 2-year sits below 4.69%. EURUSD 1.1490, USDJPY 157.01 before the Bank of Japan pushed it higher.
- Market regime: Transitioning, VIX 15.44, with the S&P 500 sitting on its 50-day moving average, 0.30% above it, and 20-day realised volatility at 9.6%, falling.
Data source: Saxo, Bloomberg, CBOE, as of 18 September 2026, approximately 06:00 CET. Past performance is not indicative of future results.
Options flow sentiment
Based on end-of-day 17 September, yesterday’s positioning and not today’s price action.
- Single-name flow put premium dominated every tape, 84.5% of confirmed-opening premium in the mega-caps and 77.3% in semiconductors, and almost none of it is readable as direction. The large lines were struck deep in the money, printed at the mid on multi-leg tickets, and expire at today’s settlement, which is the signature of exposure being transferred rather than protection being bought. The few lines with a clean bought side were small and pointed the other way, notably Micron calls sitting on its 30 September report.
- Sector and ETF flow the same shape held across every complex, 91.5% puts in rate funds and 97.5% in the defensive sector funds, deep in the money and expiring the next session in each case. On the eve of a quadruple witching, a tape that is nine-tenths puts is describing its own plumbing. Named funds are market context only. Costs and charges apply to exchange-traded fund trades; see Saxo pricing for costs and applicable charges.
Volatility surface - 18 September 2026, approx. 06:00 CET
VIX term structure
- VIX 15.44, down 12.82%, giving back the whole post-decision rise and more.
- VIX1D 13.12, down 22.87%, the largest fall anywhere on the board.
- VIX9D 13.39, down 23.05%.
- VIX3M 18.55 · VIX6M 20.30 · VIX1Y 21.72, contango intact and considerably steeper, with the VIX3M to VIX ratio at 1.20, up 7.83%.
VIX futures
- Front-month 17.92, the October contract, confirmed by put-call parity on that expiry at 17.985. The reading is an early Friday quote against a Thursday cash close, so it is stated as a level rather than as a session change.
- Second-month 18.62, front-to-second ratio 0.960, curve in contango.
Skew and correlation
- CBOE SKEW 145.70, down 0.25 points, effectively unmoved through a 12.82% fall in the 30-day measure.
- COR3M 11.58, down 11.40%, the largest percentage fall outside the front of the curve.
- DSPX 32.91, up 2.88%.
Other vol measures
- VVIX 87.72 · MOVE 76.22, the latter down 5.59%.
- VXN 19.96, down 11.05%, leaving the VXN to VIX ratio at 1.29.
- GVZ 24.98, down 5.91%, on a session where oil volatility fell 9.36%.
Data source: Saxo, Bloomberg, CBOE, as of 18 September 2026, approximately 06:00 CET. Past performance is not indicative of future results.
Single-name volatility - where implied volatility sits against its own year
Saxo’s implied-volatility rank across 149 US and 330 euro-zone option underlyings. A rank of 0 is a one-year low, 100 a one-year high.
- Premium is cheap almost everywhere, cheapest on the index itself. The typical US name ranks 31, only about one in nine above 50, and more than one in five sits near its one-year low. Europe reads the same at 32. The index group is the cheapest corner of the list at a median rank of 15, the correlation story told from the other side.
- Where rank is elevated it is defensives and energy, not technology. Accenture ranks 80, Johnson & Johnson 75, Nike 69 and Exxon 59, energy the richest sector at 56. Nvidia ranks 2 and Broadcom 3, the cheapest on the list, on the session semiconductors led.
- A high rank does not always mean expensive. Rank measures distance from the year’s extremes, not how many days looked like today. Fuchs ranks 63 in Europe, yet implied volatility has been higher on only about one day in ten: a single spike set the high. The 7-to-10-year Treasury fund is the mirror image: rank 23, on a level exceeded on about seven days in ten. Named funds are market context only. See Saxo pricing for costs and applicable charges.
Data source: Saxo, as of 18 September 2026, reflecting the 17 September close. Day counts are Saxo’s one-year implied-volatility percentile. Past performance is not indicative of future results.
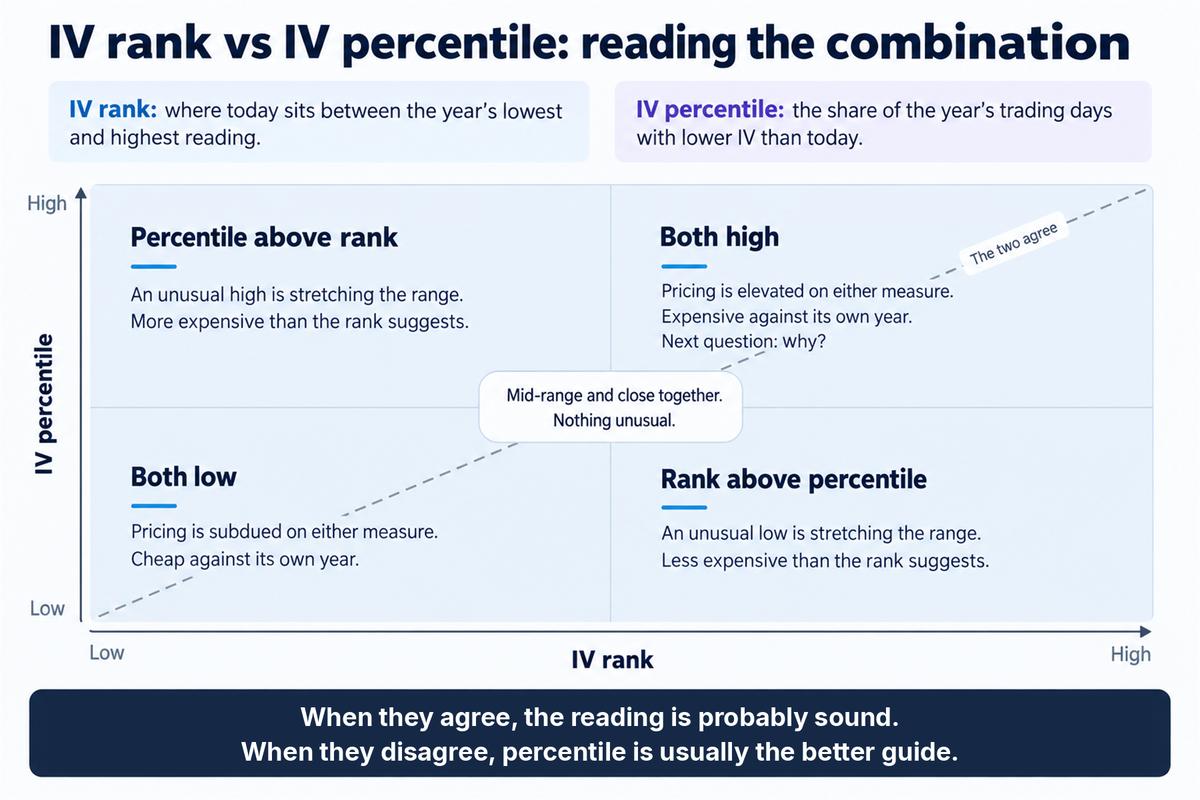 How to read IV rank and IV percentile together. Illustrative and for educational purposes only; not predictive. Source: Finding unusually expensive or cheap options in the Saxo screener
What the market is pricing
- Session implied move. SPX options price a 0.56% move to tonight’s quarterly settlement, about 43 points, derived from at-the-money option pricing rather than from any forecast. The only scheduled US release inside a session that runs to the 22:00 CET cash close is August industrial production at 15:15 CET.
- Event implied range. Yesterday this same expiry priced 1.07%, roughly 81 points, with two sessions left. Flat volatility and one fewer session would have left about 0.76%. At 0.56% the market has taken out roughly a quarter of the range on top of what the clock explains, which is a fall in implied volatility rather than decay. Next Friday’s expiry prices 1.34%, about 102 points.
- Tail risk signal. SKEW held at 145.70 through a 12.82% fall in the 30-day measure, so the crash bid took no part in the unwind. In our view that may point to hedges being carried through the expiry rather than sold into the calm, leaving the surface cheaper at the money without being cheaper in the tail.
- Correlation and dispersion read. COR3M fell 11.40% while DSPX rose 2.88%, and the rank data puts index options near their one-year low against a typical single name at 31. In our assessment the index may have gone quiet because its components stopped agreeing rather than because any of them stopped moving.
Options carry a high risk of rapid loss and are not suitable for every investor. Past performance is not indicative of future results.
Today’s catalysts
UK August retail sales were released at 08:00 CET. Bank of Japan Governor Ueda’s press conference follows this morning’s increase to 1.25%, and US August industrial production lands at 15:15 CET.
Today is the September quarterly expiry, settling at the 22:00 CET cash close. Next week brings Autozone, Cintas, Paychex, Costco and H&M. Future outcomes are uncertain and may result in losses.
Conclusion
The event has been removed and the curve is steeper than before the week started, with the front of the cash measures back near the year’s lows and the futures curve barely moved.
In our view the more useful signal sits underneath that, in a correlation measure that fell hard while dispersion rose: index volatility can be cheap while the names inside it are not, and a quadruple witching is a poor session on which to test which is right.
What today mostly resolves is plumbing. The deep in-the-money book that made yesterday’s tape look nine-tenths bearish clears at the close, and next week opens with a Friday expiry already priced at 1.34%. Options carry a high risk of rapid loss and are not suitable for every investor. Past performance is not indicative of future results.
Important note: The strategies and examples provided in this article are purely for educational purposes. They are intended to assist in shaping your thought process and should not be replicated or implemented without careful consideration. Every investor or trader must conduct their own due diligence and take into account their unique financial situation, risk tolerance, and investment objectives before making any decisions. Remember, investing in the stock market carries risk, and it’s crucial to make informed decisions.
| More from the author |
|---|