
You can access both of our platforms from a single Saxo account.

The middle got cheaper, the edge did not - Options Brief - 12 October 2026

Summary: Eleven of the fourteen volatility measures we track fell on Friday. The one that rose furthest was SKEW, which now sits a fraction below its highest reading of the quarter, and the readable flow was selling that wing.
Eleven of the fourteen volatility measures we track fell on Friday. The one that rose furthest prices the part of the distribution the index almost never reaches.
MARKET REGIME: LOW VOL BULL | VIX 14.84 | TERM STRUCTURE: CONTANGO | SKEW: ELEVATED (154.34) | FRONT-MONTH VIX FUTURES: 17.00
Key findings
- The body of the index distribution is near its cheapest of the quarter. VIX at 14.84 reads lower than 46 of our last 63 sessions, the one-day gauge at 9.05 lower than 55.
- The tail did not follow. SKEW rose 3.45% to 154.34, the largest advance on a board where eleven of fourteen measures fell, and 0.15 below the window’s high.
- Single names repeat it, rates breaks it. The index-fund group’s median implied-volatility rank is 17.1 and Nvidia 6.4, against 67.1 for the long-dated Treasury fund.
- The widest earnings premium this week is Bank of America’s. Wednesday prices 3.2% against a typical 2.2%, where Wells Fargo and Citigroup price four-fifths of their own.
Headline driver
Oil led, then gave it back. Riyadh’s airport was hit again on Sunday, one killed and eleven injured, after a weekend attack the Houthis carried out that killed twelve and injured three hundred. Brent traded briefly above USD 105.50 before reversing and now sits near USD 103.70, lower by about 1%.
Supply pulled the other way. Russia partially lifted its diesel export ban and agreed to supply 500,000 tonnes from 10 October under a Trump-Putin agreement, President Trump allowed imports of Russian diesel, and claims circulated of an energy ceasefire between Russia and Ukraine. London gasoil fell 3.3% to near USD 185 per barrel equivalent.
One data point sat underneath. The preliminary University of Michigan sentiment index for October fell to 46.3 against a 47.6 consensus and 48.1 in September, its current-conditions component at 44.7, the weakest on record.
Market snapshot
- US (Friday 9 October close): The S&P 500 rose 0.59% to 7,811.54, the Nasdaq 100 0.51% to 30,883.15 and the Dow 0.83% to 51,660.18. The Russell 2000 added 0.46% to 2,806.98 and still fell a fifth straight week, down 5.7% over that run. Verizon lost 8.7% on an USD 8 billion SpaceX spectrum deal.
- Breadth and sectors: The equal-weight index rose 0.53%, within six basis points of the headline. Biotech led at 3.00%, gold miners 2.95%, software 2.81% and healthcare 1.58%, while semiconductors fell 0.65%. Microsoft rose 2.38% and Amazon 3.29%, Apple fell 1.11%.
- Europe: The Stoxx Europe 600 rose 0.97% to 631.56, its best session since 21 September, and the DAX 1.13% to 25,087.27. The Euro Stoxx 50 at 6,173.38 still ended the week 1.04% lower, banks roughly 8% below two weeks ago.
- Asia (Monday morning): Japan is closed. Korea is the laggard, the Kospi down 3.14% to 6,418.10 on Friday’s memory weakness. The Hang Seng rose 0.17%, the CSI 300 eased 0.15%.
- Commodities and rates: Gold closed Friday at a two-week high and has since retreated to USD 4,185 from USD 4,217 in early Asian trade. Corn settled 4.1% lower at 480 cents on the October WASDE. The ten-year Treasury yield ended the week at 5.24% and the two-year at 4.79%.
Source: Saxo, Bloomberg, CBOE. Levels as of the 9 October close unless stated. Yield levels come from the published close, not the export’s change column. Past performance is not indicative of future results.
Volatility surface
Eleven measures fell, three rose, and only one of the three prices the index.
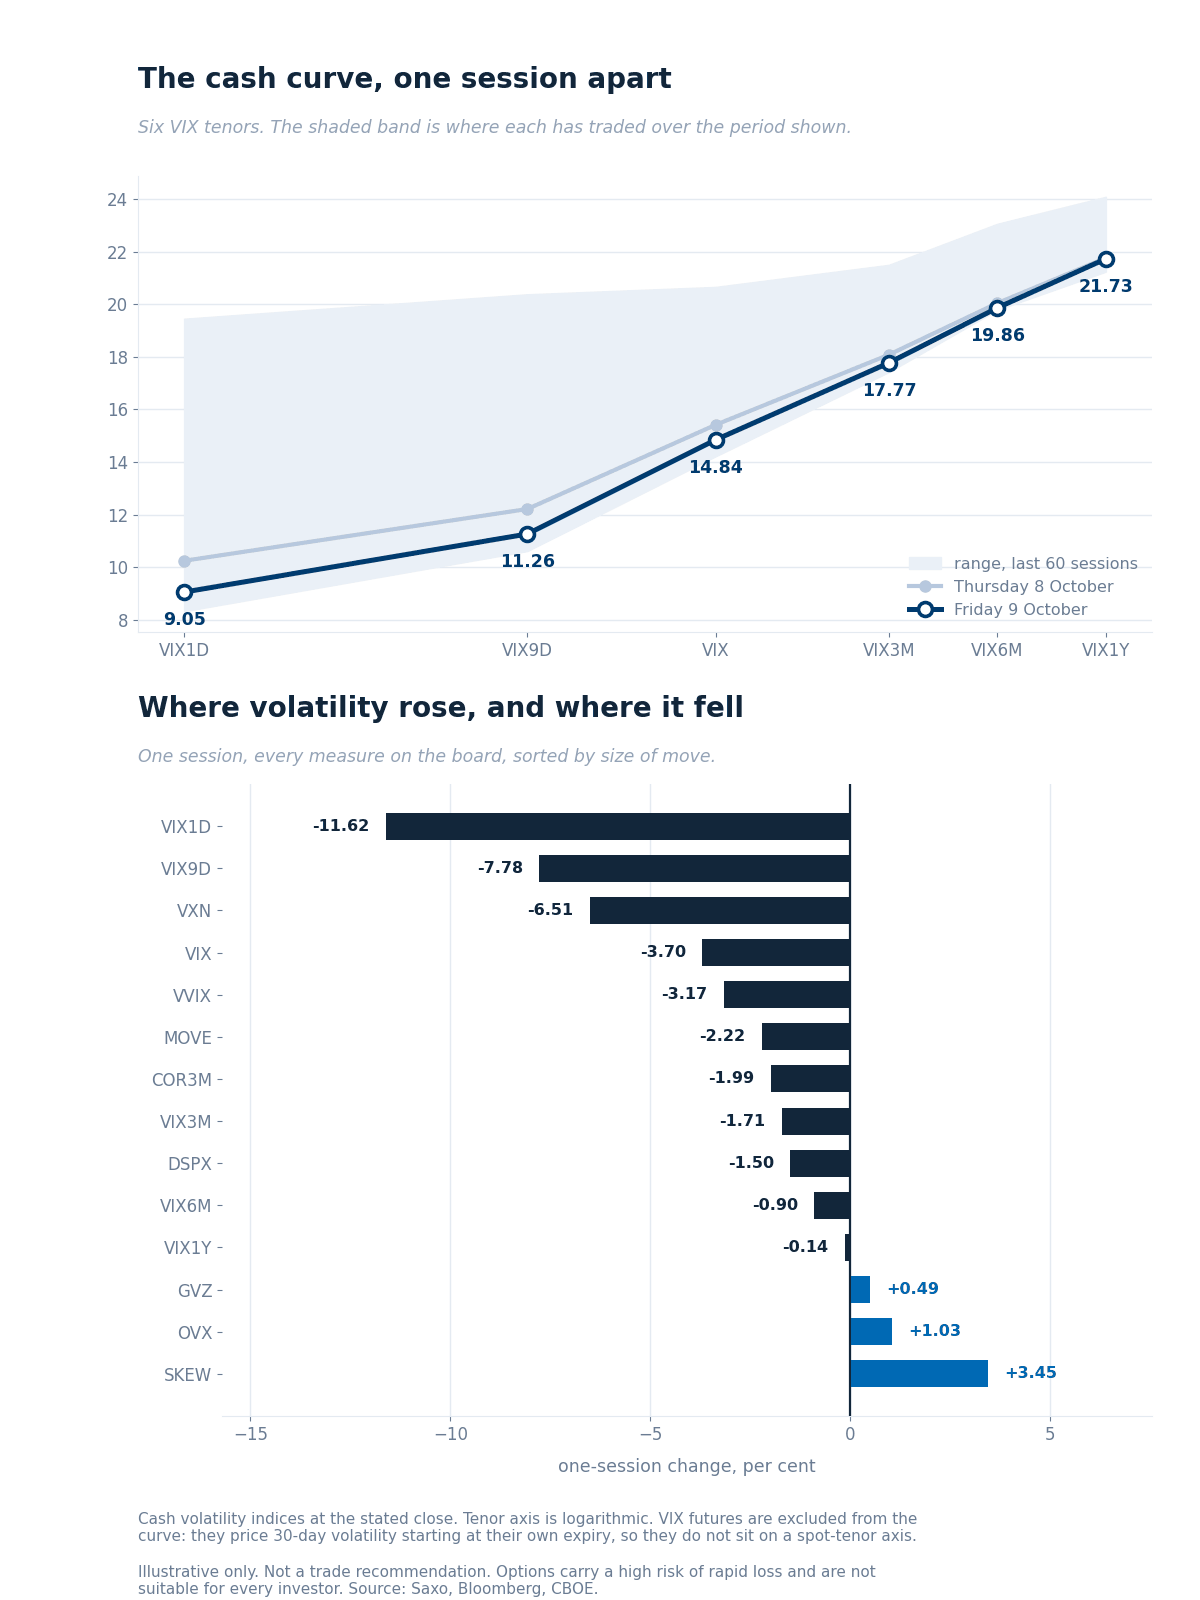
The cash volatility curve at the Friday 9 October close against Thursday, over the range of the last 60 stored sessions, with the one-session change in every measure. Past performance is not indicative of future results.
Reading the curve
The front end did the falling. VIX1D lost 11.62% to 9.05 and VIX9D 7.78% to 11.26, against 0.14% at the one-year tenor, so a curve already in contango from 9.05 to 21.73 steepened. The Nasdaq gauge fell 6.51% to 20.55 and VVIX 3.17% to 84.88, all four beaten by 55 of 63 sessions.
The three that rose are the interesting ones. Gold volatility added 0.49% to 22.79 and oil volatility 1.03% to 48.90. SKEW added 3.45% to 154.34, which only 3 of 63 sessions beat.
The spread measures held near their highs. Dispersion at 36.02 is beaten by 11 sessions and implied correlation at 11.33 by 15, both in the top quarter. Rate volatility fell a sixth session to 98.47 from 113.61 on 6 October, and still beats all but 10 against a median of 76.14.
VIX futures
The front contract printed 17.000 and the nearest listed expiry puts the parity forward at 17.12, consistent to 0.02 across the five strikes nearest the money. Premium to spot is 2.28 points, the front-to-second ratio 0.955. The continuous series does not reconcile across the weekend, so no comparison is drawn.
Source: Saxo, Bloomberg, CBOE. Past performance is not indicative of future results.
Single-name volatility
The cheap body repeats one level down, and one group refuses it.
Of the four index funds we track, the median implied-volatility rank is 17.1 and three of the four read below 20. Among the seven large technology names the median is 56.1, yet Nvidia sits at 6.4 with a one-year percentile of 1.6, the cheapest reading anywhere on our board.
Semiconductors hold the same shape with a twist. Not one of the fourteen names carries a rank above 50, the median is 27.4 and five read below 20, while the group’s median implied volatility is 46.4%. Cheap against their own year, expensive in absolute terms. Metals run a median rank of 14.1 and the crypto names 9.9.
Rates is the exception and it is not close. The long-dated Treasury fund reads 67.1 against a one-year percentile of 92.9, the intermediate fund 54.2 against 92.9 and the high-yield credit fund 25.9 against 79.0. All three shed rank fast, the long-dated fund by 25 points over five sessions, and all three still sit near the top of their own year.
Those three carry divergences of -25.8, -38.6 and -53.1, and in our view a large negative divergence may describe volatility that has been quietly rich for a sustained period rather than a spike that set a year’s high. Source: Saxo.
Options flow sentiment
Based on end-of-day 9 October, Friday’s positioning and not today’s price action.
Ten reports and no readable direction. Almost every line of size is a spread, a roll or a mid-market cross, and across the whole set only a handful of prints carry an explicit side.
Those that do run against the surface. The largest single-name wing print was a February 2027 Nvidia put sold on the bid, the one far-dated index call with a stated side was also a sale, and no purchased index tail appears anywhere in the set. In our view the premium the tail index carries has no footprint in Friday’s tape.
Where the week's range sits
What the option market priced for this week, drawn around Friday’s close.
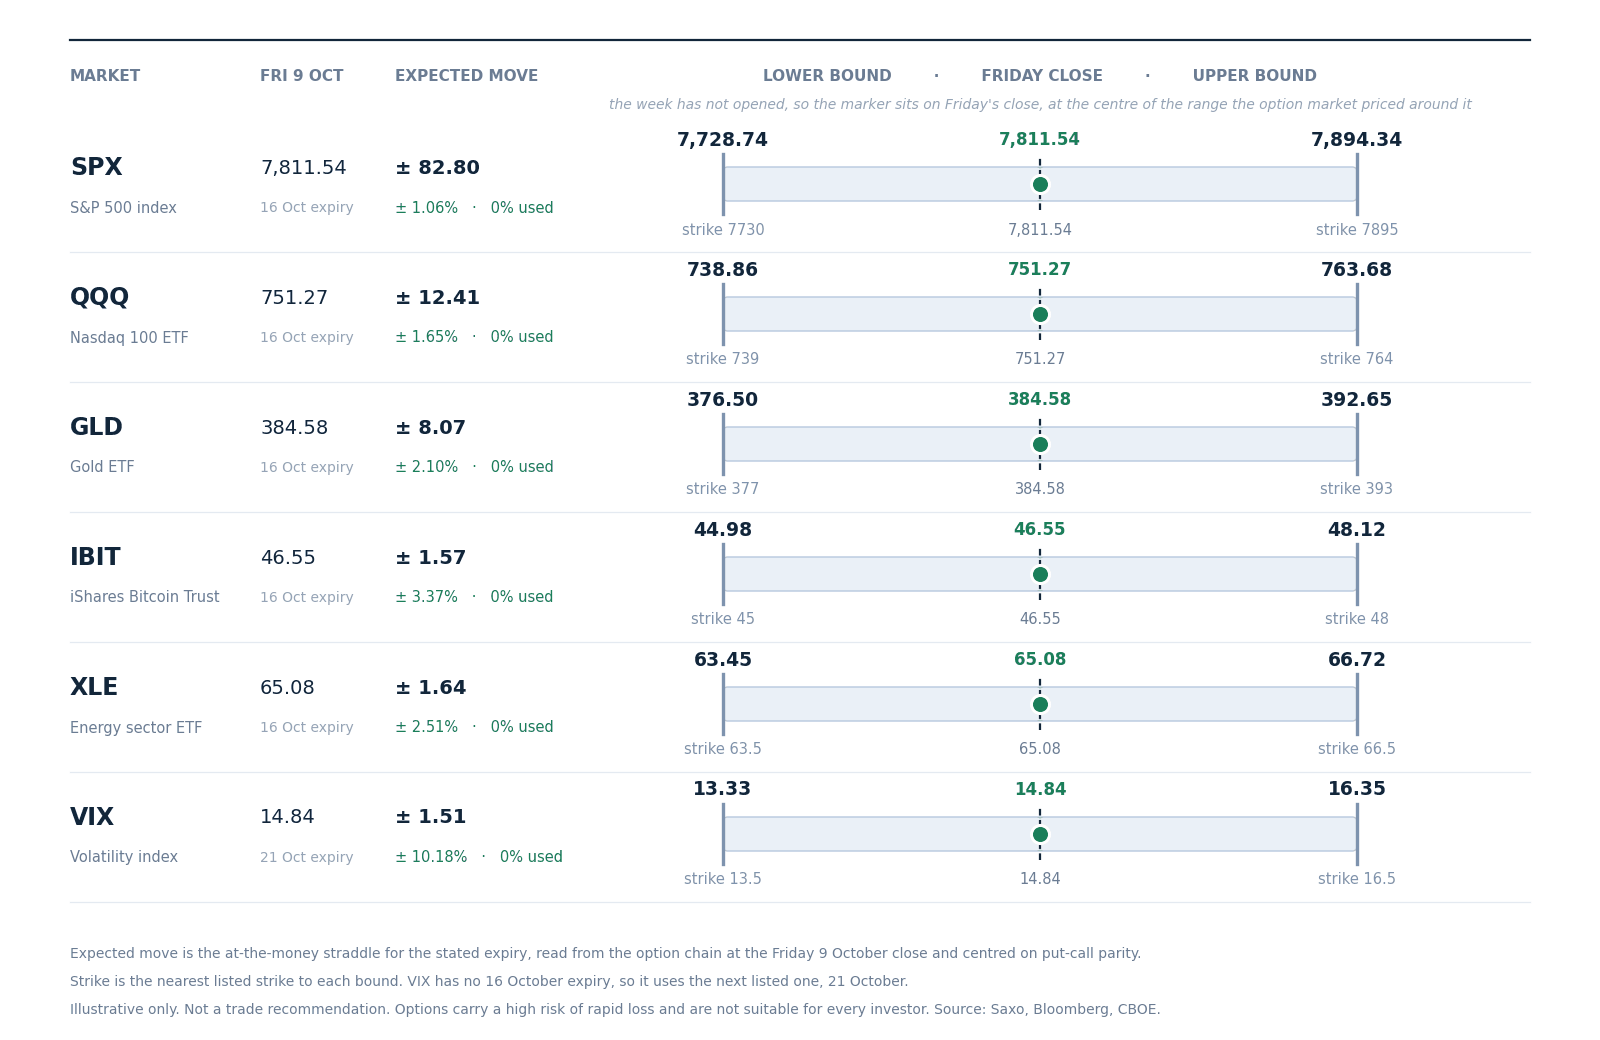
Expected move to Friday 16 October, drawn around the 9 October close with the nearest listed strike at each bound, derived from option-implied pricing. Volatility uses the 21 October expiry, the next listed one. Read from the chain at Friday’s close, not a forecast.
- The week has not opened, so every marker sits at the centre of its band. The number to read is the width.
- The index band is the narrowest on the board. The S&P 500 prices 1.06% either side of 7,811.54, against 1.65% for the Nasdaq 100 fund, 2.10% for gold, 2.51% for energy and 3.37% for the bitcoin fund.
- Energy prices two and a half times the index and the bitcoin fund more than three. In our assessment that ordering may describe the same dispersion the correlation reading carries, one level further out. It is not a forecast of where any of them closes. Options carry a high risk of rapid loss and are not suitable for every investor; see Saxo pricing for costs and charges.
Today's catalysts
The US cash session runs 15:30 CET to 22:00 CET, and the US bond market is closed for Columbus Day, so one leg of any cross-asset read is shut. The Bank of England’s Catherine Mann speaks at 14:50 CET and the Federal Reserve’s Beth Hammack, a voter, at 18:10 CET.
That is a quiet Monday in front of a loaded week. September inflation data arrives on Wednesday, producer prices and retail sales on Thursday, and Fed Chair Kevin Warsh appears at the IMF on Friday. The large US banks open reporting on Tuesday. Future outcomes are uncertain and may result in losses.
Earnings scorecard
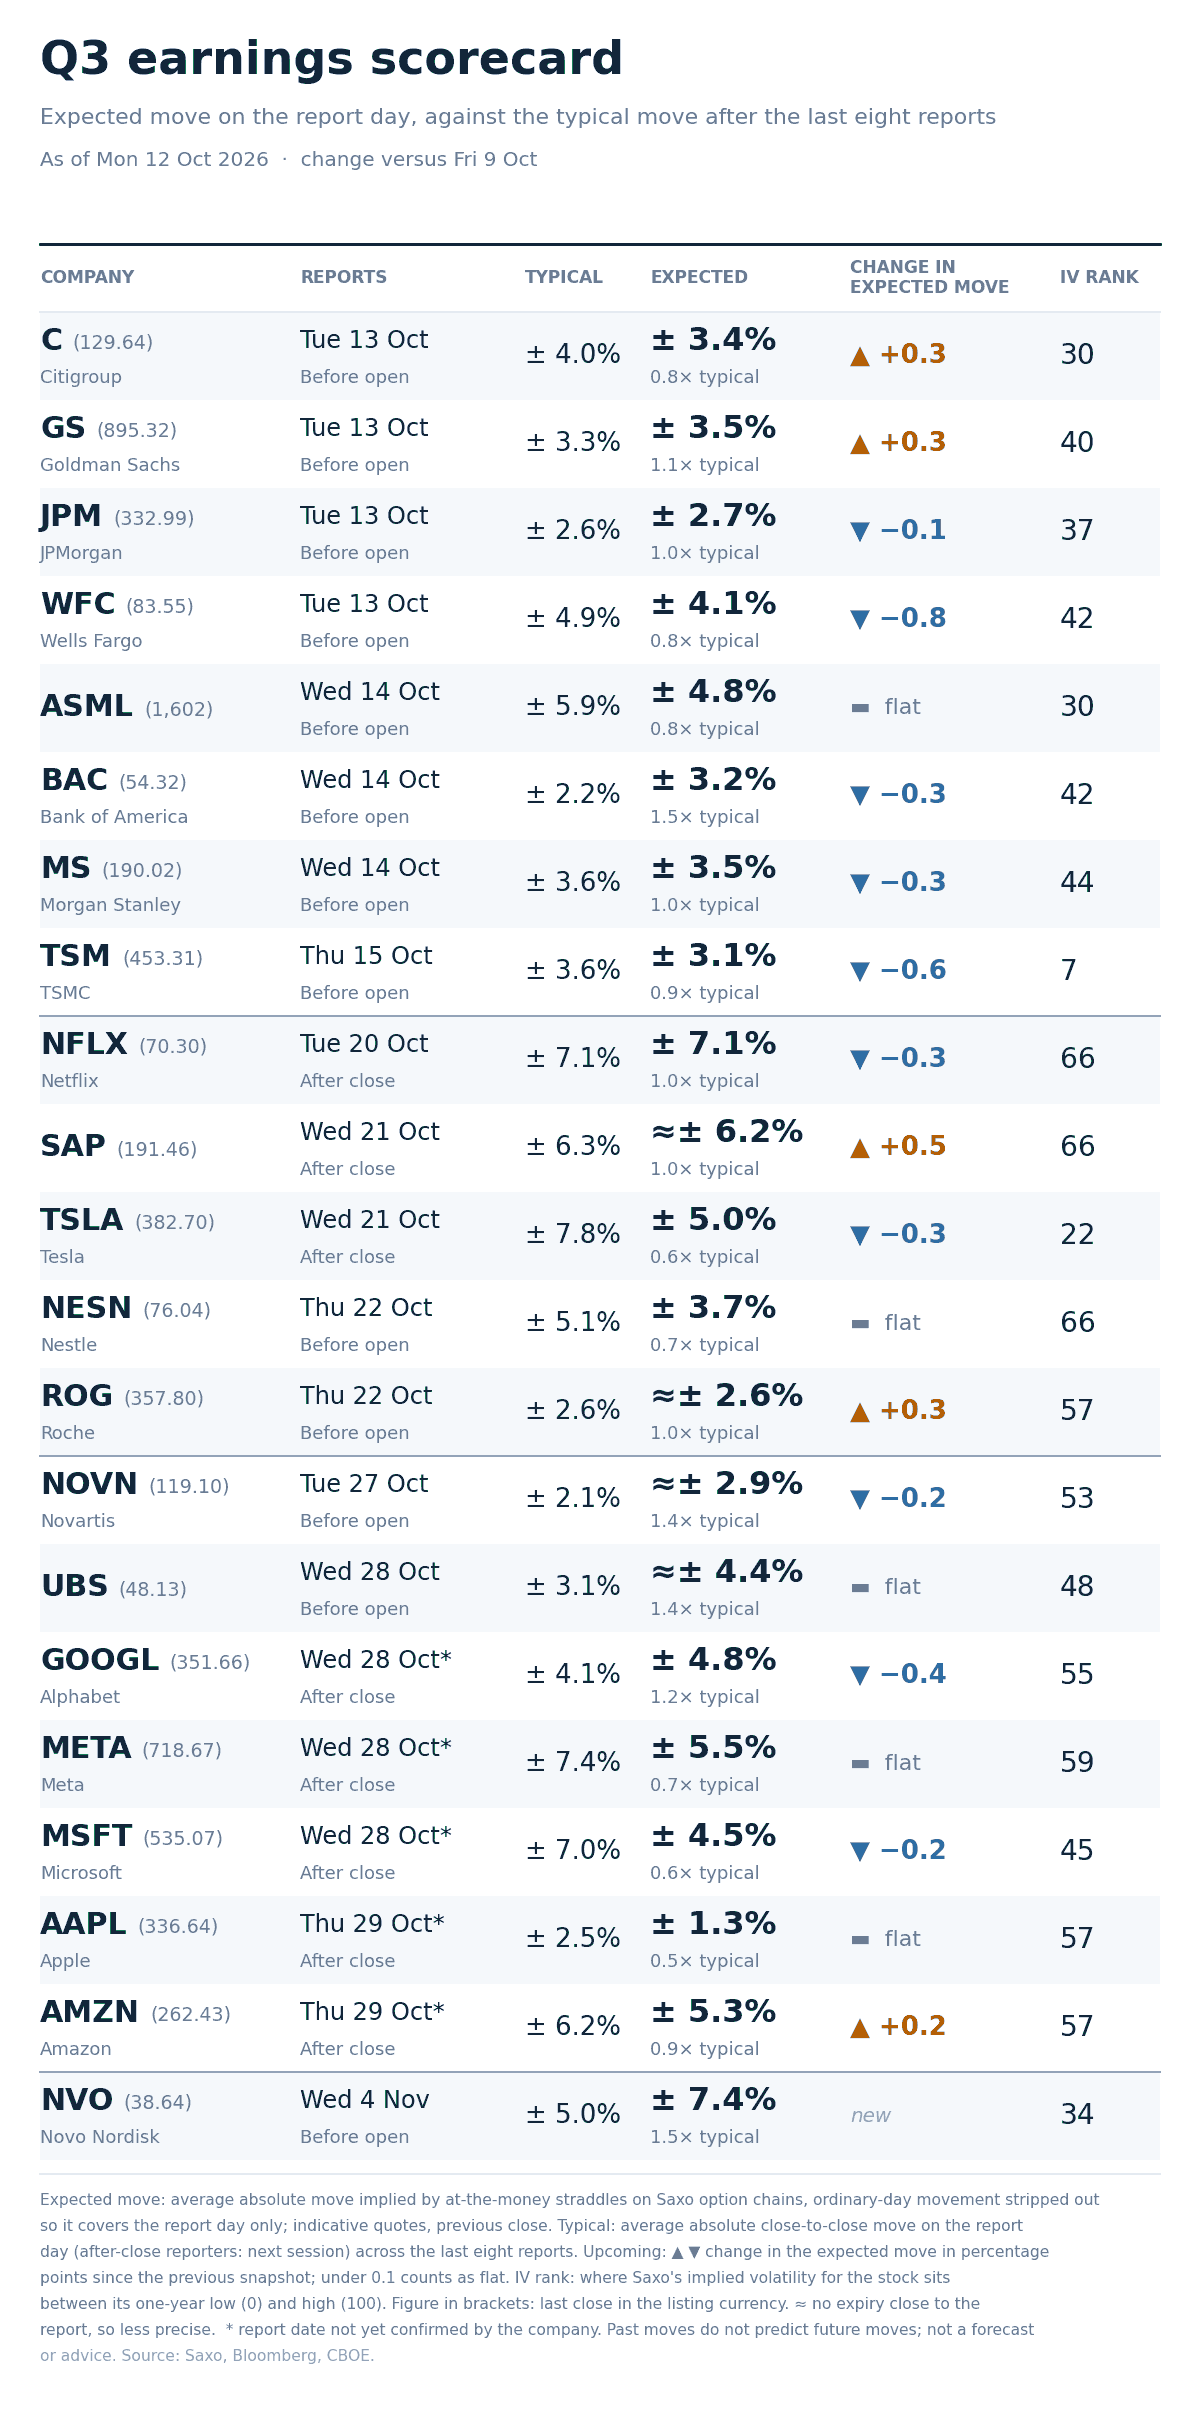
Expected move on each report day against the stock’s average move after its last eight reports, with implied-volatility rank and the last close, read from Saxo chains at approximately 06:00 CET. Quotes before the US open are indicative. Past performance is not indicative of future results.
- The spread against each name’s own record is widest at the two ends of this week’s bank block. Bank of America prices 3.2% for Wednesday against a typical 2.2%, while Wells Fargo prices 4.1% against 4.9% and Citigroup 3.4% against 4.0%.
- Rank and event premium disagree again, which is the column’s point. Taiwan Semiconductor carries a rank of 7, the lowest among this week’s reporters, and still prices 3.1% for Thursday, about nine-tenths of its own average. Morgan Stanley at rank 44 prices 3.5%, in line. In our view a cheap surface and a normally priced report may answer different questions.
- Eight names report inside four sessions. Citigroup, Goldman Sachs, JPMorgan and Wells Fargo open on Tuesday 13 October, ASML, Bank of America and Morgan Stanley follow on Wednesday, and Taiwan Semiconductor on Thursday. Options carry a high risk of rapid loss and are not suitable for every investor; see Saxo pricing for costs and charges.
What the market is pricing
- Session implied move. SPXW options price 30.6 points, or 0.39%, to tonight’s close and 82.1 points, or 1.05%, to Friday 16 October, derived from option-implied pricing. Pre-open quotes are indicative.
- What the clock did not explain. The 16 October expiry priced 99.00 points on Friday with six sessions left and 82.1 now with five, where decay alone leaves 90.4. Roughly eight points more came out than the clock explains.
- Tail risk signal. SKEW at 154.34 rose 3.45% while the spot gauge fell 3.70% and the one-day gauge 11.62%, the largest riser on the board and the only one that prices the index.
- Correlation read. Implied correlation at 11.33 and dispersion at 36.02 sit in the top quarter of their three-month ranges. In our assessment the market may be paying for single names to move while the index holds still.
Every volatility figure here comes from Friday’s close, before the weekend attacks and Brent’s spike. The front of the curve has not been tested since.
In our view that gap, a body near its quarter low against a tail within a fraction of its quarter high, is the week’s open question, and the reports give no sign of who sits on which side. Options carry a high risk of rapid loss and are not suitable for every investor.
Important note: The strategies and examples provided in this article are purely for educational purposes. They are intended to assist in shaping your thought process and should not be replicated or implemented without careful consideration. Every investor or trader must conduct their own due diligence and take into account their unique financial situation, risk tolerance, and investment objectives before making any decisions. Remember, investing in the stock market carries risk, and it’s crucial to make informed decisions.
| More from the author |
|---|