
Access all our platforms from a single account.

Three per cent of the range, one session left - Options Brief - 23 October 2026

Summary: Thursday took 93 points out of the S&P 500 and left the index four points higher on the week. The option market spent the session repricing the next few days rather than the market.
The S&P 500 is four points higher on the week and every volatility measure on the board is higher with it.
MARKET REGIME: NEUTRAL / CHOP | VIX 19.03 | TERM STRUCTURE: CONTANGO | SKEW: ELEVATED (152.39) | FRONT-MONTH VIX FUTURES: 19.410
Today in brief
The short version. Thursday’s fall was large in the index and small in the week. The S&P 500 lost 1.21% but the equal-weighted version of it rose 0.77%, and after four of five sessions the index has used 3% of the range the option market priced for this week. The repricing sat at the front of the volatility curve, where a single session now costs 0.80 of a month against 0.68 a day earlier.
Markets. The S&P 500 closed at 7,663.43 and the Nasdaq 100 fell 2.90%, with semiconductors down 5.99% and Meta 6.98% after it set out capital-spending plans of 135 to 145 billion dollars a year. Utilities, healthcare and financials all rose. US Treasuries had their strongest session in more than two years and the ten-year closed below 5% for the first time in a month, at 4.97%. Brent held near 114 dollars while gold slipped below 4,000. Europe fell about a per cent with euro-zone banks down 4.17%, and Asia steadied overnight.
Volatility curve. All fourteen measures on the chart rose. The one-day gauge gained 33.39% to 15.18 and the nine-day 21.76%, against 2.68% for the one-year. The bond gauge added 11.36% to 106.85. The front VIX future is November at 19.410, above December at 19.270, while the cash curve still slopes upward throughout. Implied correlation rose 13.48% to 14.56 and dispersion held at 37.80.
Single names. The index moved further than the names inside it. Median implied-volatility rank rose to 46.7 from 42.8 across 187 US underlyings, a shallow drift, while the Nasdaq 100 fund’s own implied volatility rose 20.9% and its rank to 72.3 from 43.0. High rank sits in consumer discretionary and energy, not in the names that fell.
Flow. Yesterday’s ten reports gave no readable direction. The two lines that did carry a side were credit hedges, not equity ones.
This week’s range. The S&P 500 has used 3% of its band and gold 166%, closing below the lower bound. The Nasdaq 100 fund has used 29% and the bitcoin fund 5%.
Earnings and catalysts. UBS is priced at 2.1x its own eight-report history into Wednesday and Apple at 0.4x into Thursday. Today brings euro-zone and US flash activity surveys, with both US releases landing inside the session that today’s expiry settles on. The 30 October expiry, which covers the 28 October Federal Reserve decision, prices 1.895%.
What it adds up to. Today’s expiry prices 0.723%, against 59.60 points quoted for this same contract a session ago when decay alone would have left about 42.1. In our view that may be better read as a repricing of the next few days than of the market.
That is the whole brief in one read. The sections below hold the detail behind each paragraph, with the charts, the full set of readings and the sources, for when you want to go deeper on one part.
Headline driver
US Treasuries had their strongest session in more than two years. The two-year yield fell close to 20 basis points at one point before settling near 4.65%, and the ten-year ended below 5% for the first time in a month, at 4.97%. The move came out of equities rather than the data: US initial jobless claims fell 6,000 to 194,000, the lowest since mid-July.
Driving it was a second day of doubt about the return on artificial-intelligence spending. Meta fell 6.98% despite beating on revenue, as investors weighed annual capital-spending plans of 135 to 145 billion dollars and a new class of non-voting shares created to help pay for them. The Philadelphia Semiconductor Index dropped 6.7%.
Oil pulled the other way. Brent held near 114 dollars on attacks against Saudi infrastructure, leaving an inflation risk underneath a bond rally built on the opposite worry.
Market snapshot
- US (Thursday 22 October close): S&P 500 7,663.43, down 1.21%. Nasdaq 100 28,958.69, down 2.90%. Dow Jones Industrial Average 52,873.28, up 0.02%. The equal-weighted S&P 500 rose 0.77%, while semiconductors fell 5.99% and technology 3.29%. Utilities, healthcare and financials all gained.
- Europe: the Stoxx 600 fell 1.05% to 637.75 and the Euro Stoxx 50 1.94%, with the DAX down 1.07%. Euro-zone banks fell 4.17%. ASML lost 5%. The German to French ten-year spread closed above 174 basis points, its widest of the cycle since 2012.
- Asia (Friday morning): the Hang Seng was up 0.58% at 23,066.79 while the CSI 300 eased 0.54%. The Nikkei 225 fell 0.6% and the Kospi recovered from an early decline of nearly 4% to close to flat. Taiwan was shut for a typhoon.
- Commodities and rates: Brent traded at 113.65 and WTI at 100.05. Gold futures eased 0.77% to 4,029.20 and the gold fund 2.63%, with spot gold slipping below 4,000 overnight. Silver hit an eleven-month low near 54 and gold miners lost 5.80%. The ten-year yield was 4.966%, the thirty-year 5.292% and the two-year 4.654%, each down. Bitcoin held at 81,770 while the largest bitcoin fund fell 3.72%.
- Market regime: neutral and choppy, the VIX at 19.03, the cash curve in contango and SKEW elevated at 152.39.
All figures from the watchlist export taken at 06:00 CET on 23 October 2026. Past performance is not indicative of future results. Source: Saxo, Bloomberg, CBOE.
Volatility surface
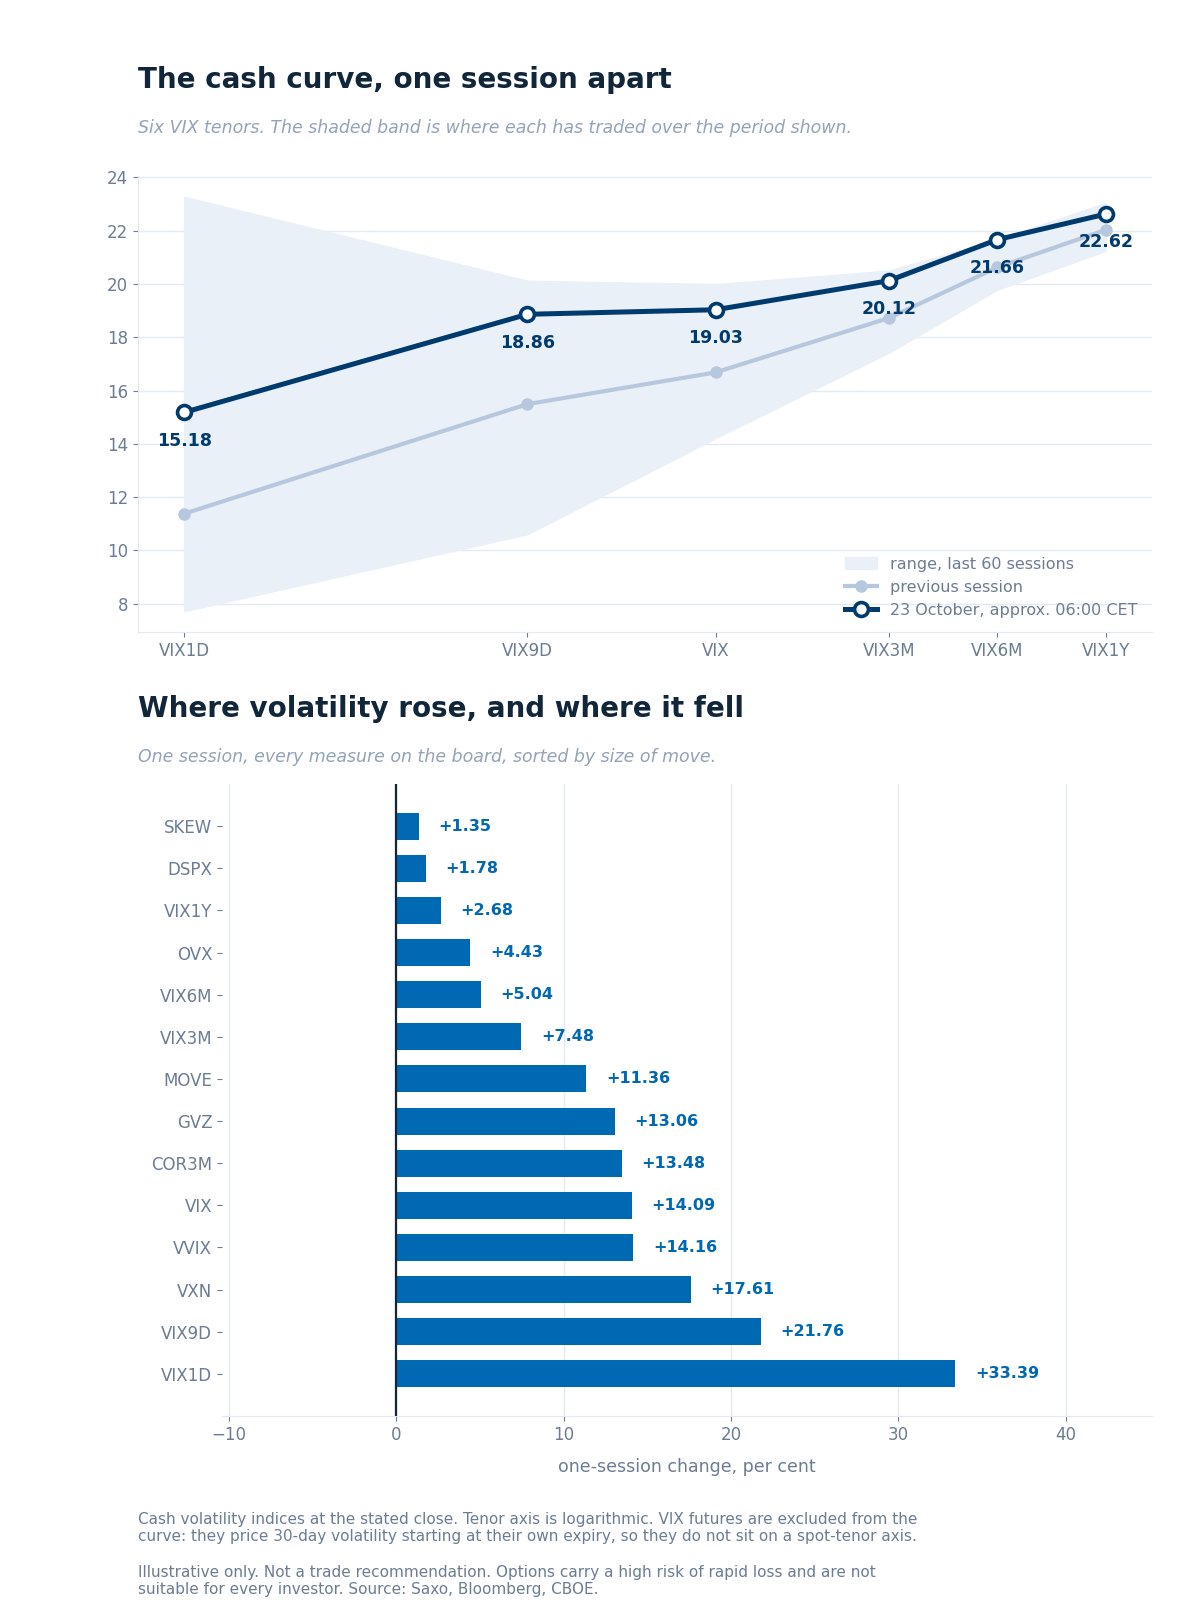
The cash curve against the previous session, over each tenor’s 60-session range, with the one-session change across every measure on the board. Source: Saxo, Bloomberg, CBOE.
Every one of the fourteen measures on the chart rose, which is the most useful single fact about the session. The front moved most: VIX1D gained 33.39% to 15.18 and VIX9D 21.76% to 18.86, against 2.68% for the one-year. The curve now sits in the upper half of its sixty-session band rather than the bottom.
Ratios. VIX1D/VIX reads 0.80 against 0.68, so a single session is priced much closer to a month than it was. VIX3M/VIX fell to 1.06 from 1.12 as the front came up toward the back. VXN/VIX rose to 1.51 from 1.46, the Nasdaq gauge at 28.72, which is where the repricing concentrated.
VIX futures. The front is November at 19.410 and the second December at 19.270, a ratio of 1.005. The series rolled on Wednesday 21 October, so both of this week’s readings are the same November contract: it rose 0.710 while spot rose 2.35, compressing the premium to spot to 0.38 points from 2.02. The cash curve still slopes upward throughout, so the kink sits in the futures alone, and the November window carries the 28 October Federal Reserve decision, mega-cap results and the 3 November midterms.
Rates and correlation. The bond gauge rose 11.36% to 106.85 and gold volatility 13.06% to 24.15. Implied correlation rose 13.48% to 14.56 and dispersion 1.78% to 37.80.
Single-name volatility
The index measures above moved further than the names inside them. On an identical 187 US underlyings the median implied-volatility rank rose to 46.7 from 42.8, and on the common set of 337 euro-zone names to 47.6 from 45.9. Median implied volatility across the valid common set of 524 names rose 0.74 of a point to 33.53. The share of US names above rank 50 rose to 44.9% from 36.9%.
So the single-name surface rose broadly and shallowly: 197 of the 524 names gained more than five points of rank and 44 lost more than five. That is a drift, not a shock.
The sharp repricing sat in the funds. Implied volatility on the Nasdaq 100 fund rose 20.9% and its rank to 72.3 from 43.0, the semiconductor fund to rank 50.9 from 31.4, while single-name implied volatility mostly moved between zero and ten per cent. In our view that gap is what an index-level event looks like in the surface, and may be why implied correlation rose while dispersion barely moved.
High rank is not where the selling was. Among US names the highest median ranks sit in consumer discretionary at 69.0 and energy at 66.5, against 39.8 for semiconductors. Nvidia’s rank rose to 53.6 from 36.6, while Meta’s fell to 42.6 from 63.9 as its event premium came out after reporting. One caveat: the mega-caps’ front expiry is today, so a one-session change carries a roll effect too.
Source: Saxo.
Options flow sentiment
Based on end-of-day 22 October, yesterday’s positioning, not today’s price action.
- Single-name flow gave no readable direction. Across the ten reports the large lines are deep in-the-money put packages, rolls and mid-market prints with no side, and the put-heavy premium split is an intrinsic-value artefact rather than a view.
- Sector and ETF flow was equally unreadable, with two exceptions worth naming: confirmed ask-side buying of high-yield credit downside, and a far out-of-the-money regional-bank put bought ahead of next week’s Federal Reserve decision. Both are credit hedges rather than equity ones.
Where the week's range sits
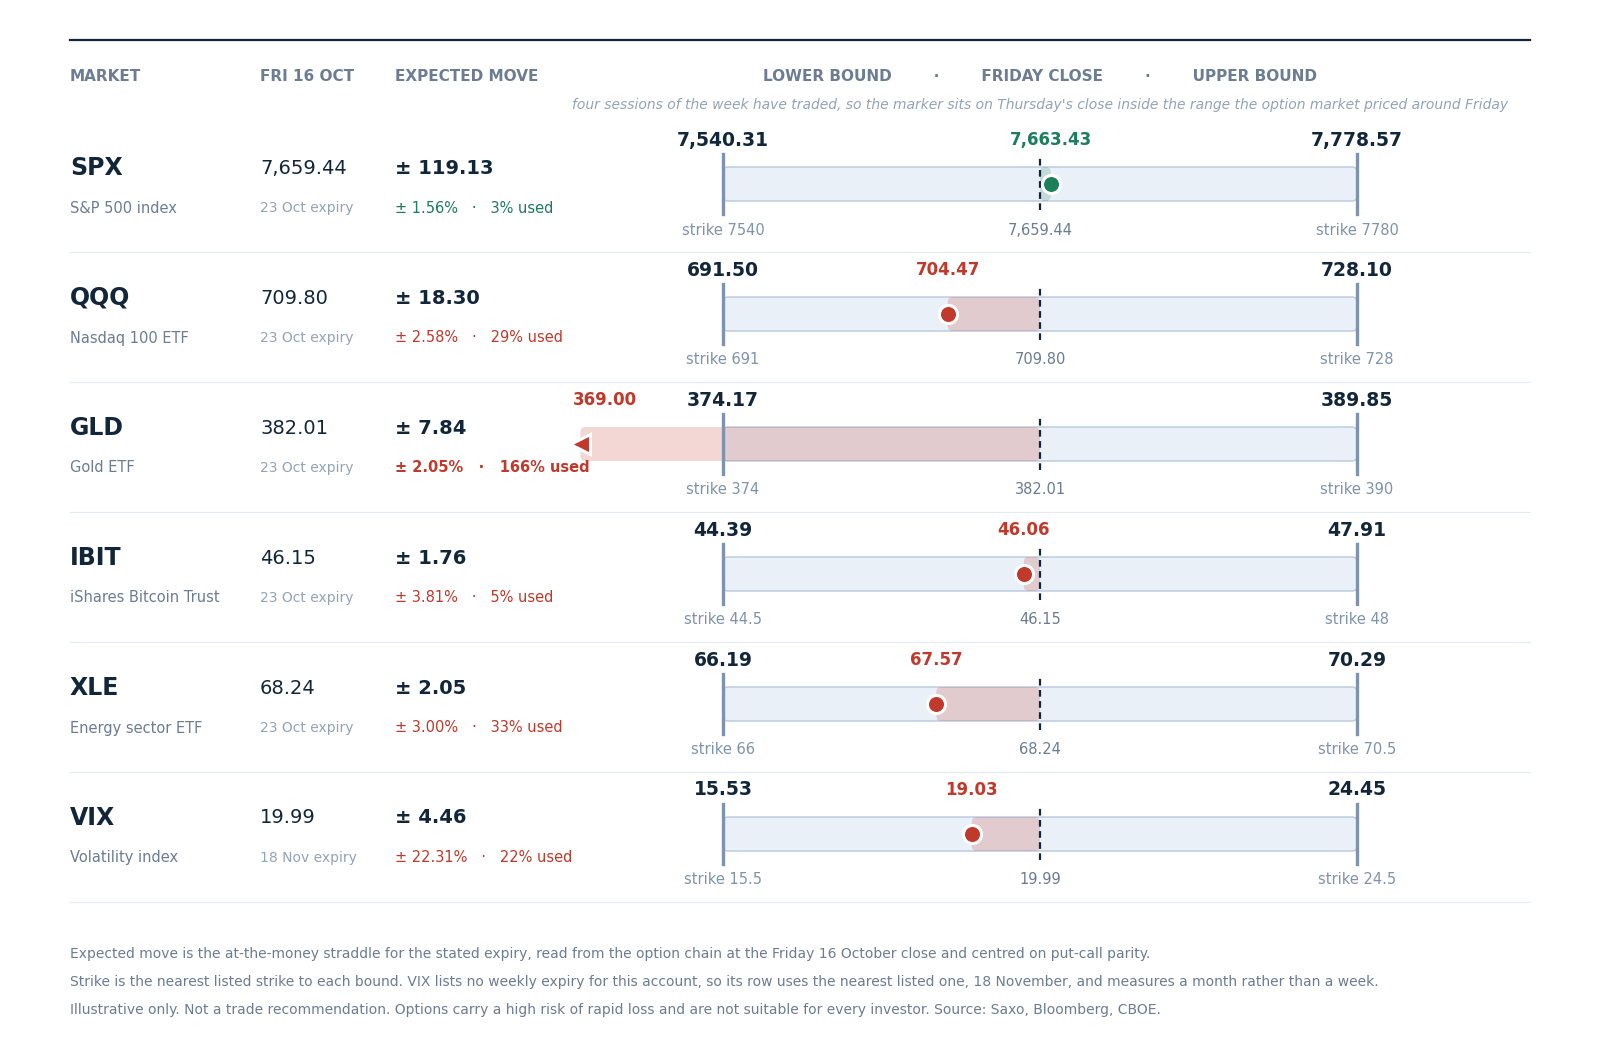
The range the option market priced for this week around Friday 16 October’s close, with the nearest listed strike at each bound. Four sessions have traded, so the marker sits on Thursday’s close. Straddles come from the Saxo chain at Friday’s close, centred on put-call parity. Illustrative only, not a trade recommendation. Past performance is not indicative of future results. Source: Saxo, Bloomberg, CBOE.
Four sessions in, the S&P 500 has used 3% of the 119.13 points, 1.56%, priced around Friday’s close, and sits 3.99 points above where the week started. Thursday’s 93.74 point fall gave back the four sessions before it rather than opening a new range.
Gold is the other extreme, at 166% of its band, closing at 369.00 against a lower bound of 374.17. That range finished before the week did.
Between them, the Nasdaq 100 fund has used 29% downward, energy 33% and the bitcoin fund 5%. The volatility row uses the nearest listed expiry, 18 November, so it measures a month and does not compare with the five above it.
Options carry a high risk of rapid loss and are not suitable for every investor. Costs and charges apply and vary by account and venue; check the rates applicable to you.
Today's catalysts
- 08:00 CET UK September retail sales.
- 09:15 to 10:30 CET October flash purchasing managers’ indices for France, Germany, the euro zone and the UK, with ECB consumer inflation expectations at 10:00.
- 15:45 CET US October flash purchasing managers’ index, then University of Michigan sentiment for October at 16:00.
- Earnings today: American Express, Eni and SLB.
Both US releases land after the 15:30 CET cash open and well before the 22:00 CET close, so today’s expiry settles on the reaction to them rather than on the run-up.
Earnings scorecard
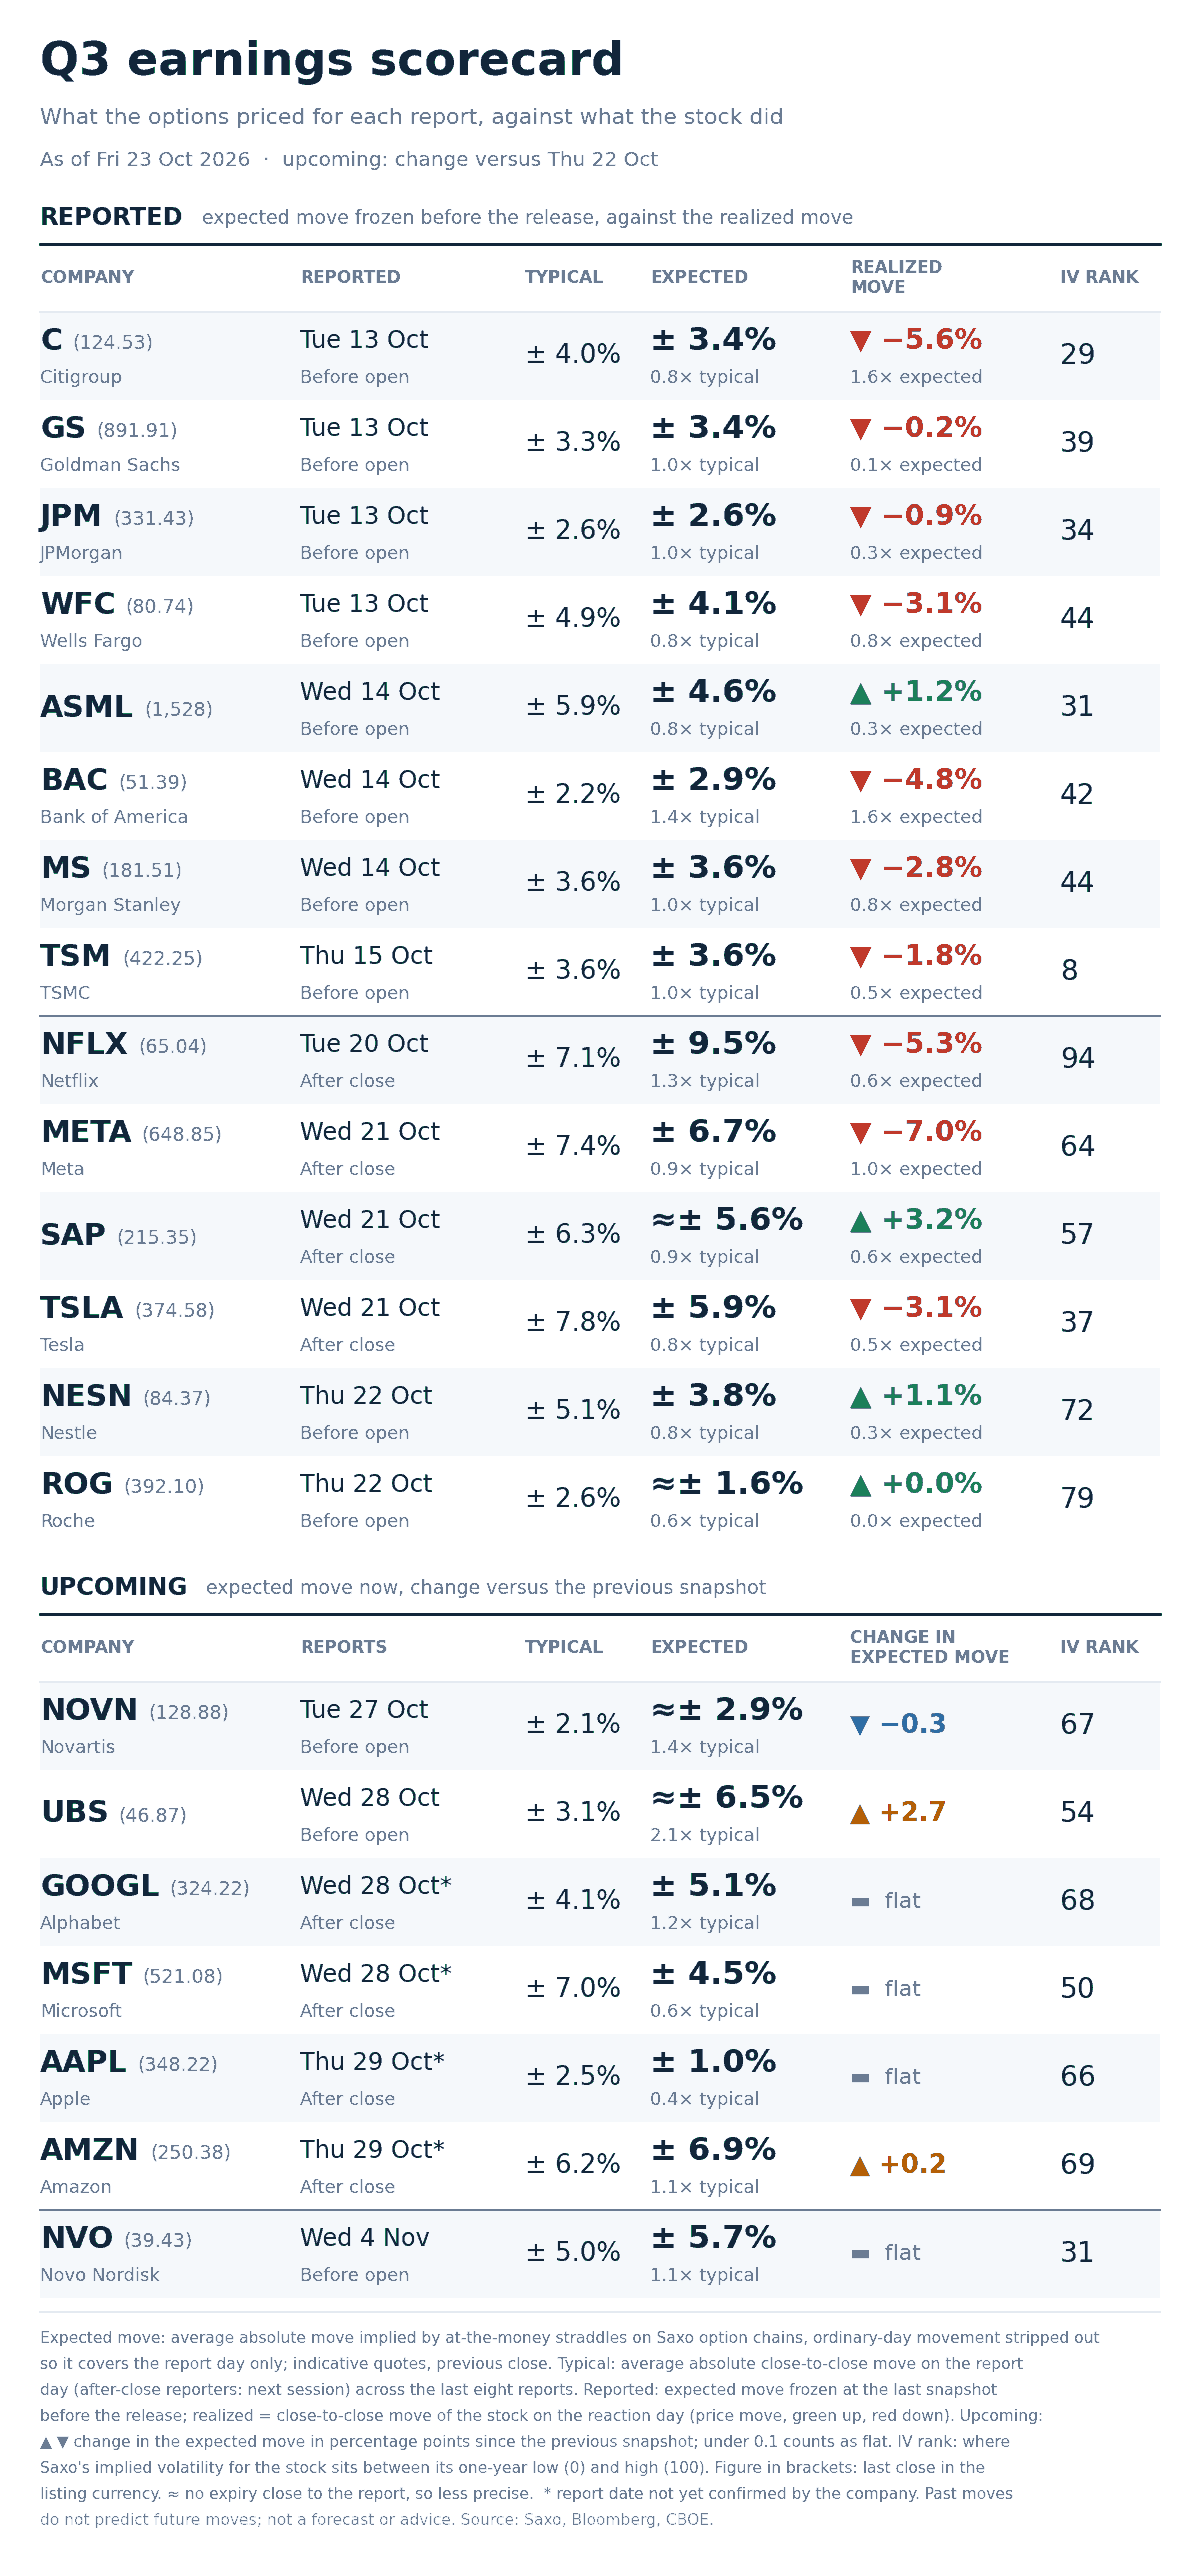
Option-implied expected move for each report day against the stock’s average move after its last eight reports, for the twenty-one names tracked this season. Arrows show whether an expected move rose or eased since the previous day. Past performance is not indicative of future results. Source: Saxo, Bloomberg, CBOE.
The spread between what is priced and what each name has done runs from 2.1x to 0.4x. UBS is richest, at 6.5% into Wednesday against an eight-report average of 3.1%, after its expected move rose 2.7 points in a day. Apple is cheapest, at 1.0% against 2.5%, with Microsoft next at 4.5% against 7.0%.
Rank and the event premium answer different questions, and the board shows it plainly. Novartis carries a rank of 67 and prices 2.9%; Apple almost the same at 66 and prices 1.0%; UBS sits lower at 54 and prices the widest move. Rank measures where a name sits in its own year. The event premium measures one day.
Meta is the completed example: priced at 6.7%, it moved 7.0%. Next are Novartis on Tuesday, UBS, Alphabet and Microsoft on Wednesday, and Apple and Amazon on Thursday.
Options carry a high risk of rapid loss and are not suitable for every investor. Costs and charges apply and vary by account and venue; check the rates applicable to you.
What the market is pricing
- Session implied range: SPX options price 55.45 points, 0.723%, for today’s expiry. A session ago the same contract was quoted at 59.60 points with two sessions left. The clock alone would have left about 42.1, so roughly 13.3 points went in beyond the decay. That is the clearest measure of the front-end repricing.
- Event implied range: the 30 October expiry prices 145.40 points, 1.895%, covering the 28 October Federal Reserve decision. No recent edition quoted that expiry, so there is no like-for-like comparison to draw.
- Tail risk signal: SKEW rose 2.03 points to 152.39 and the tail-risk index 28.74%. The tail was already expensive and got more so, on a session when the index fell only 1.21%.
- Correlation read: implied correlation rose 13.48% to 14.56 while dispersion held at 37.80. In our view the market may have begun paying for names to move together again, though 14.56 is still low and one session does not make a regime.
In our view the session may be better read as a repricing of the next few days than of the market. The index gave back its week, the front of the curve took the adjustment, and the names inside it moved far less than the funds tracking them.
Options carry a high risk of rapid loss and are not suitable for every investor. Costs and charges apply and vary by account and venue; check the rates applicable to you. Past performance is not indicative of future results.
| More from the author |
|---|