
Access all our platforms from a single account.

The markdown was all in the wings - Options Brief - 22 October 2026

Summary: Crash protection got ten points cheaper on Wednesday while the price of the next two sessions barely moved. Yesterday’s flow, where it had a readable side, was still buying downside.
The cheapest thing in the option market on Wednesday was protection against a crash.
MARKET REGIME: LOW VOL BULL | VIX 16.68 | TERM STRUCTURE: CONTANGO | SKEW: ELEVATED (150.36) | FRONT-MONTH VIX FUTURES: 18.700
Today in brief
The short version. Friday’s at-the-money price on the S&P 500 came off by close to what one fewer session alone would take, so in our view implied volatility at the money barely moved. What did move sat away from the money: CBOE SKEW down 10.04 points to 150.36, the tail-risk index down 11.50% and the bond gauge down 5.66% to 95.95.
Markets. The S&P 500 rose 0.58% to 7,757.17 on Wednesday and the Nasdaq 100 1.13% on results. After the close Meta gained 2.2% and Tesla slipped 3.3% despite beating on profit. Asia then reversed it: the Kospi fell more than 3%, the Nikkei around 2% and the Hang Seng 2.7%, with SK Hynix off nearly 6%. Brent sits above 111 after a drone strike on a Saudi oil field.
Volatility curve. The cash curve fell in the middle and held at both ends. VIX9D lost 4.79% to 15.49 and the thirty-day 3.64% to 16.68, while the one-day gauge rose 1.61% to 11.38 and the one-year was unchanged at 22.03. The VIX future series rolled on Wednesday, so the front is November at 18.700.
Single names. On an identical 187 US underlyings the median implied-volatility rank fell to 42.8 from 46.1, and on the common set of 337 euro-zone names to 45.9 from 49.0. The typical single name stepped back from its own year by about three points of rank, on both sides of the Atlantic.
Flow. Yesterday’s ten reports gave no readable direction, with the largest lines rolls and mid-market prints. Where a side was marked it was downside being bought, in financials, consumer staples and energy, which runs the other way from the markdown.
This week’s range. Three sessions in, the S&P 500 has used 82% of the 1.56% priced for the week and the bitcoin fund 96%, both upward, against energy at 4%.
Earnings and catalysts. Novartis is priced at 1.5x its own eight-report history into Tuesday and Apple at 0.4x into 29 October. Today brings US weekly jobless claims at 14:30 CET and ten sets of results, including Valero at the top of the US rank board.
What it adds up to. Today’s expiry prices 0.535% and Friday’s 0.768%, against 73.80 points quoted for that same Friday a session ago when decay alone would have left about 60.3. In our view the option market cut the price of protection it is not using and left the next two sessions alone.
That is the whole brief in one read. The sections below hold the detail behind each paragraph, with the charts, the full set of readings and the sources, for when you want to go deeper on one part.
Headline driver
The S&P 500 rose 0.58% to 7,757.17 on Wednesday and the Nasdaq 100 added 1.13%, as results rather than macro drove the session’s news. SpaceX jumped 7.8% after its first profit as a public company and Super Micro Computer 9.6% on stronger guidance. After the close Meta gained 2.2% on strong results, a larger artificial-intelligence investment plan and a proposed two-for-one split of its non-voting shares. Tesla slipped 3.3% despite beating on profit, its reduced capital-spending plans disappointing.
Asia then reversed the lot. By the European morning the Kospi was down more than 3%, the Nikkei 225 around 2% and the Hang Seng 2.7%, with Samsung Electronics off more than 4%, SK Hynix nearly 6%, SoftBank 5.6% and Tokyo Electron 5.9%. The question being asked is whether spending on artificial-intelligence infrastructure converts into profit. The Bank of Korea left rates at 3%.
Market snapshot
- US (Wednesday 21 October close): S&P 500 7,757.17, up 0.58%. Nasdaq 100 29,822.52, up 1.13%. Dow Jones Industrial Average 52,861.30, up 0.69%. Technology led at 1.67% and semiconductors gained 1.89%, while communication services fell 1.11% and the equal-weighted S&P managed 0.34%.
- Europe: the Stoxx 600 rose 0.92% to 644.50 and the Euro Stoxx 50 1.40%, with the DAX up 1.35% and the CAC 40 1.06%. Randstad gained 20.2% and EssilorLuxottica 15.5% on results, Carrefour fell 13.8%, and the French ten-year closed at 5.013%, its first close above 5% in more than twenty-four years, taking the German to French spread to its widest since 2012.
- Asia (Thursday morning): the Hang Seng was down 2.87% at 22,971.93, its Tech index 4.64%, the Kospi 2.85% and the CSI 300 1.26%.
- Commodities and rates: Brent traded at 110.52 and WTI at 98.52 at the 06:00 CET pull, up 1.56% and 1.41%, and Brent pushed above 111 later in the morning after a drone strike on a Saudi oil field. Gold eased 0.99% to 4,109.10 and silver 2.21% to 56.44. The US ten-year yield was 5.086%, the thirty-year 5.380% and the two-year 4.780%. Bitcoin slipped 2.02% to 82,905.
- Market regime: low volatility bull, the VIX at 16.68, the cash curve in contango and SKEW elevated at 150.36.
All figures from the watchlist export taken at 06:00 CET on 22 October 2026. Past performance is not indicative of future results. Source: Saxo, Bloomberg, CBOE.
Volatility surface
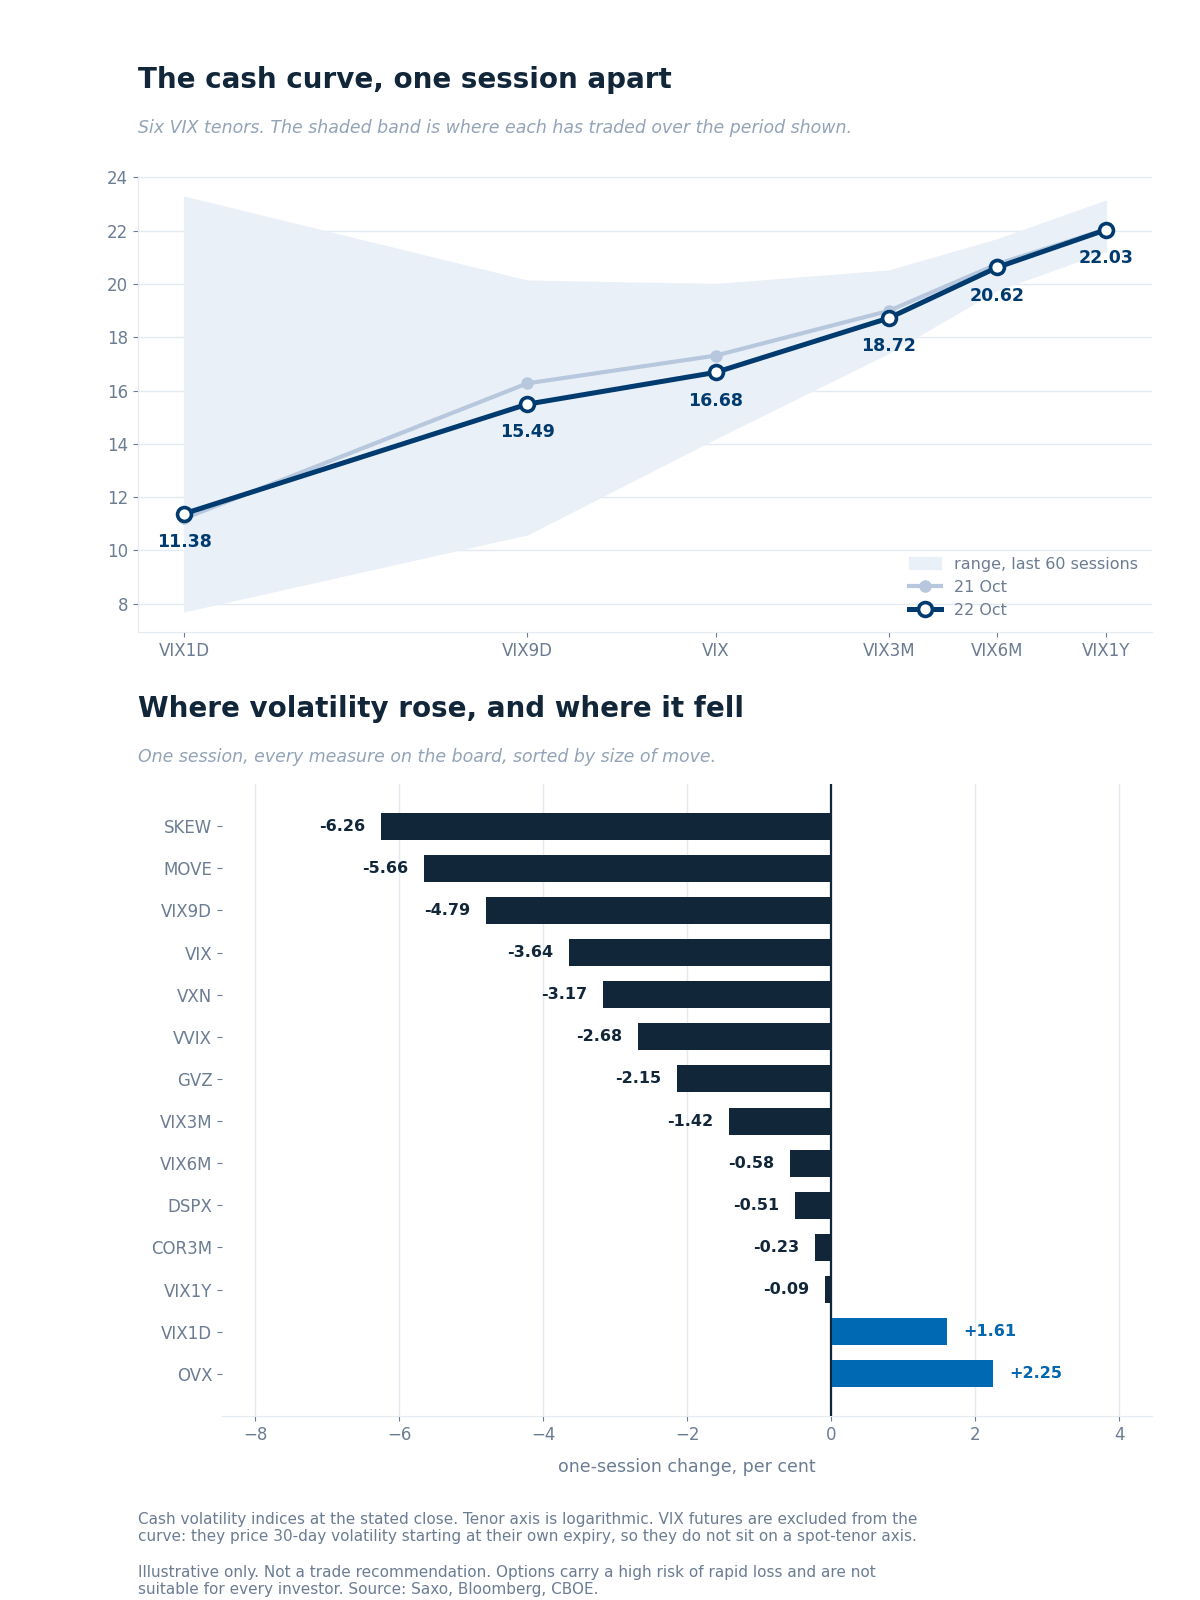
The cash curve against the previous session, over each tenor’s 60-session range, with the one-session change across every measure on the board. Source: Saxo, Bloomberg, CBOE.
The two largest moves of the session were both measures of the tail. CBOE SKEW fell 10.04 points to 150.36 and the tail-risk index 11.50% to 15.33, with VVIX off 2.68%. The cash curve came down in the middle and held at the ends: VIX9D lost 4.79% to 15.49 and the thirty-day 3.64% to 16.68, while VIX1D rose 1.61% to 11.38 and the one-year held at 22.03, near the top of its sixty-session range.
Ratios. VIX1D/VIX reads 0.68 against 0.65, so the day is priced richer relative to the month than it was. VIX3M/VIX rose to 1.12 from 1.10 as the front fell away from the back. VXN/VIX held at 1.46, the Nasdaq gauge at 24.42.
VIX futures. The series rolled during Wednesday’s session, so the front is November at 18.700 and the second December at 18.830, a ratio of 0.995. Against the same November contract at 18.650 a session ago the front barely moved while spot fell 0.63, widening the premium to spot to 2.02 points from 1.34. That window carries the 28 October Federal Reserve decision.
Rates and correlation. The bond gauge fell 5.66% to 95.95 and gold volatility 2.15% to 21.36, while oil volatility rose 2.25% to 53.28, now 3.20 times the equity gauge against 3.01. Correlation and dispersion were near unchanged at 12.83 and 37.14.
Single-name volatility
On an identical 187 US option underlyings read this morning, the median implied-volatility rank fell to 42.8 from 46.1, and the share of names above rank 50 dropped to 36.9% from 42.2%. The share below rank 20 rose to 16.0% from 12.3%. On the common set of 337 euro-zone names, where the universe changed by one name between runs, the median fell to 45.9 from 49.0 and the share above 50 to 42.7% from 48.4%.
So the index measures above did not move alone. The typical single name also stepped back from its own year, on both sides of the Atlantic, by roughly the same three points of rank.
The US median rank is 42.8 while the median percentile is 58.3, which is not a contradiction. Rank measures where today sits between the year’s highest and lowest readings; percentile measures how many days of the year were lower. A single spike sets the high and pulls every rank down, so a name can sit below the midpoint of its range and above the midpoint of its days at once.
A handful of names sit the other way round, with rank well under percentile. The high-yield credit fund reads rank 24 against percentile 76, the seven-to-ten year Treasury fund 52 against 90 and the biotech fund 39 against 77. In our view those are the quietly expensive corners: far from this year’s extremes, yet above almost every day of it.
Source: Saxo.
Options flow sentiment
Based on end-of-day 21 October, yesterday’s positioning, not today’s price action.
- Single-name flow gave no readable direction. Across the ten reports the largest lines are rolls, one order printed many times, and mid-market lines with no side, several carrying a conviction label of two or three out of five, and removing one block changes the headline call-versus-put split in both the energy and the semiconductor sets.
- Sector and ETF flow leans the other way from the markdown. Where a side was marked, it was downside being bought rather than sold: long-dated puts stacked across the financials fund and the money-centre banks together, opening put buying in consumer staples spanning the Federal Reserve meeting, and ask-side put buying in energy. One caveat matters: the pipeline drops closing trades, so this set cannot show hedges being lifted even where they were.
Where the week's range sits
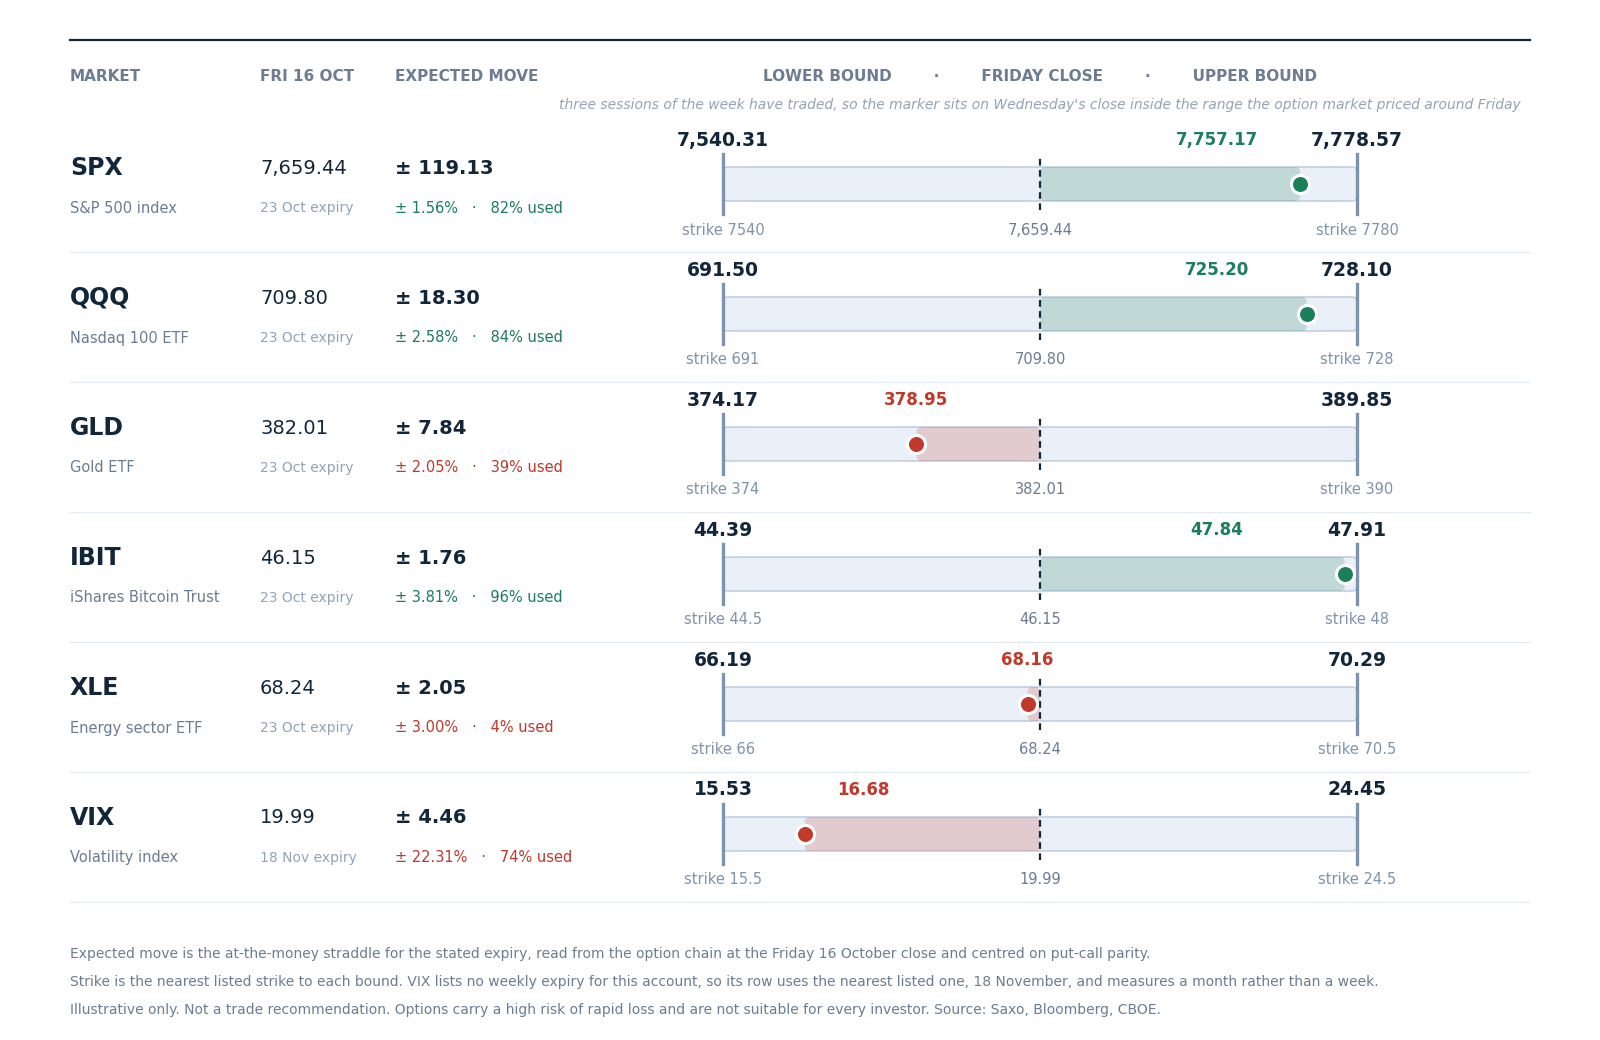
The range the option market priced for this week around Friday 16 October’s close, with the nearest listed strike at each bound. Three sessions have traded, so the marker sits on Wednesday’s close. Straddles are read from the Saxo chain at Friday’s close and centred on put-call parity. Illustrative only, not a trade recommendation. Past performance is not indicative of future results. Source: Saxo, Bloomberg, CBOE.
Three sessions in, the S&P 500 has used 82% of the 119.13 points, 1.56%, priced around Friday’s close, against three of five sessions gone, all of it upward.
The bitcoin fund has used 96%, closing at 47.84 against an upper bound of 47.91, so that band may be effectively finished with two sessions left. The Nasdaq 100 fund has used 84%, also upward, and gold 39% downward. Energy has used 4%, the quietest row in a week when Brent rose.
The volatility row uses the nearest listed expiry, 18 November, so it measures a month and is not comparable with the five above it.
Options carry a high risk of rapid loss and are not suitable for every investor. Costs and charges apply and vary by account and venue; check the rates applicable to you before entering any position.
Today's catalysts
- 08:45 CET France October confidence surveys.
- 13:00 CET Turkey central bank rate decision.
- 14:30 CET US weekly initial jobless claims, the only US data point of the session.
- 01:01 CET Friday UK October GfK consumer confidence, then Japan’s September national CPI at 01:30 and the October flash manufacturing and services PMIs at 02:30.
- Earnings today: Procter and Gamble, Gilead Sciences, Union Pacific, Western Digital, Valero Energy, Blackstone, Newmont, Lockheed Martin, Spotify and Atlas Copco. Friday brings ExxonMobil, American Express, Eni and SLB.
Two of today’s names sit at the extremes of the volatility board. Valero carries the highest implied-volatility rank of the 187 US underlyings at 98.4, and Newmont reports into a gold price that eased on Wednesday.
Earnings scorecard
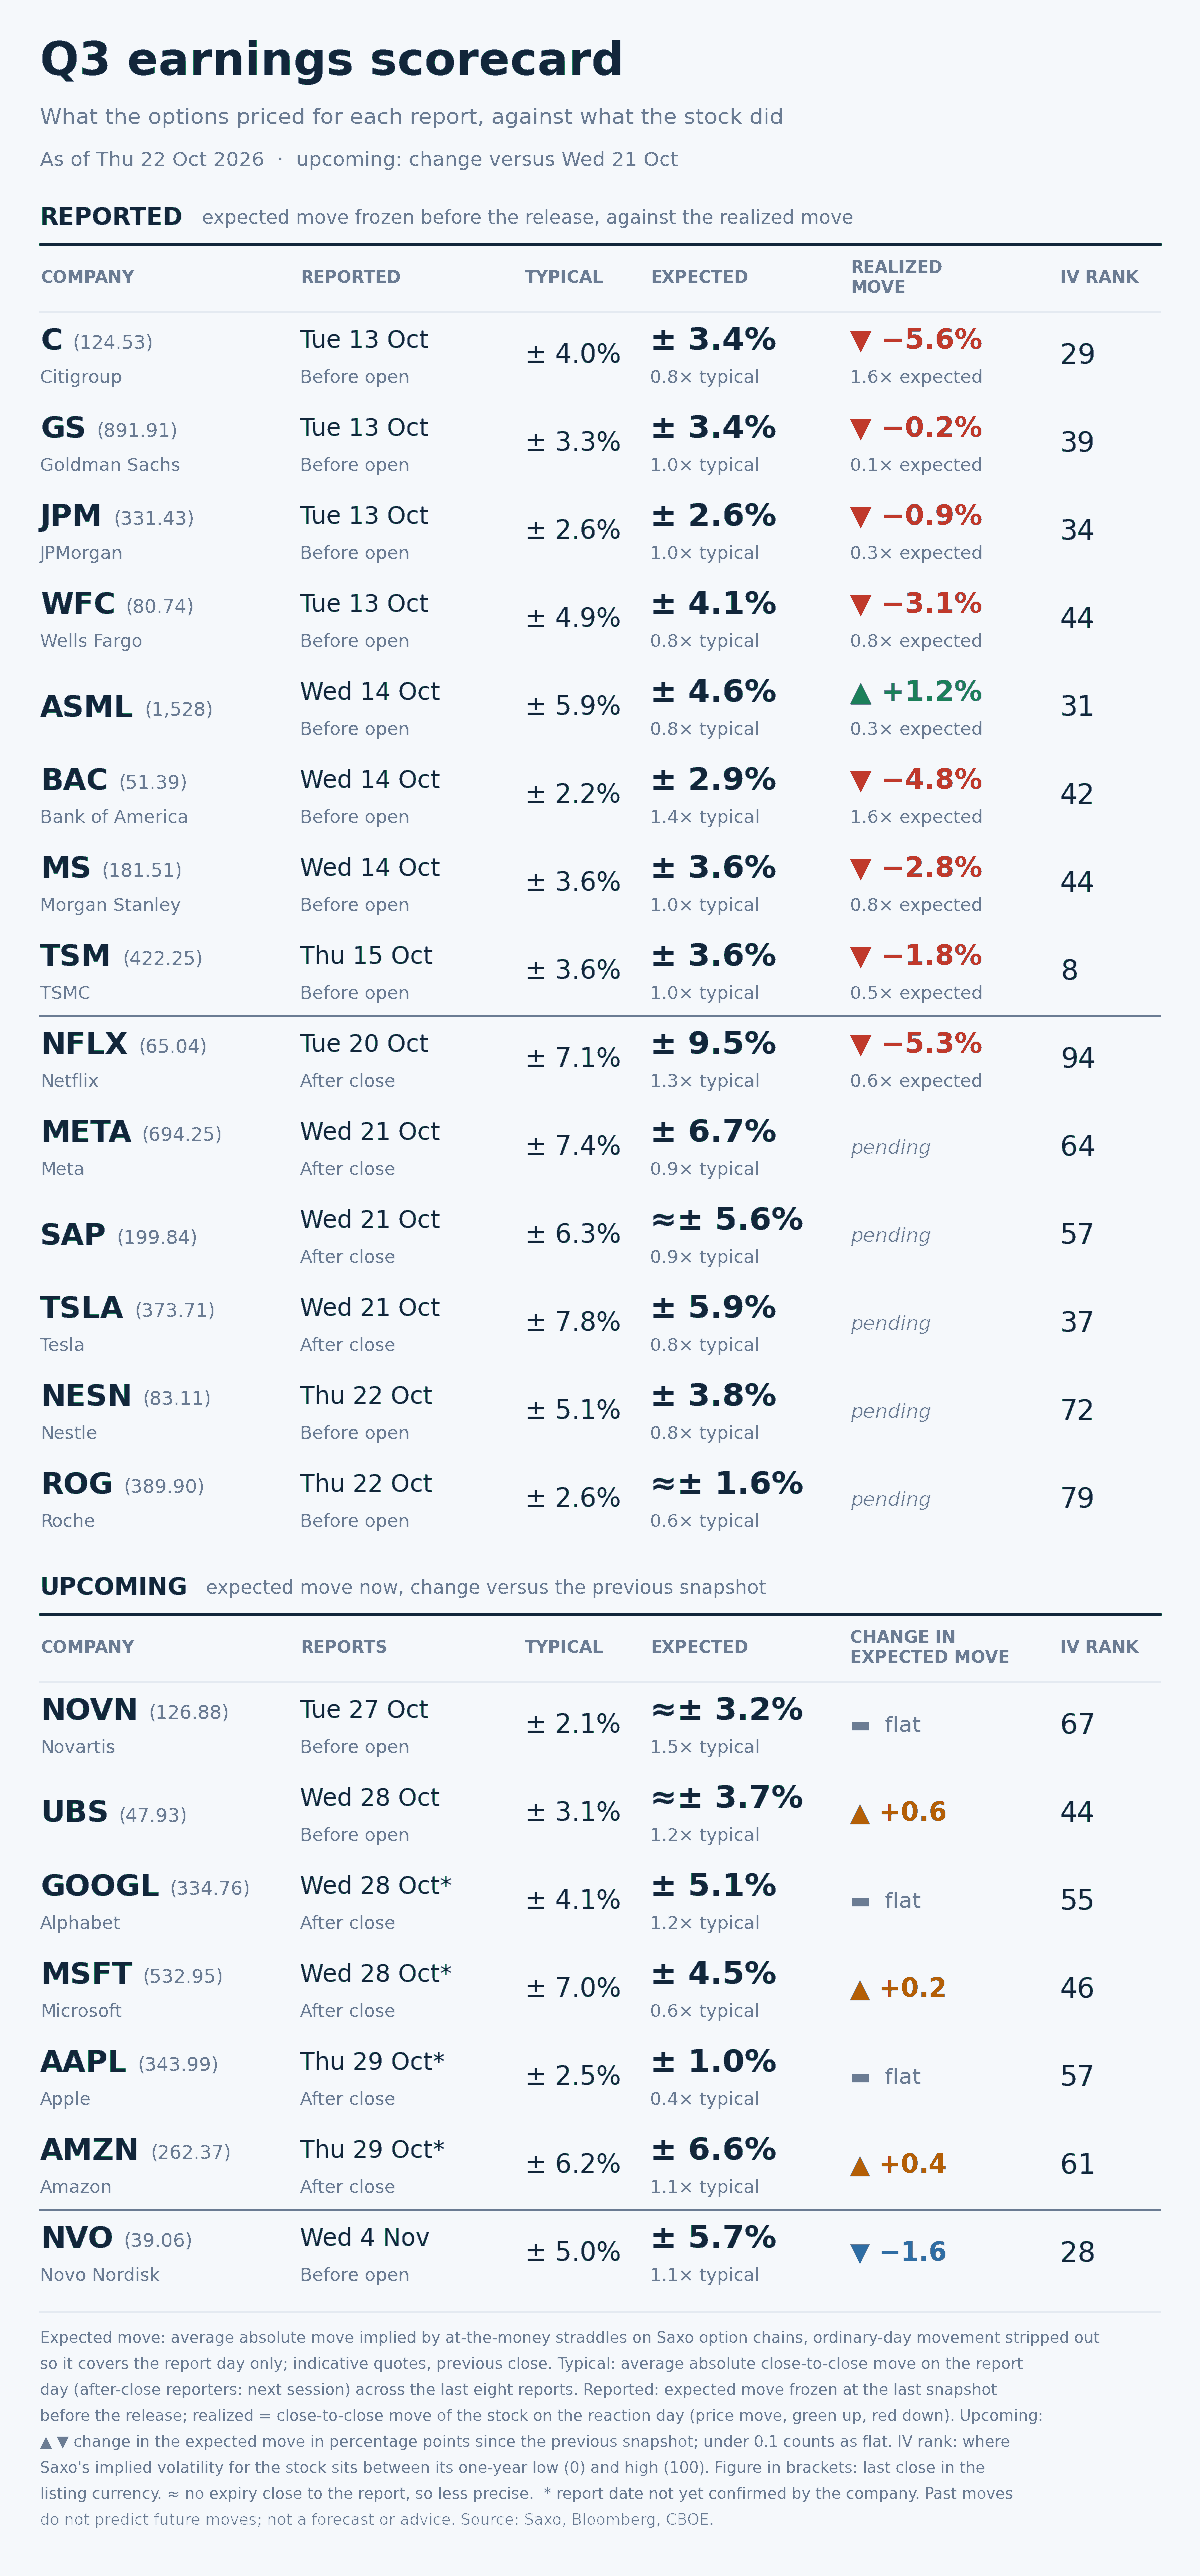
Option-implied expected move for each report day against the stock’s average move after its last eight reports, for the twenty-one names tracked this season. Arrows show whether an upcoming expected move rose or eased since the previous day. Past performance is not indicative of future results. Source: Saxo, Bloomberg, CBOE.
The spread between what is priced and what each name has actually done runs from 1.5x to 0.4x. Novartis is the richest, at 3.2% into next Tuesday against an eight-report average of 2.1%. Apple is the cheapest, at 1.0% into 29 October against an average of 2.5%, with Microsoft next at 4.5% against 7.0%.
Implied-volatility rank and the event premium answer different questions, and this week they disagree. Roche carries a rank of 79 and Nestle 72, both among the highest on the board, yet their expected moves are 1.6% and 3.8%. Novo Nordisk sits at rank 28 with a 5.7% expected move, above its own 5.0% average. Rank measures the year; the event premium measures one day.
Next up are Novartis on Tuesday, then UBS and Alphabet on Wednesday, Microsoft the same evening, and Apple and Amazon on Thursday.
Options carry a high risk of rapid loss and are not suitable for every investor. Costs and charges apply and vary by account and venue; check the rates applicable to you before entering any position.
What the market is pricing
- Session implied range: SPX options price 41.50 points, 0.535%, for today’s expiry, a level comparison only against the 41.15 points quoted for yesterday’s, since the two are different contracts.
- Event implied range: Friday’s expiry prices 59.60 points, 0.768%, and stops before the 28 October Federal Reserve decision. A session ago the same expiry was quoted at 73.80 points with three sessions left rather than two. The clock alone would have left about 60.3, so roughly 0.7 of a point came out beyond the decay.
- Tail risk signal: SKEW at 150.36 after a 10.04 point fall, with the tail-risk index down 11.50% the same session. Both stay high in absolute terms, so in our view this is a tail that got cheaper rather than one that was abandoned.
- Correlation read: implied correlation at 12.83 against dispersion at 37.14, both close to unchanged, so in our view the index is still priced as names that disagree rather than as one object.
The shape of Wednesday’s repricing is clean. Friday’s at-the-money price came off by close to what one fewer session alone would take, so in our view implied volatility at the money barely moved. What moved sat in the wings: ten points off the crash gauge, a tenth off the tail index, the bond gauge down 5.66%.
In our view that is a market cutting the price of protection it is not using while leaving the next two sessions alone. Yesterday’s flow, where a side could be read, was still buying downside.
Options carry a high risk of rapid loss and are not suitable for every investor. Costs and charges apply and vary by account and venue; check the rates applicable to you before entering any position. Past performance is not indicative of future results.
| More from the author |
|---|