
Access all our platforms from a single account.

DRAM: the memory boom now has an option chain. Here is how to read it

Summary: A four-month-old ETF already carries millions of option contracts in open interest. The chain looks familiar, but almost none of the usual measures can bear the weight traders put on them.
Most of what we lean on to judge an option chain needs history. What do you do when there is barely any?
The Roundhill Memory ETF (DRAM) is an actively managed fund holding the companies that make computer memory, the DRAM and NAND chips and the high-bandwidth memory that artificial-intelligence servers consume in volume. It listed on 2 April 2026 and has had an eventful start. It closed its first session at 27.76, reached 80.72 on 22 June, and traded near 50.90 on 3 August 2026, some 37% below the June high (Source: Saxo price history, 3 August 2026). Open interest across its calls and puts already runs past 2.9 million contracts (Source: Bloomberg, 3 August 2026).
So there is enough liquidity to trade, and not enough history to judge it with the measures most traders reach for first. What follows is a sequence of checks rather than conclusions.
Key takeaways
- Roughly 40% of the fund is swap exposure rather than owned shares, and 26% sits in Treasury bills
- About two thirds of its price variance has happened overnight, while the US options market was closed
- Volatility rank, expected-move comparisons and open-interest clusters all need more history than this instrument has
Important note: The strategies and examples provided in this article are purely for educational purposes. They are intended to assist in shaping your thought process and should not be replicated or implemented without careful consideration. Every investor or trader must conduct their own due diligence and take into account their unique financial situation, risk tolerance, and investment objectives before making any decisions. Remember, investing in the stock market carries risk, and it’s crucial to make informed decisions.
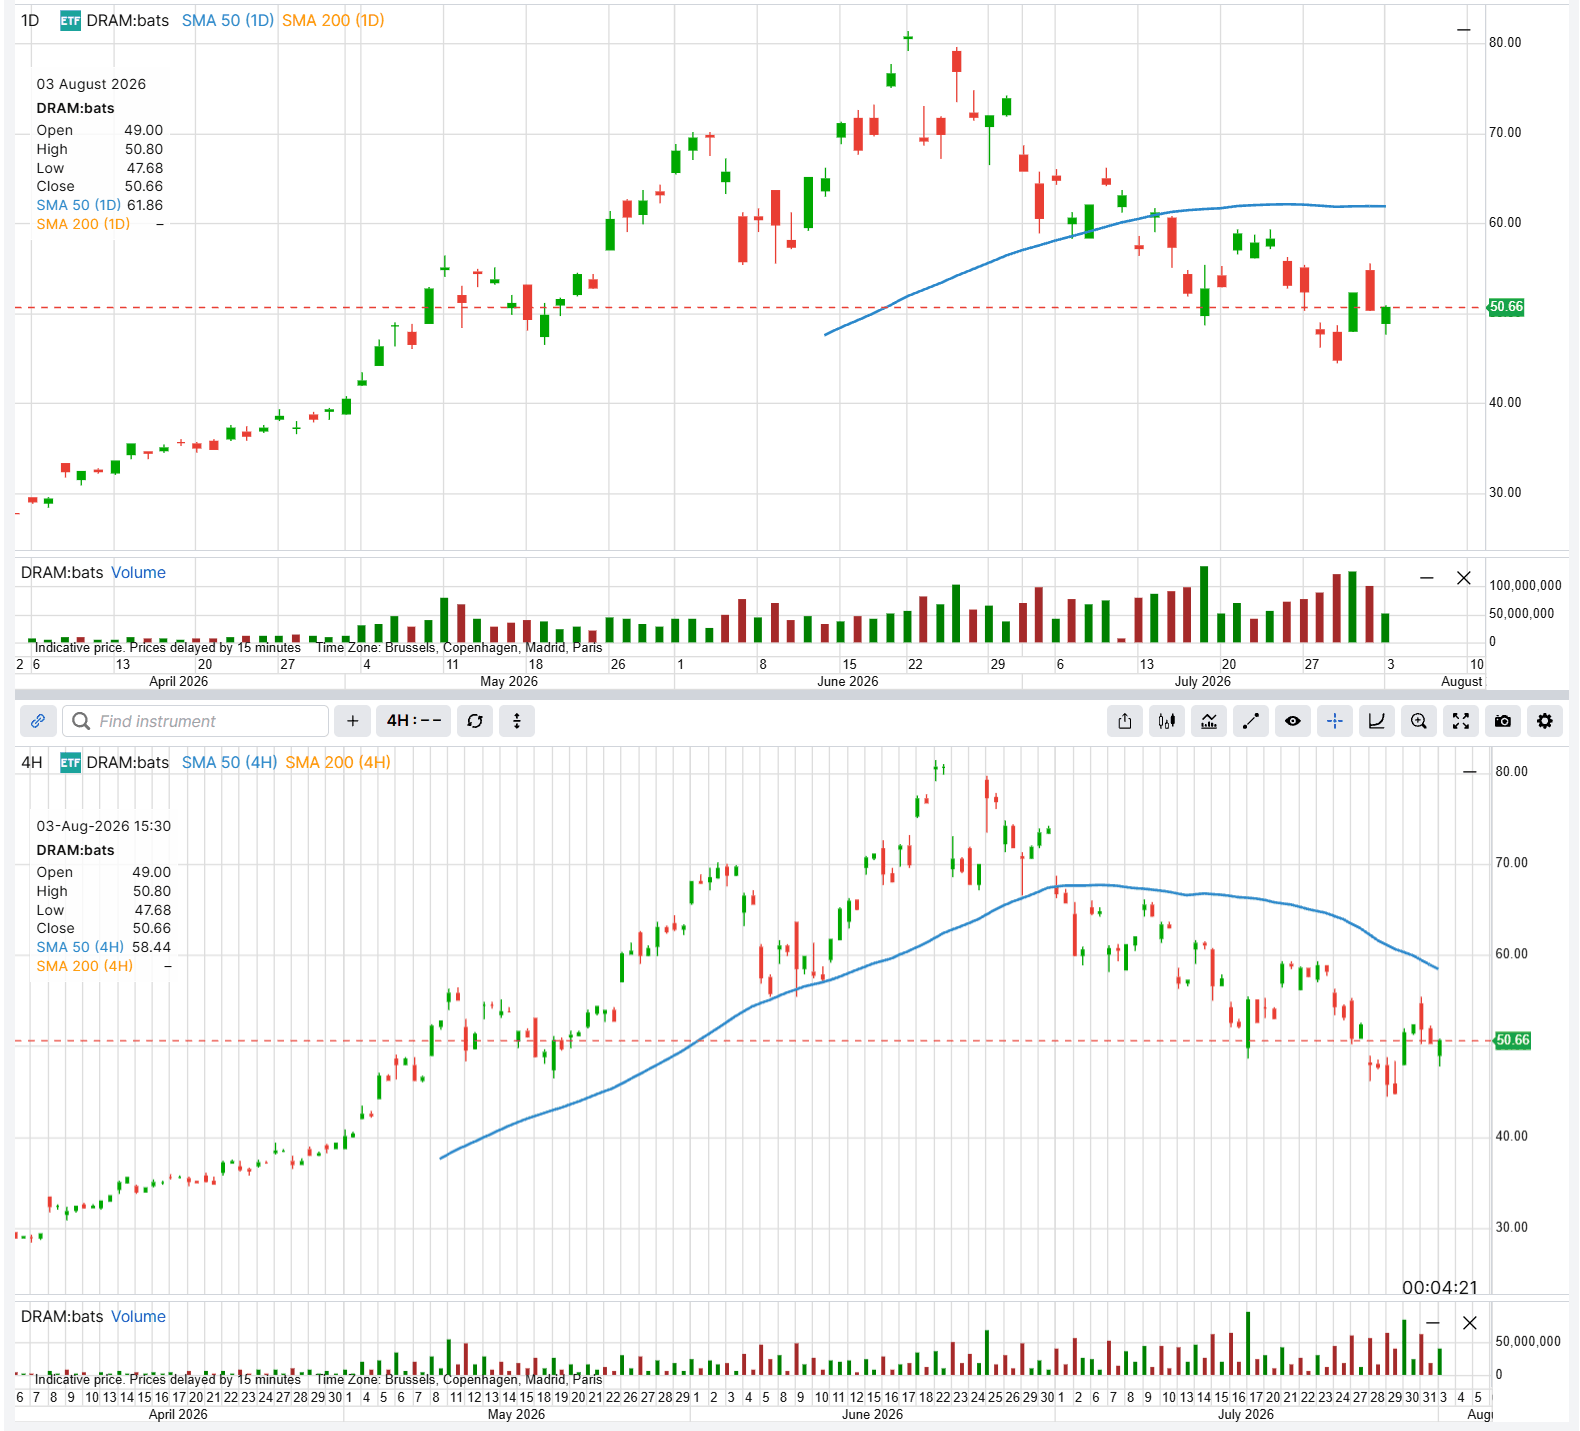 DRAM daily (upper) and 4-hour (lower) since listing. There is not yet enough history to plot a 200-day average, which is itself part of the problem. Past performance is not indicative of future results; figures are illustrative and not predictive. Source: SaxoTrader
Step one: read the holdings before you read the chain
A ticker called DRAM suggests a basket of memory shares. The holdings file describes something more layered. Its largest single line is Treasury bills at 26.5% of net assets, and close to 40% of the fund’s exposure arrives through total return swaps rather than owned shares (Source: Bloomberg holdings, 3 August 2026). Micron makes the point: its swap and share lines give roughly 24.5% exposure, of which only about 2.4% sits in actual shares.
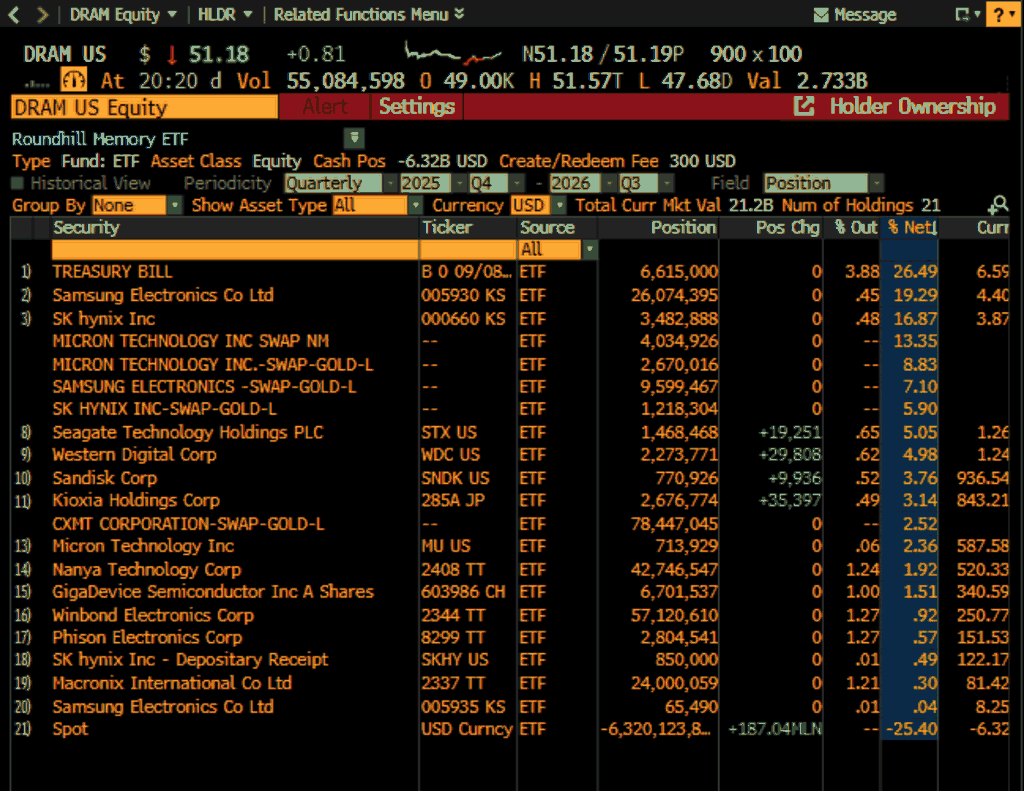 The fund’s 21 holdings. The four lines marked SWAP are contracts with a bank rather than shares, the Treasury bills sit as collateral behind them, and the negative dollar line is the financing side. Micron appears three times, twice as a swap and once, at 2.36%, as actual stock. The price in the panel header is a later intraday print than the 50.90 reference used elsewhere in this article. Source: Bloomberg, 3 August 2026
What a swap position actually is. A total return swap is a contract with a bank rather than a shareholding. The fund pays a financing fee, and in return the bank pays it whatever the referenced shares earn, so the fund ends up with the economic exposure without owning the stock. Funds reach for this when the underlying market is awkward to hold directly, which describes Korean, Taiwanese and mainland Chinese listings well, since foreign-ownership limits, local settlement rules and withholding tax all make direct ownership expensive.
That also explains the rest of the holdings file. The Treasury bills sit as collateral behind those swap contracts, and the negative dollar line is the financing side of the same arrangement. The trade-off is that a swap is a claim on a counterparty: if the bank on the other side fails, the holder is left with a claim rather than the shares, and the financing fee is a standing drag on returns. None of this makes the fund unsound, and it does mean the wrapper is doing more work than the ticker suggests.
Geography matters too. Samsung Electronics, the largest holding near 26.4%, trades in Seoul alongside SK hynix, with further names in Tokyo, Taipei and Shanghai, so close to 60% of the equity exposure sits in markets shut while US options are open.
Step two: find out where the movement actually happens
That can be measured, and in our view it is worth establishing before pricing any option here. Across 83 completed sessions the average gap from one close to the next open has been 4.10%, and 72% of sessions gapped more than 2%. Splitting each day’s return into overnight and intraday parts, the overnight portion carries roughly 67% of total variance (Source: Saxo price history, 3 August 2026). Past performance is not indicative of future results; figures are illustrative and not predictive.
The consequence is uncomfortable. A position cannot be managed through the move that matters most, because it happens while the market is shut. Stop orders offer little protection across such a gap, and undefined-risk structures carry exposure that cannot be hedged intraday. Defined risk here looks less like a preference than a requirement.
Step three: notice which measurements are not available yet
Volatility rank. DRAM’s 30-day implied volatility reads near 95%, around 77 on a 52-week rank (Source: Bloomberg, 3 August 2026). The fund has existed four months, so that window is its entire life rather than a year of behaviour, which makes the rank arithmetically correct and narrower than it looks.
Comparisons against past moves. The chain prices a move of about 18% by the 21 August 2026 expiry, and the obvious check is whether this fund usually travels that far. That check is not available yet. Four months of trading contains only about four separate 18-session stretches, and nobody would call a coin biased after four flips.
Open interest as a map. The heaviest August strike is the 60 call at 73,384 contracts (Source: Saxo, 3 August 2026). The fund traded between 55 and 60 in mid-July and now sits near 51, so that cluster marks where price has been.
Step four: choose the expiry deliberately
The nearest standard monthly is a habit rather than an argument. A common way to estimate the market-implied move is to add the at-the-money call and put premiums for an expiry, then compare that straddle price to the share price. On that basis 21 August 2026 prices about 18% and 18 September 2026 about 26.5%, with at-the-money implied volatility near 103% and 95% (Source: Saxo, 3 August 2026).
Each expiry wins on a different measure. September pays more outright, since a 45/40 put spread there collects roughly 34% of the strike width against about 25% for August. A common convention is to want at least a third of the width when selling a vertical, which September roughly meets and August falls well short of. August holds the better cushion against what is priced, its break-even absorbing close to three quarters of the expected move against a little over half for September. The examples below use September for both verticals so that reversing two strikes can be seen on its own.
Where this lands, part one: a range-bound or mildly constructive view
Steps two and three rule out more than they rule in.
Example structure (illustrative only - not a trade recommendation)
- Sell 1 18 September 2026 45 put (mid approximately 4.18)
- Buy 1 18 September 2026 40 put (mid approximately 2.47)
- Net credit: approximately 1.71 = 4.18 taken in on the short 45 put, less 2.47 paid for the long 40 put; at a working limit of 1.70 the premium is 170 USD
- Maximum risk: approximately 330 USD (5.00 width less the 1.70 credit), hypothetical, for education only
- Maximum profit: approximately 170 USD, hypothetical, for education only
- Break-even at expiry: approximately 43.30, some 14.9% below the 50.90 reference price
Quotes as at 3 August 2026; reprice from the live chain before any entry. All figures are hypothetical and for education only. Options carry a high risk of rapid loss and are not suitable for every investor. See Saxo’s pricing overview for costs and applicable charges.
The short 45 put collects the premium and marks where the position begins to suffer, while the long 40 put caps that damage at approximately 330 USD, the most this structure can lose. Both strikes carry open interest above 12,000 contracts (Source: Saxo, 3 August 2026), which matters where quotes thin away from round strikes.
Strategy insight - the greeks describe the view. The position carries delta near 0.10, theta around 0.01 and vega near -0.013, so it may benefit modestly from time passing and from falling implied volatility, with maximum loss fixed at 330 USD.
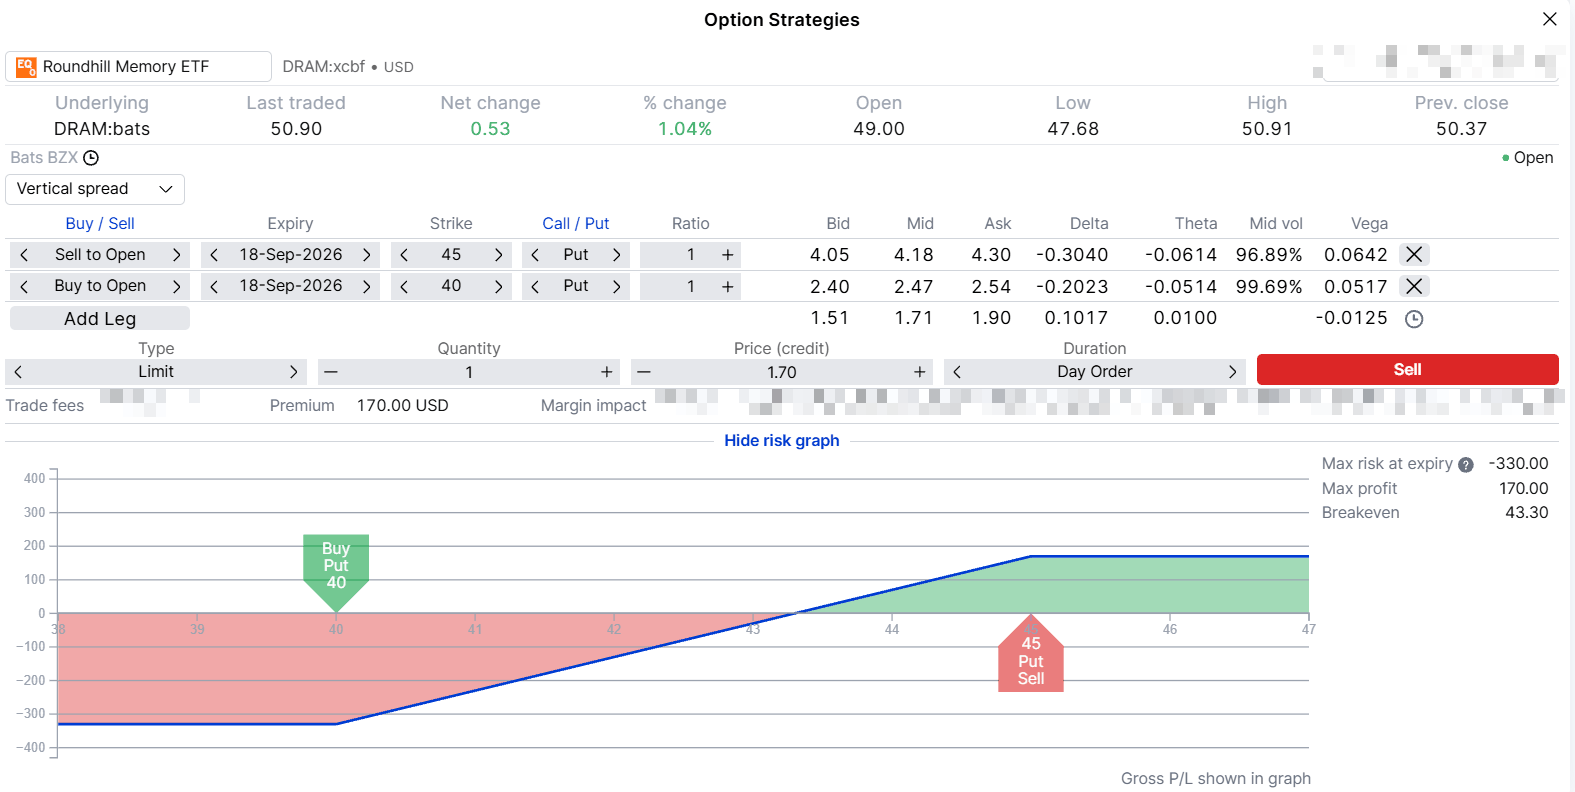 Put credit spread payoff at the 18 September 2026 expiry. Illustrative only, not a trade recommendation. Past performance is not indicative of future results; figures are illustrative and not predictive. Source: SaxoTrader
Where this lands, part two: a view on the term structure
The gap between August and September implied volatility is itself tradable. A calendar spread sells the nearer, dearer expiry and buys the further one.
Example structure (illustrative only - not a trade recommendation)
- Sell 1 21 August 2026 50 call (mid approximately 4.88, implied volatility near 103%)
- Buy 1 18 September 2026 50 call (mid approximately 7.15, implied volatility near 95%)
- Net debit: approximately 2.28 = 7.15 paid for the September call, less 4.88 taken in on the August call
- Maximum risk: approximately 228 USD, the debit paid, hypothetical, for education only
- Maximum profit and break-evens: model-dependent, not fixed at entry
Quotes as at 3 August 2026; reprice from the live chain before any entry. All figures are hypothetical and for education only. Options carry a high risk of rapid loss and are not suitable for every investor. See Saxo’s pricing overview for costs and applicable charges.
A calendar’s profit zone is an estimate, not a defined outcome: the September call’s residual value at the August expiry depends on implied volatility then. The structure is typically net long vega, so a broad decline in implied volatility may work against it even while time decay works for it. Maximum loss stays at the 228 USD debit.
Strategy insight - a short leg on a gapping instrument. The August call is American-style and can be assigned before expiry if it moves into the money, and given the overnight behaviour in step two it may travel a long way before the trader can respond.
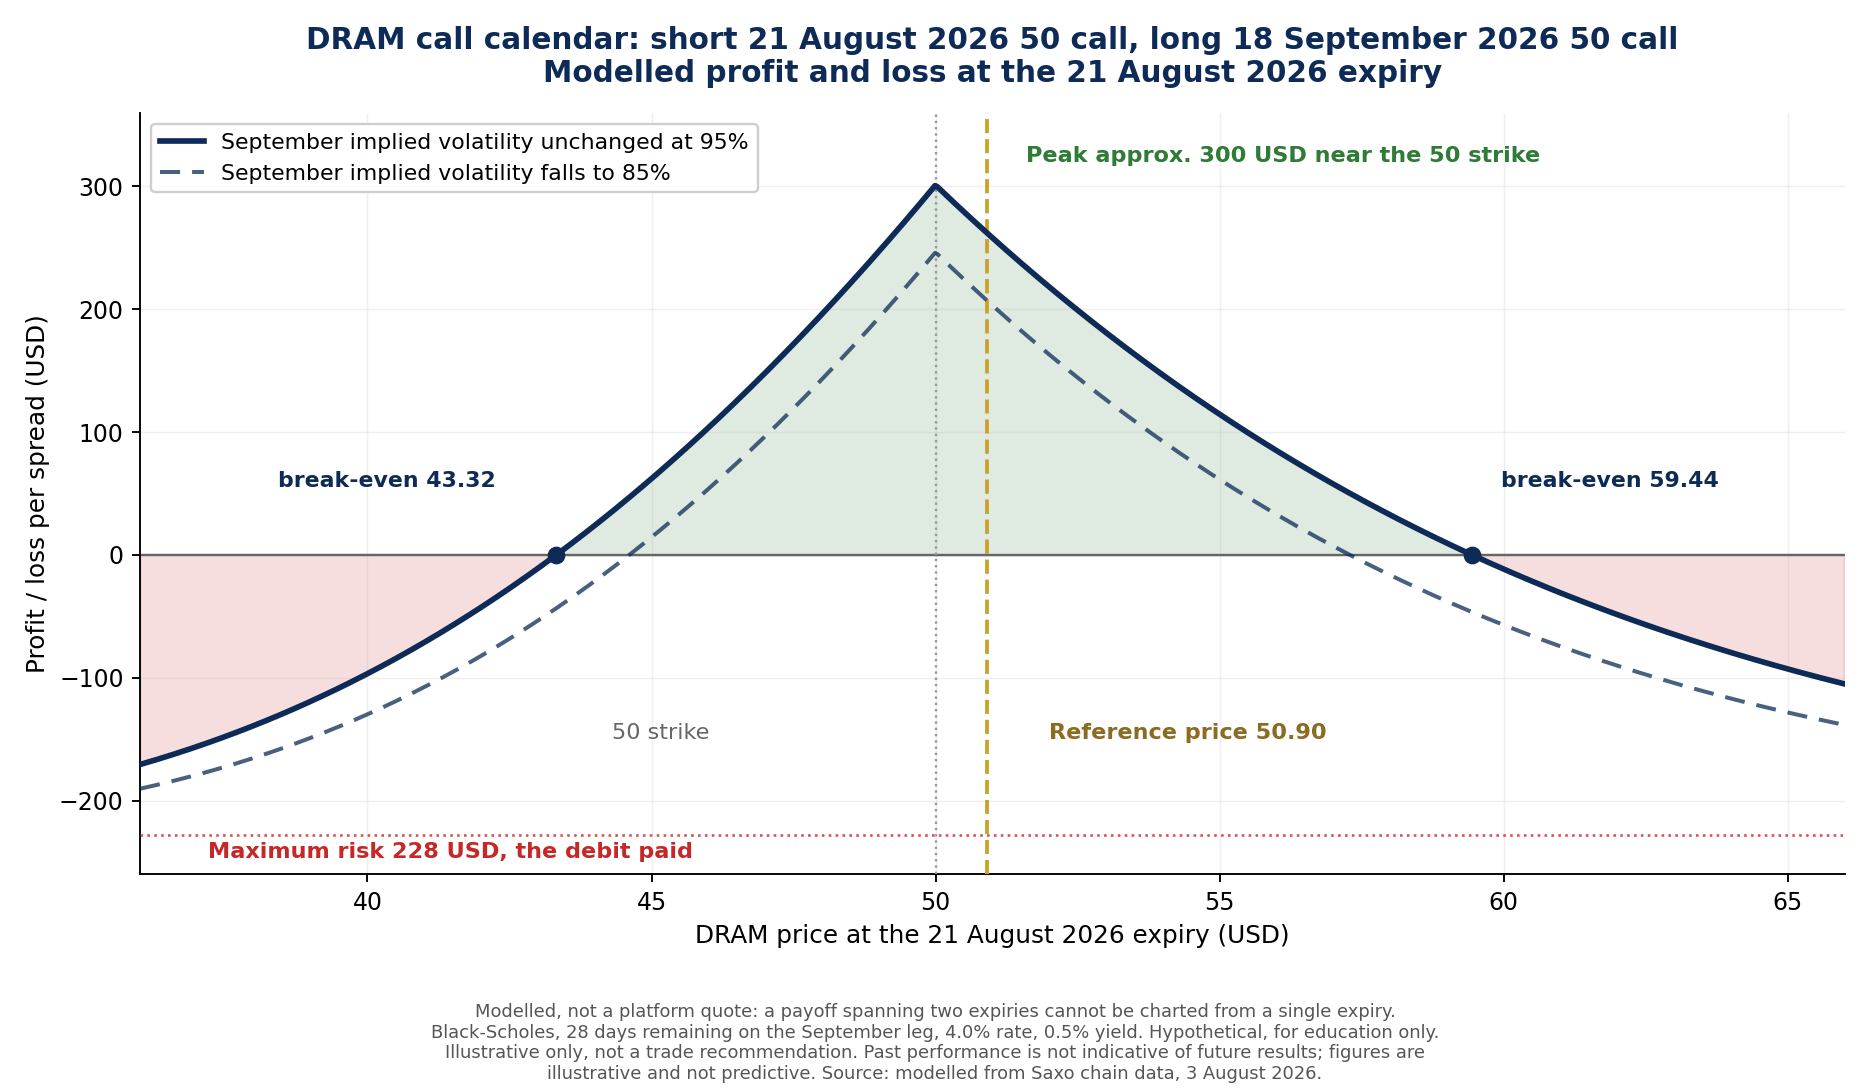 Modelled rather than quoted, because a payoff spanning two expiries cannot be charted from a single expiry. Illustrative only, not a trade recommendation. Past performance is not indicative of future results; figures are illustrative and not predictive. Source: modelled from Saxo chain data
Where this lands, part three: a view that the decline continues
The first example’s two strikes, reversed, express the opposite view.
Example structure (illustrative only - not a trade recommendation)
- Buy 1 18 September 2026 50 put (mid approximately 6.53)
- Sell 1 18 September 2026 45 put (mid approximately 4.18)
- Net debit: approximately 2.35 = 6.53 paid for the long 50 put, less 4.18 taken in on the short 45 put; at a working limit of 2.30 the premium is 230 USD
- Maximum risk: approximately 230 USD, the debit paid, hypothetical, for education only
- Maximum profit: approximately 270 USD (5.00 width less the 2.30 debit), hypothetical, for education only
- Break-even at expiry: approximately 47.70, some 6.3% below the 50.90 reference price
Quotes as at 3 August 2026; reprice from the live chain before any entry. All figures are hypothetical and for education only. Options carry a high risk of rapid loss and are not suitable for every investor. See Saxo’s pricing overview for costs and applicable charges.
The long 50 put provides the downside exposure and the short 45 put reduces its cost, capping any gain below 45. This one needs a decline through 47.70 before the 230 USD paid starts to be recovered, and that debit is the whole risk.
Strategy insight - the same strikes, opposite work. This structure carries delta near -0.11, theta around -0.005 and vega near +0.008, inverting the first example on all three. The 45 put appears in both, collecting premium in one and cutting cost in the other, so a contract’s role comes from the structure around it.
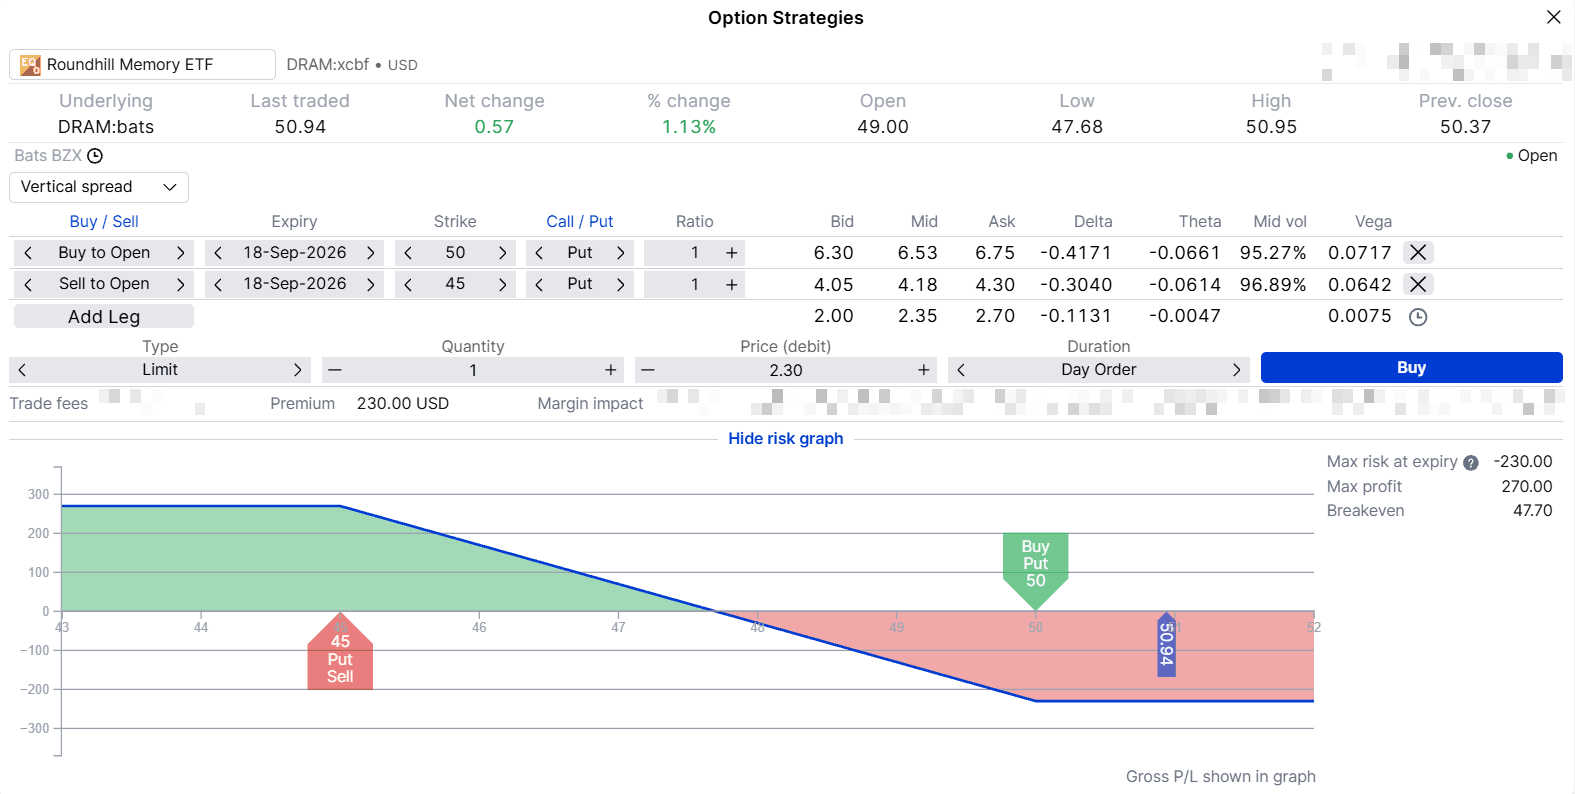 Bear put spread payoff at the 18 September 2026 expiry. Illustrative only, not a trade recommendation. Past performance is not indicative of future results; figures are illustrative and not predictive. Source: SaxoTrader
Before placing any trade, check:
- Bid/ask spreads, which widen sharply away from the round strikes and can remove any theoretical edge at entry
- Volume and open interest at the specific strikes selected, not merely at the headline strikes
- Whether the position depends on intraday management, given how much of this fund’s movement occurs overnight
- Implied volatility against realised volatility, and whether the difference reflects a regime expected to persist
- An exit plan defined before entry, particularly for structures whose profit zone is model-dependent
- Assignment risk on any short leg that may move into the money
Assignment risk note: Because DRAM options are American-style, short legs in these structures can be assigned before expiry if they move into the money, particularly close to expiration. Traders should monitor short options and understand their platform’s assignment process before entering any position.
Final thoughts
The three structures above illustrate a method rather than recommend a trade, and the method is the transferable part. A reader who runs the same four checks and decides four months is too little history to trade against has reached an equally defensible answer. New instruments keep arriving, each with a familiar-looking chain attached to an underlying that has not earned the assumptions traders bring to it.
Options remain a framework for structuring uncertainty rather than a means of removing it, and that distinction matters most when the uncertainty is largest. Options carry a high risk of rapid loss and are not suitable for every investor.
At the time of publication the author does not hold positions in the instruments referenced in this article.
This content is marketing material and should not be regarded as investment advice. Trading financial instruments carries risks and historic performance is not a guarantee of future results.
The Author is permitted to wait at least 24 hours from the time of the publication before they trade the instruments themselves.
The instrument(s) referenced in this content may be issued by a partner, from whom Saxo receives promotional fees, payment or retrocessions. While Saxo may receive compensation from these partnerships, all content is created with the aim of providing clients with valuable information and options.
This content will not be changed or subject to review after publication.
| More from the author |
|---|