
Access both platforms from your single Saxo account.

Bond vol rose, bonds barely moved - Options Brief - 30 September 2026

Summary: The price of insuring a Treasury position hit the top of our record yesterday, on a session when the Treasuries themselves barely moved. One of those two readings has it wrong.
The price of insuring a Treasury position hit the top of our record yesterday. The Treasuries themselves finished about where they started.
MARKET REGIME: TRANSITIONING | VIX 16.04 | TERM STRUCTURE: CONTANGO | SKEW: ELEVATED (144.58) | FRONT-MONTH VIX FUTURES: 17.53
Key findings
- Rate volatility topped our record. MOVE rose 4.71% to 106.61, above all 83 readings we hold, on a day the ten-year yield fell.
- Equity volatility is precisely average. The VIX slipped to 16.04, within a hundredth of its own median, and VIX1D at 11.69 is the cheapest measure on the board.
- The ranks agree. Three of the six largest one-session rank rises on a 187-name board are bond funds.
A Federal Reserve speaker capped the bond market and two data points undercut it. New York Fed President John Williams said there is no urgency for a follow-up increase after September's move, which pared October expectations and pulled the short end lower. September consumer confidence came in at 81.9 against 89.0 expected, the weakest in more than twelve years, and August job openings fell 256,000 to 7.08 million, a five-month low.
Treasuries had a choppy session around all of that. The ten-year peaked intraday at 5.29%, a nineteen-year high, then closed back near 5.236%; the two-year ended around 4.893% after an intraday high above 4.95%. Both finished the session lower than they started it.
Equities fell for a second day: the S&P 500 0.17% to 7,670.84. What did not fall was the price of rate protection, and that is the day's story.
- US (Tuesday 29 September close): The S&P 500 fell 0.17% to 7,670.84 and the Dow 132 points to 51,355.13, while the Nasdaq 100 rose 0.21% to 30,339.33. The spread inside it was the story: Apple fell 2.66% and Meta Platforms rose 3.24%, nearly six percentage points apart on a day the index moved a sixth of one. The semiconductor fund gained 1.15% and utilities led the sector funds, up 1.17%.
- Europe: The Euro Stoxx 50 rose 0.30% to 6,320.27 and the DAX 0.10%, while Paris fell 0.53% and the Stoxx Europe 600 eased to 638.09.
- Asia (Wednesday morning): Regional markets are rebounding for the first time in three sessions. The Nikkei 225 is up 1.8%, the CSI 300 0.2% and the Hang Seng flat, while the Kospi has faded to 0.3% lower. China's manufacturing survey printed 50.1.
- Commodities and rates: The gold fund rose 1.32% to 382.89 and the miners 1.34%, recovering part of Monday's break; silver added 0.96%. The front crude contract rolled between these two readings, so no session change is drawn. The one-year yield rose three basis points to 4.591%, the two-year fell six to 4.893% and the ten-year two to 5.236%.
- Market regime: Transitioning, with the VIX at 16.04, the cash curve in contango and twenty-day realised volatility stable at 10.78%.
Source: Saxo, Bloomberg, CBOE. Levels as of the 29 September close unless stated. Yield changes are derived from the prior reading. Past performance is not indicative of future results.
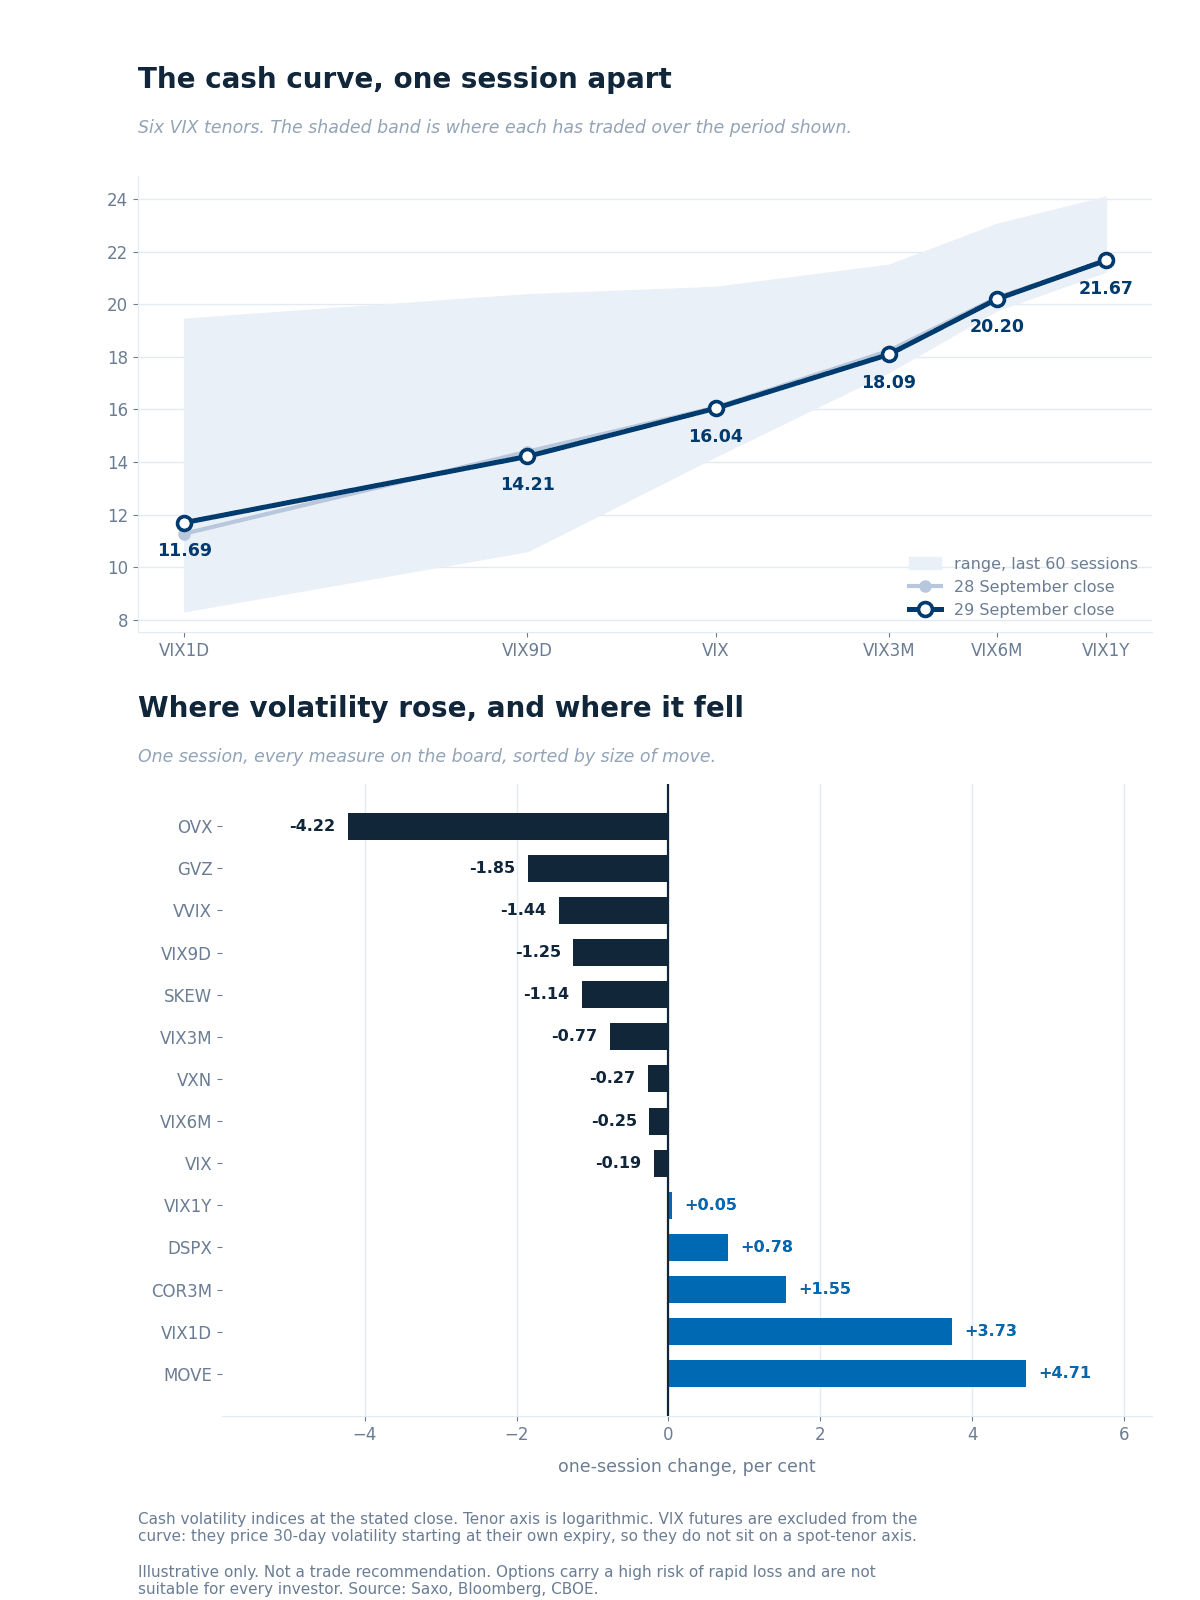 The six cash VIX tenors at Tuesday's close against the previous session and their 60-session ranges, with one-session changes below.
Reading the curve
- The equity curve stood still. The VIX lost 0.19% to 16.04, VIX9D 1.25% to 14.21, VIX3M 0.77% to 18.09, VIX1Y unchanged. Only VIX1D moved, up 3.73% to 11.69, still the board's lowest reading.
- The two largest moves were both in rates. MOVE gained 4.71% to 106.61 and the Treasury ETF gauge 7.31% to 17.90. Both price a different underlying from the VIX and are never set against it here; they moved and the equity curve did not.
- Ratios, which the graphic does not carry. VIX3M to VIX is 1.13 and the Nasdaq-to-S&P ratio 1.38, both unchanged. Skew at 144.58 is high against its long-run history, where 115 to 120 is typical, though 47 stored sessions read higher.
VIX futures
- The front contract is 17.530, down 0.32, the second 18.260, leaving the structure in contango at 0.960. The premium to spot narrowed to 1.49 from 1.78.
- Put-call parity puts the October forward at 17.68, within 0.15 of the feed, so no roll has occurred. Neither is in the graphic: both price 30-day volatility from their own expiry.
Source: Saxo, Bloomberg, CBOE, 30 September 2026, approx. 06:00 CET. Past performance is not indicative of future results.
Saxo's implied-volatility rank across 187 US and 327 euro-zone option underlyings, where 0 is a one-year low and 100 a one-year high. The US universe held the same 187 names across both sessions, so the comparison is like for like.
- The typical name got slightly dearer. The median US rank rose to 44.1 from 42.3 and the median percentile to 59.5 from 55.2; the euro-zone median is 42.0. Neither is a large move, which is the point: the board as a whole did roughly nothing.
- Rates and credit sit at the very top. The long-bond fund is at its one-year high on a rank of 100.0, with the investment-grade credit fund just below at 96.3. Each gained more than 12 rank points in one session and close to 70 over five.
- The concentration is what makes it a signal. Three of the six largest one-session rank rises are bond funds, the emerging-market bond fund the largest of the three at 14.2 points. No equity cluster on the board looks like that.
- Health care supplies seven of the top twenty US ranks, the largest single sector block, which is a separate story from the rates bid and worth watching on its own. See Saxo pricing for costs and charges.
Data source: Saxo, as of 30 September 2026, reflecting the 29 September close. Past performance is not indicative of future results.
Based on end-of-day 29 September, Tuesday's positioning and not today's price action.
- Single-name flow gave no readable direction. Eight of the ten groups read as unsided or income-shaped, and most of the day's premium crossed at mid as long-dated multi-leg packages.
- Sector and ETF flow had one clean strand, and it cuts both ways. Every large cleanly bought line in the rates group was a put, yet the heaviest near-dated cluster printed on the bid, meaning front-end bond volatility was being supplied rather than bought. The semiconductor names were income-shaped despite the rally. Named funds are market context only; see Saxo pricing for costs and charges on exchange-traded fund trades.
What the option market priced for this week, drawn around Friday's close.
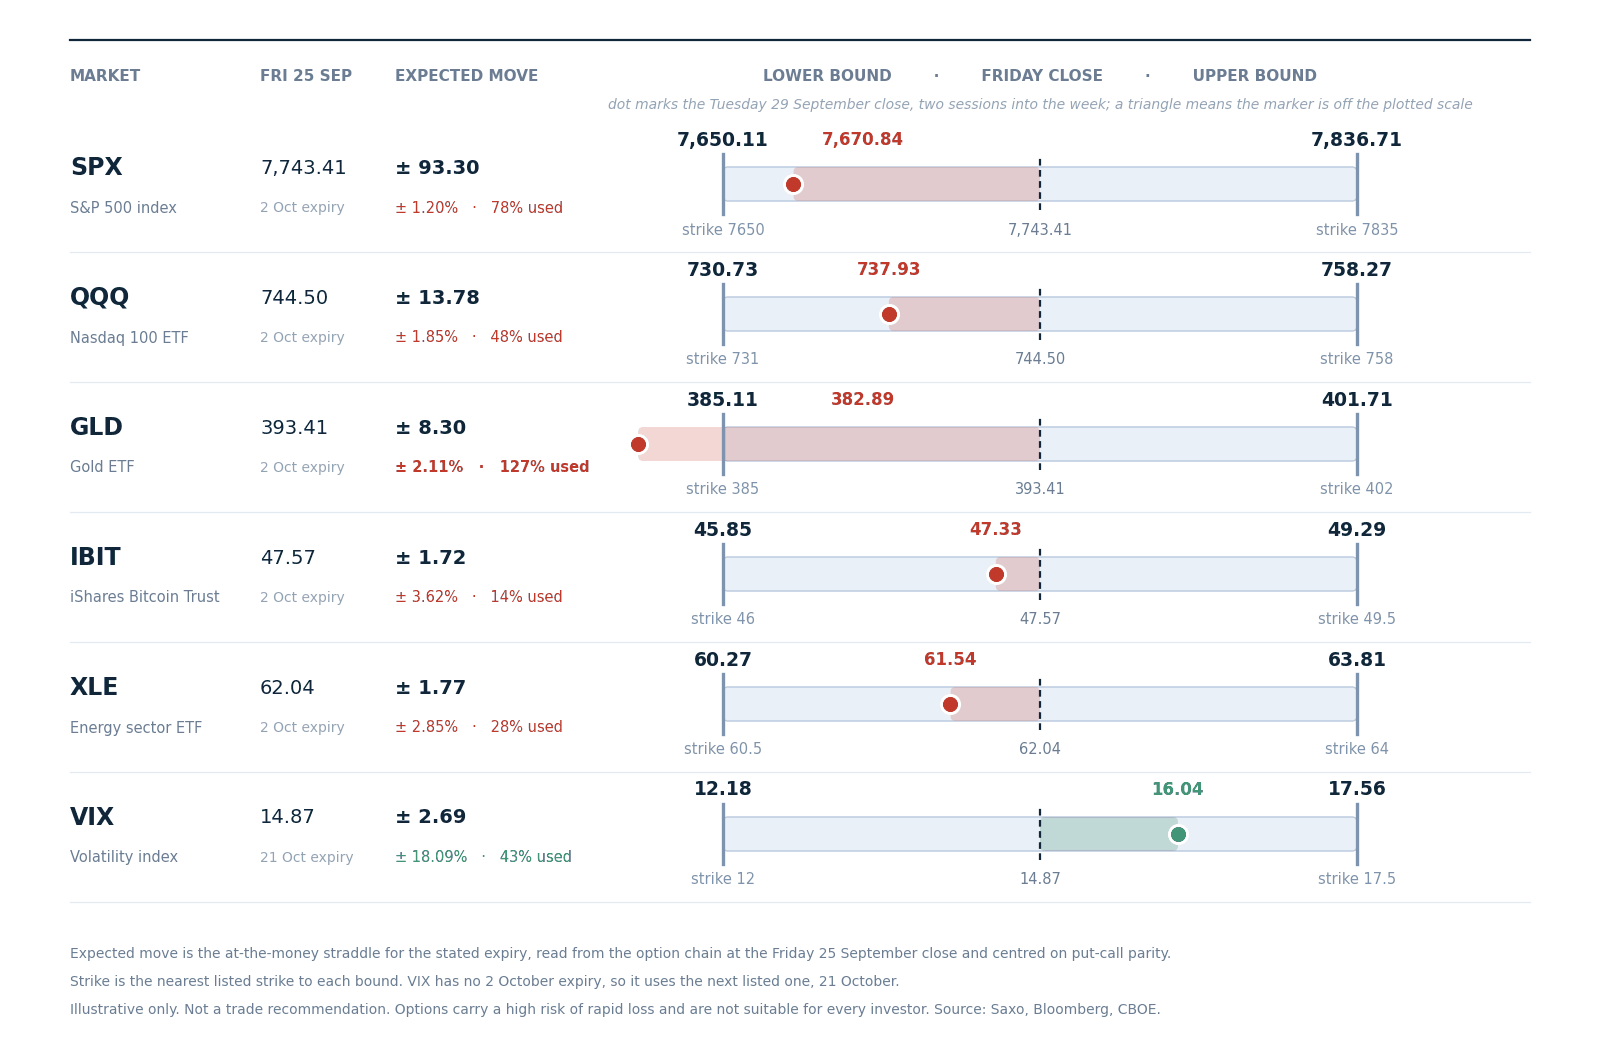 Expected move to Friday 2 October, drawn around the 25 September close with the nearest listed strike at each bound. Volatility uses the 21 October expiry, whose forward sits above spot. Read from the chain at Friday's close, not a forecast.
- Two sessions into five, the index has spent most of its week. The S&P 500 sits at 7,670.84 against a lower bound of 7,650.11, having used 78% of the whole week's priced range with three sessions still to run. The Nasdaq 100 fund has used 48%, volatility 44%, energy 28% and the bitcoin fund 14%.
- The gold fund is still outside its band, at 127% used and below the 385.11 floor, though it recovered ground from the 187% it reached on Monday. A market can leave the range early and walk back into it.
- Options carry a high risk of rapid loss and are not suitable for every investor; see Saxo pricing for costs and charges.
The US cash session runs 15:30 CET to 22:00 CET. The August PCE inflation report arrives at 14:30 CET, an hour before the open, alongside the annual revisions to GDP and PCE, with the ADP employment change at 14:15 CET and the Chicago purchasing managers' survey at 15:45 CET. Today's expiry settles at the cash close, so it prices the reaction and the whole session that follows, not the run-up alone. German flash inflation is at 14:00 CET and the EIA inventory report at 16:30 CET.
Micron reports today. It is also quarter end, so rebalancing flows may add to the tape independently of the data. Thursday brings the ISM manufacturing survey and Friday the employment report. Future outcomes are uncertain and may result in losses.
- Session implied move. SPXW options price 41.5 points, 0.54%, to tonight's 22:00 CET close. Quotes ahead of the US open are indicative.
- Event implied range. The 2 October expiry prices 78.3 points, 1.02%, covering PCE, ISM and Friday's payrolls. A session ago it priced 89 points with one more session to run, and decay alone would have left about 77, so almost nothing has come out of the volatility itself.
- Where volatility is being paid for. MOVE at 106.61 is above every reading we hold while the VIX sits within a hundredth of its own median. In our assessment the market may be paying for rates risk and treating equity risk as unremarkable; the ranks agree.
- Dispersion is realised, not priced. Apple and Meta finished six percentage points apart under an index that moved 0.17%, yet implied correlation at 11.17 is higher than 72 of our stored sessions and dispersion at 36.31 sits below its median. In our view the market may not yet be paying for the spread the cash tape delivered.
The gap that matters is between assets, not tenors: rates volatility at the top of everything we have recorded, equity volatility mid-range, into an inflation print and a payrolls report inside three sessions. Options carry a high risk of rapid loss.
Important note: The strategies and examples provided in this article are purely for educational purposes. They are intended to assist in shaping your thought process and should not be replicated or implemented without careful consideration. Every investor or trader must conduct their own due diligence and take into account their unique financial situation, risk tolerance, and investment objectives before making any decisions. Remember, investing in the stock market carries risk, and it's crucial to make informed decisions.
| More from the author |
|---|