Forex

Forex - Technical analysis introduction

Level: Beginner / Length: 12 minutes

Are you new to technical analysis? Then look no further! This course will introduce you to technical analysis and ‘charts’ to give you a solid understanding of these two core concepts.


How do charts work and what do they represent?

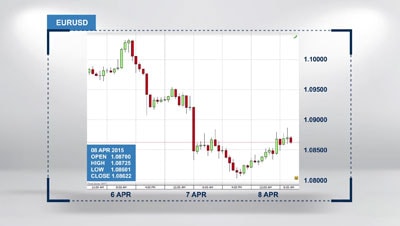
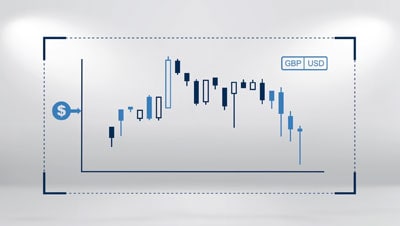
We’ll show you how candlestick charts represent information.


Charts can be a crucial element in your trading. They can help you to spot trends and even develop trading strategies. This course will serve as a starting point for all future courses on technical analysis and charting.  

This course will cover: 

  • A basic introduction to technical analysis 
  • We’ll look at how is technical analysis applied 
  • The concept of charts and their purposes 
  • Japanese candlesticks. 

Saxo Bank A/S (Headquarters)
Philip Heymans Alle 15
2900
Hellerup
Denmark

Contact Saxo

Select region

International
International

Trade responsibly
All trading carries risk. Read more. To help you understand the risks involved we have put together a series of Key Information Documents (KIDs) highlighting the risks and rewards related to each product. Read more

This website can be accessed worldwide however the information on the website is related to Saxo Bank A/S and is not specific to any entity of Saxo Bank Group. All clients will directly engage with Saxo Bank A/S and all client agreements will be entered into with Saxo Bank A/S and thus governed by Danish Law.

Apple and the Apple logo are trademarks of Apple Inc, registered in the US and other countries and regions. App Store is a service mark of Apple Inc. Google Play and the Google Play logo are trademarks of Google LLC.