
Access all our platforms from a single account.

The first earnings scorecard, and an index quieter than its parts - Options Brief - 8 October 2026

Summary: Our earnings scorecard starts today: what options charge for every Q3 report, against what each stock actually did after its last eight. It lands on a day the index was far quieter than its parts.
The S&P 500 gave up 0.22% on Wednesday. The average stock inside it gave up three times as much, and option pricing barely followed.
MARKET REGIME: LOW VOL BULL | VIX 15.08 | TERM STRUCTURE: CONTANGO | SKEW: ELEVATED (141.84) | FRONT-MONTH VIX FUTURES: 17.41
Key findings
- Breadth carried the session. The S&P 500 fell 0.22%, the equal-weight version 0.78% and the Russell 2000 1.31%.
- Dispersion moved and its price did not. The dispersion index rose 2.91% to 36.11, higher than only 21 of 60 sessions, while implied correlation at 11.28 sits above 46.
- Rate volatility holds the only extreme left. MOVE at 102.56 beats all but seven of 60 sessions against a median of 76.18.
- The earnings scorecard starts in this edition. Twenty-one companies reporting through 4 November, each with the move the option market prices for its report day against that stock’s own eight-report record. Novo Nordisk and UBS price richest at 1.6x, Microsoft cheapest at 0.5x.
Headline driver
The September meeting minutes carried a hawkish tone without a hawkish deadline. Officials backed the 25 basis point hike unanimously, then split on the reason, some pointing to supply and energy shocks unanchoring expectations and others to demand. Most judged another hike before year-end likely appropriate, with little urgency around October.The long end took the first reading and gave most of it back. The ten-year yield touched a 24-year high above 5.36% intraday before closing near 5.28%, and traded at 5.31% early Thursday. The two-year fell about 4 basis points to 4.77%, its lowest in more than two weeks.
Household borrowing costs climbed regardless. The 30-year fixed mortgage rate rose 19 basis points to 7.49% for the week ended 2 October, a seventh consecutive increase and the highest since November 2023, while the New York Fed’s one-year inflation expectation rose to 3.9% from 3.6%.
Market snapshot
- US (Wednesday 7 October close): The S&P 500 fell 0.22% to 7,801.77, ending a four-day record run, the Nasdaq 100 0.21% to 31,160.08 and the Dow 0.66% to 51,185.13, with the Russell 2000 weakest at 1.31%. Industrials led sector losses at 2.18%, Caterpillar off 5.8%, while health care gained 1.03%. Meta fell 2.38% and Nvidia 0.74%, against gains for Apple, Amazon and Alphabet.
- Europe: A sharp reversal on banking weakness and French fiscal concern. The Euro Stoxx 50 fell 1.47% to 6,180.30 and the Stoxx Europe 600 1.00% to 630.26, banks down 3.38%. The DAX lost 1.35%, the CAC 40 1.22%, the FTSE 100 0.8%.
- Asia (Thursday morning): Korea is weakest, the Kospi down 2.11% to 6,660.13 after Samsung guided third-quarter profit short of consensus. The Nikkei 225 is 1.12% lower at 69,252.08 and the Hang Seng 0.69% lower, its technology sub-index down 1.93%.
- Commodities and rates: Brent trades near 102.2 and West Texas Intermediate near 89.8, supported by a Gulf storm shutting in about 500,000 barrels a day. Gold sits near 4,138. The thirty-year yield is 5.70%, the ten-year 5.31%, the two-year 4.78%.
- Market regime: Low volatility bull: VIX 15.08, the cash curve in contango, twenty-day realised volatility 9.98%, the index 1.58% above its fifty-day average.
Source: Saxo, Bloomberg, CBOE. Levels as of the 7 October close unless stated. Yield levels come from the published close, not the export’s change column. Past performance is not indicative of future results.
Volatility surface
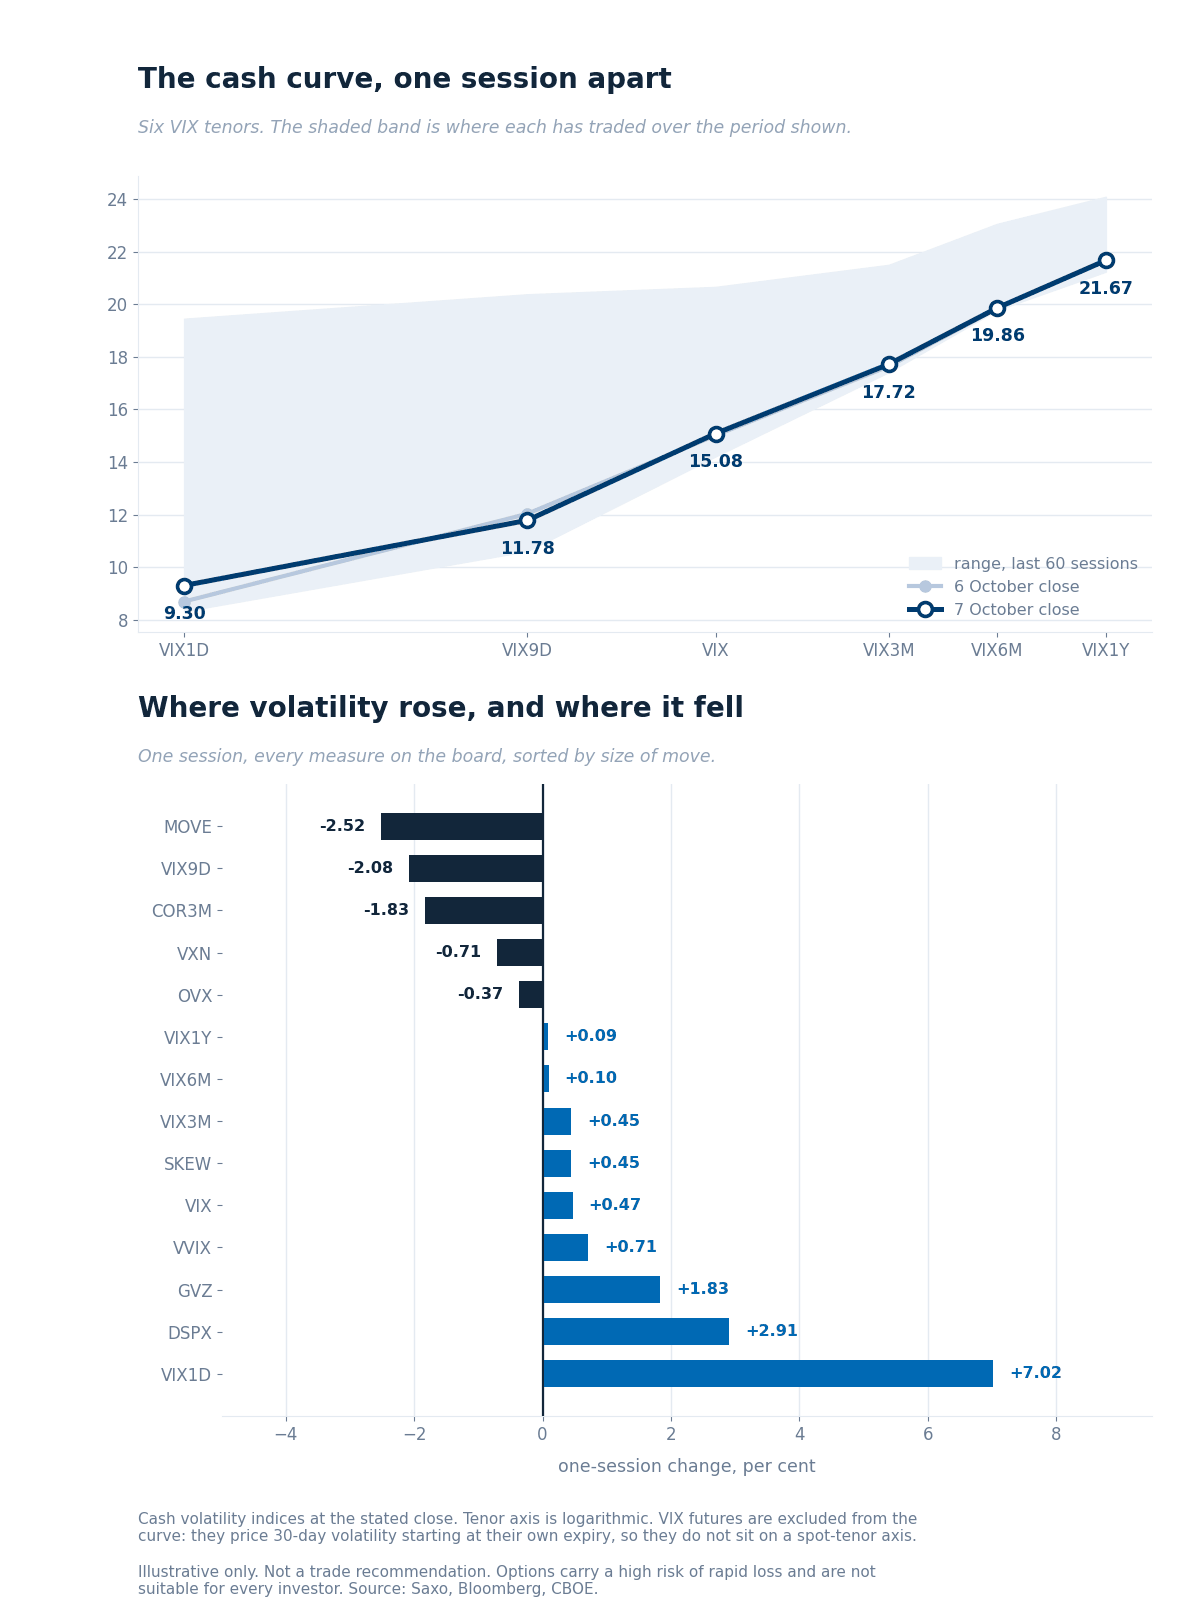
The six cash VIX tenors at Wednesday’s close against the prior session, over their 60-session ranges.
Reading the curve
- The curve split at the front. VIX1D rose 7.02% to 9.30 while VIX9D fell 2.08% to 11.78, so one-day pricing firmed and the two-week reading eased behind it. Everything from three months out moved by less than a tenth of a point.
- The price of volatility moving stays near the floor. VVIX at 83.18 is lower than 57 of 60 sessions against a median of 90.14, and the second-month VIX future at 17.70 lower than 59.
- Ratios the graphic leaves out. VIX3M to VIX is 1.175 against a median of 1.176, an ordinary shape at a low level. The Nasdaq premium at 1.393 sits below its median of 1.418. SKEW at 141.84 is high against a long-run norm nearer 115 and below its three-month median of 144.35.
VIX futures
- Parity puts the October forward at 17.33 and the November at 17.65, each within 0.09 of its feed and both the contracts the last edition read, so neither has rolled.
- The premium to spot widened to 2.25 points from 2.08. Spot rose 0.07 and the October forward 0.25, so the forward did the work.
Source: Saxo, Bloomberg, CBOE, 8 October 2026, approx. 06:00 CET. Past performance is not indicative of future results.
Single-name volatility
Saxo’s implied-volatility rank across 186 US and 343 euro-zone option underlyings, where 0 is a one-year low and 100 a high. Both universes are unchanged in size from yesterday, so the medians compare directly.
- The typical name barely moved while the distribution stayed wide. US median rank is 44.9 against 43.7, on median implied volatility of 32.3, and Europe firmed to 48.0 from 45.5. Thirty-one of 186 US names sit at rank 20 or lower against ten at 80 or higher.
- The spread between sectors is where the day’s dispersion shows up in pricing. Rates and credit carry a median rank of 69.9 and health care 67.6, against technology at 38.8 and digital assets at 10.3.
- Health care supplies four of the ten US names at rank 80 or above, Danaher at 97.3 and Merck at 92.7, with the refiners Marathon Petroleum at 93.7 and Valero at 82.2 behind them. Nvidia sits at 5.8, near its own one-year low.
- The long-bond fund ranks 83.7 on implied volatility of 15.3 and carries a percentile of 97.6, so it prices above almost every day of the past year while sitting off the year’s high. Rank measures distance from the extremes and percentile counts the days. See Saxo pricing for costs and charges.
Data source: Saxo, as of 8 October 2026, reflecting the 7 October close. Past performance is not indicative of future results.
Options flow sentiment
Based on end-of-day 7 October, Wednesday’s positioning and not today’s price action.Ten reports, one verdict: the cash market dispersed and the option tape did not trade it. Nine of the ten came back unreadable, with size sitting in calendar rolls, multi-leg packages and mid-market crosses.
- Single-name flow ran to supplied premium rather than to a direction, with the only paid-for conviction in memory and storage names.
- Sector and ETF flow showed no near-dated index hedge and no volatility-product trade anywhere in the set. Named funds are market context only; see Saxo pricing for costs and charges on exchange-traded fund trades.
Where the week's range sits
What the option market priced for this week, drawn around Friday’s close.
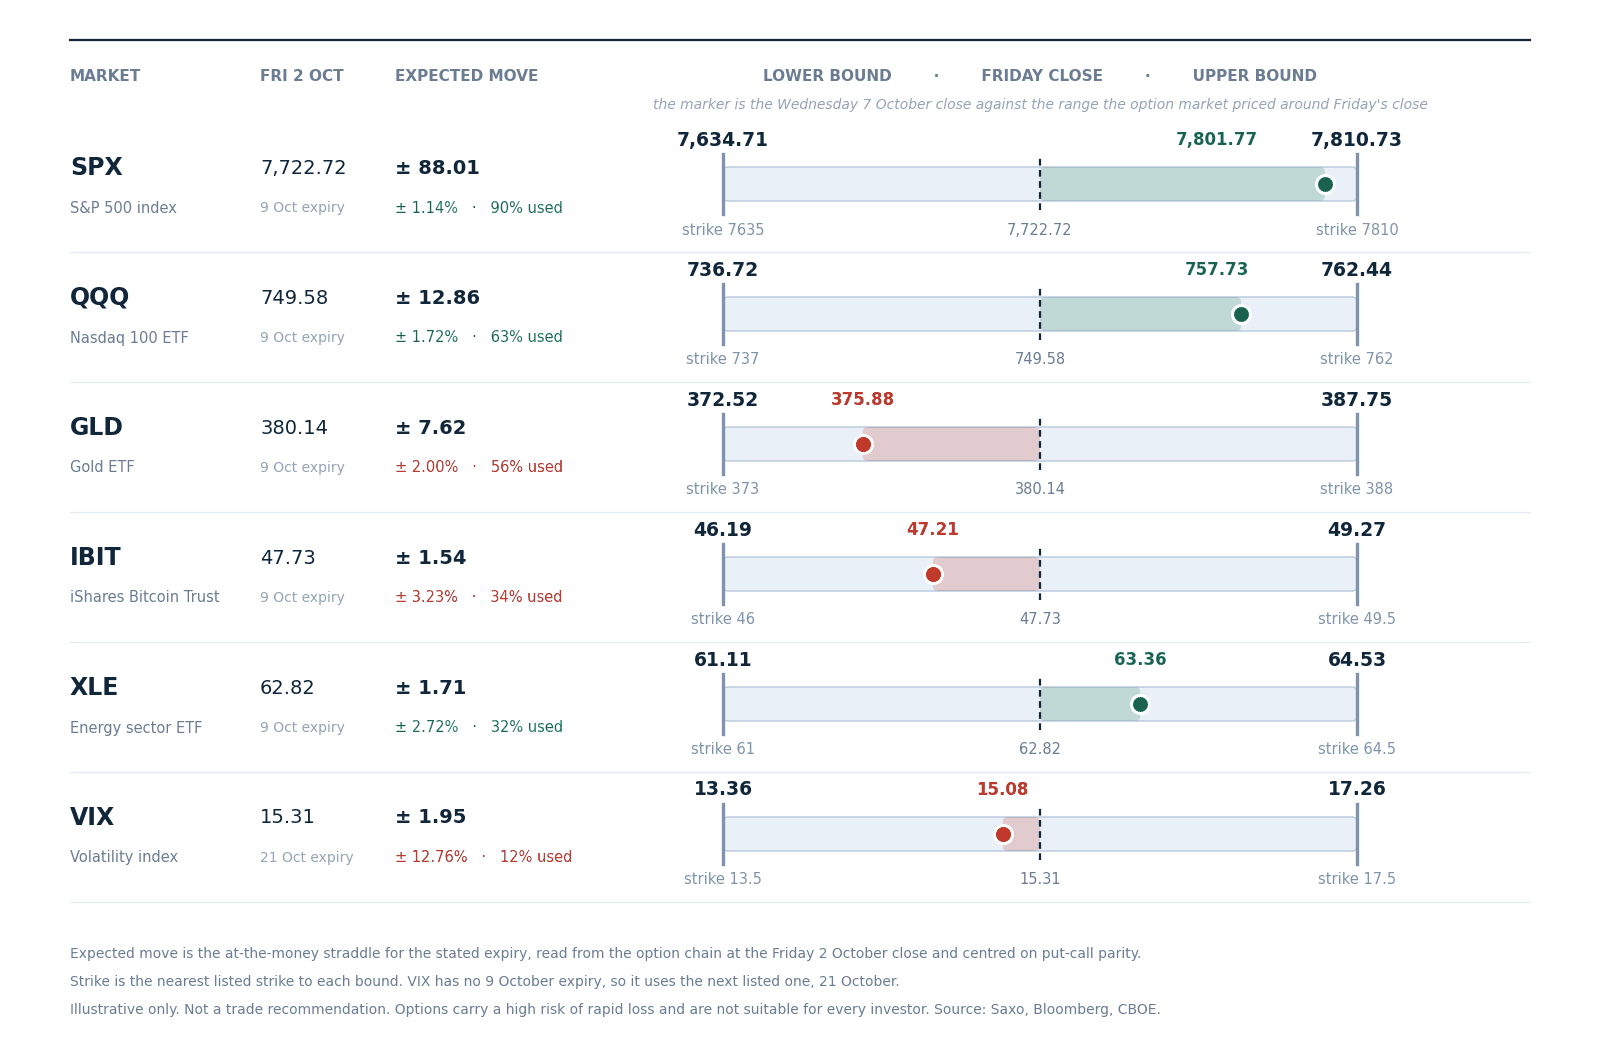 Expected move to Friday 9 October, drawn around the 2 October close with the nearest listed strike at each bound, derived from option-implied pricing. Volatility uses the 21 October expiry, which is the next listed one. Read from the chain at Friday’s close, not a forecast.
- The index has used almost the whole week with one session to run. The S&P 500 closed Wednesday at 7,801.77, 90% of the way to the band top of 7,810.73 drawn around Friday’s 7,722.72.
- The rest of the board is unremarkable. The Nasdaq 100 fund has used 63% of its band upward and energy 32%, while gold sits 56% below its anchor, the bitcoin fund 34% below and volatility 12% below.
- A band this close to spent says the option market priced a quieter week than the one that arrived. It is not a forecast that the index stops here. Options carry a high risk of rapid loss and are not suitable for every investor; see Saxo pricing for costs and charges.
Today's catalysts
The US cash session runs 15:30 CET to 22:00 CET. Weekly initial jobless claims arrive at 14:30 CET, an hour before the open, and the calendar carries little else.
That leaves earnings to supply the single-stock movement the index has been absorbing all week. PepsiCo, Progressive, Fast Retailing and Tesco report today, Delta Air Lines on Friday. Future outcomes are uncertain and may result in losses.
Earnings scorecard
The scorecard is new, and it runs with every edition from today. For each company it shows the move the option market prices for its report day, set against the average move that stock actually made after its last eight reports, so the premium reads against the name’s own record rather than against the market’s. The implied-volatility rank beside it does separate work: it says whether a stock’s volatility is generally high, or whether the premium sits in the report itself.
These are the twenty-one names we will cover individually this earnings season, in the order they report, beginning with the banks on 13 October.
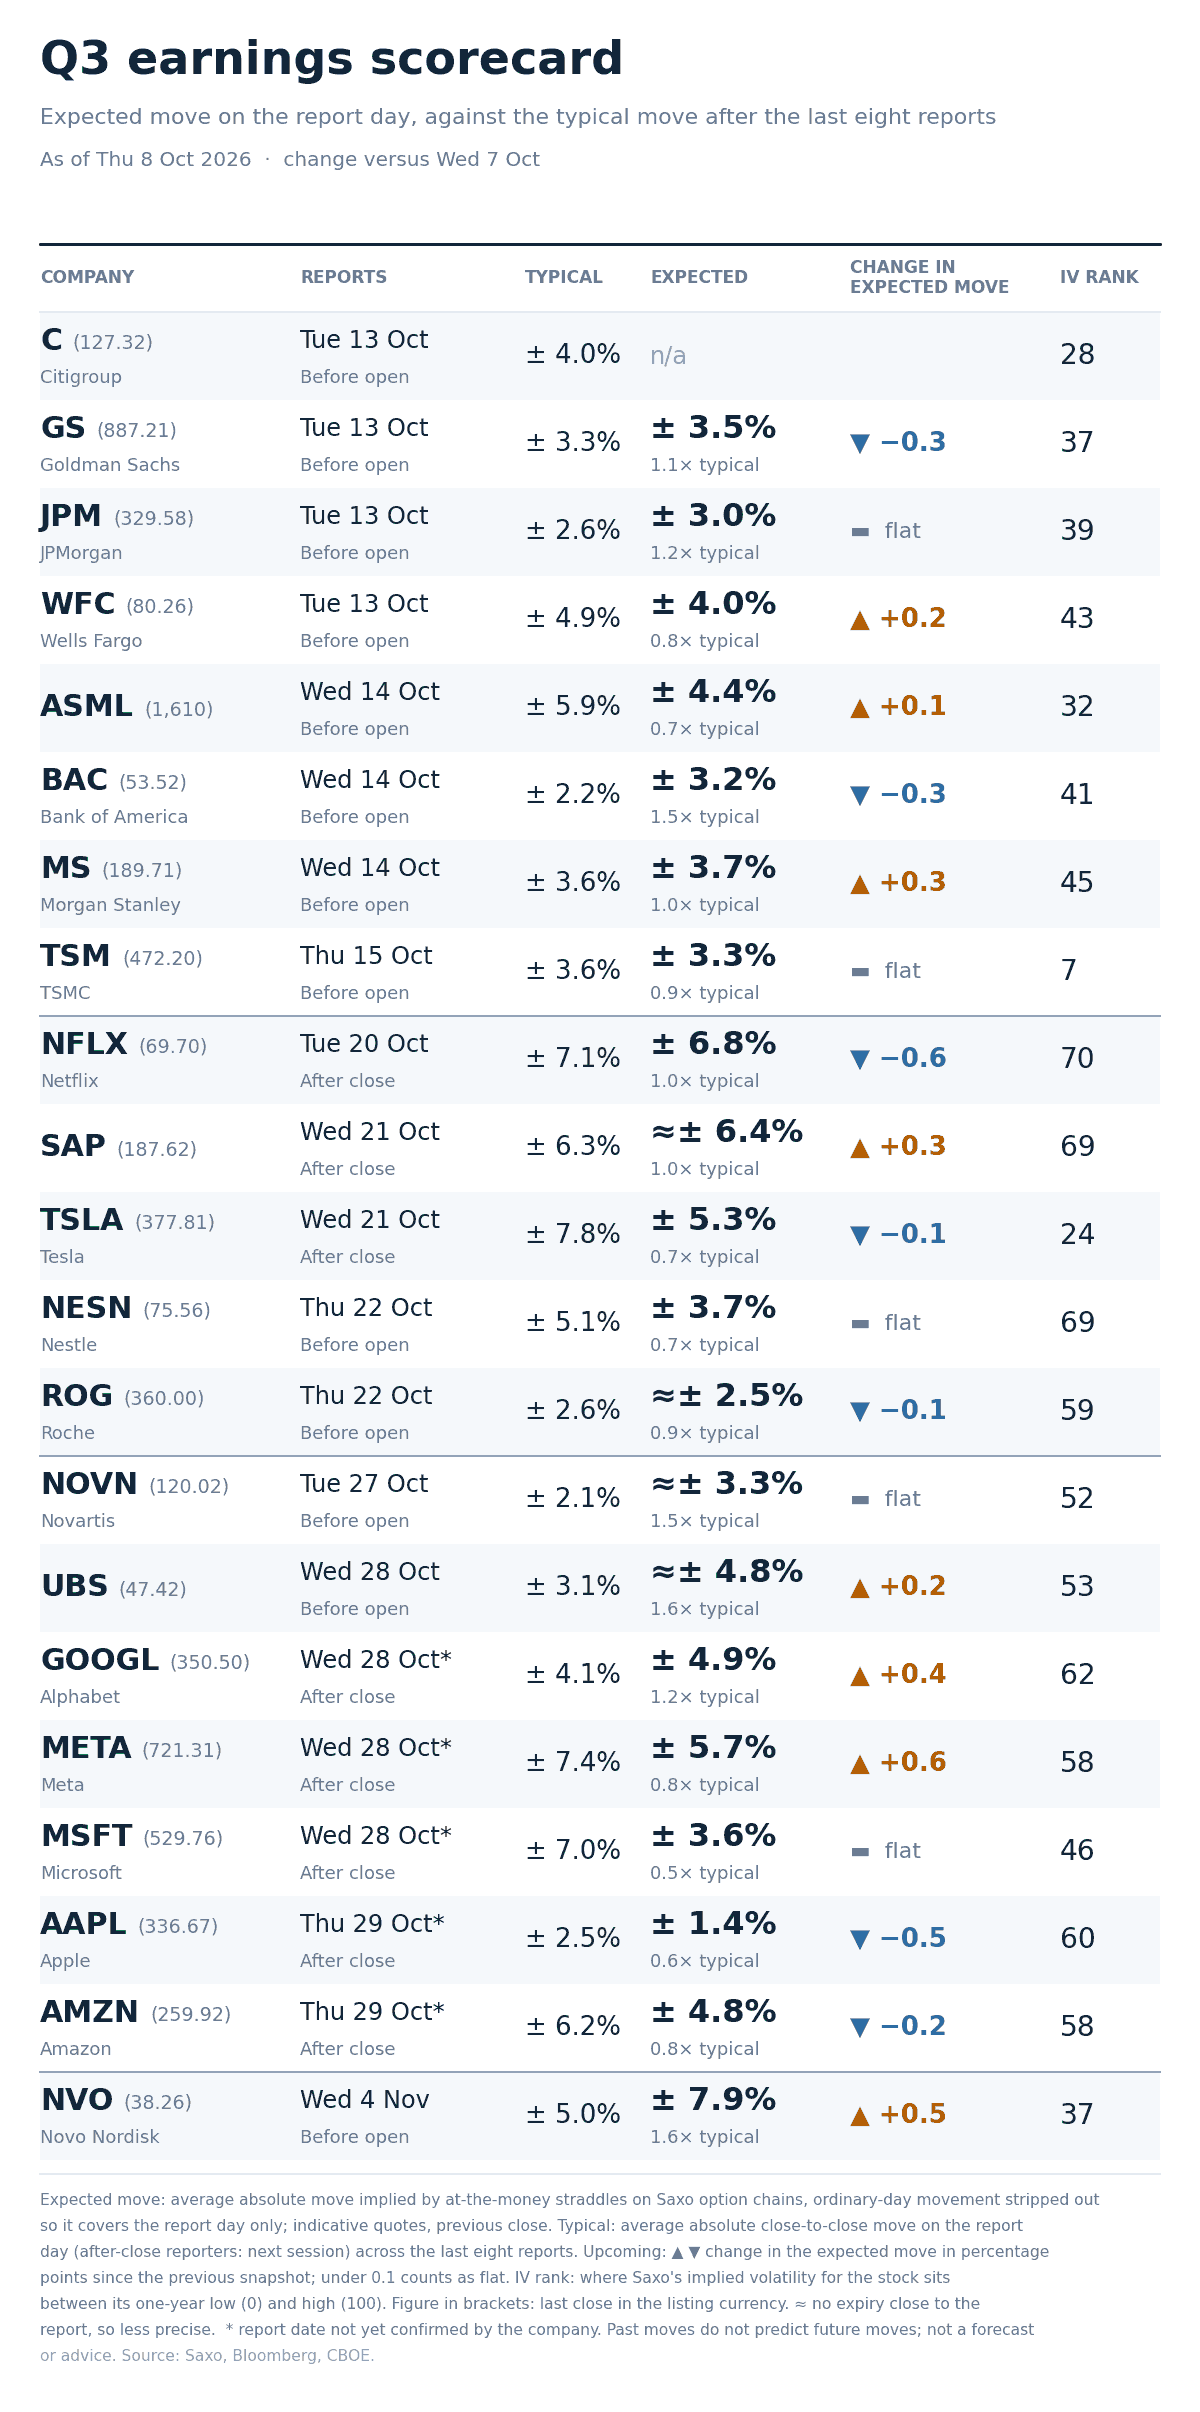 Expected move on each report day against the stock’s average move after its last eight reports, with implied-volatility rank and the last close, read from Saxo chains at approximately 06:00 CET. Quotes before the US open are indicative.
- The spread is wider than anything the index measures show. Novo Nordisk prices 7.9% against a typical 5.0% and UBS 4.8% against 3.1%, while Microsoft prices 3.6% against 7.0% and Apple 1.4% against 2.5%.
- Rank and event premium are not the same thing, which is the column’s point. Novo Nordisk carries the richest event premium on an implied-volatility rank of 37, so the cost sits in the report rather than in the stock. Netflix runs the other way at rank 70 with a report-day move in line with its own history, and Taiwan Semiconductor prices 0.9x on a rank of 7.
- Next week’s banks sit close to their own records, Goldman Sachs at 3.5% and Morgan Stanley at 3.7%, with Bank of America the outlier at 3.2% against a typical 2.2%.
- In our assessment the event market may already be charging for the dispersion the index measures have not picked up, which is the gap the correlation reading describes. Options carry a high risk of rapid loss and are not suitable for every investor; see Saxo pricing for costs and charges.
What the market is pricing
- Session implied move. SPXW options price 32.55 points, or 0.417%, to tonight’s close and 47.55, or 0.610%, to Friday’s, derived from option-implied pricing. Quotes before the US open are indicative.
- What the clock explained. Friday’s expiry priced 58.35 points yesterday and 47.55 now, where decay alone leaves about 47.6. The entire decline is the clock, so implied volatility for that expiry has not moved.
- Correlation read. Implied correlation at 11.28 beats 46 of 60 sessions while dispersion at 36.11 beats 21. In our assessment the index may still be priced as one object on a session its components did not behave like one.
- Tail risk signal. SKEW at 141.84 sits below its three-month median, VVIX holds near the floor of its window and the front-month premium to spot widened to 2.25 points. In our view the market may be paying little for a shock while charging for the forward.
The gap worth watching sits between what the cash market did and what the option market charged for it. Breadth broke on Wednesday, the index did not, and the measures that price the difference barely moved.
In our view that may resolve either way, and the week’s range is nearly spent. Options carry a high risk of rapid loss and are not suitable for every investor.
Important note: The strategies and examples provided in this article are purely for educational purposes. They are intended to assist in shaping your thought process and should not be replicated or implemented without careful consideration. Every investor or trader must conduct their own due diligence and take into account their unique financial situation, risk tolerance, and investment objectives before making any decisions. Remember, investing in the stock market carries risk, and it’s crucial to make informed decisions.
| More from the author |
|---|