
Access both platforms from your single Saxo account.

Meta earnings: options price a smaller move than Meta usually makes

Summary: Meta’s shares moved more than 7.5% after five of its last eight reports. Option prices on the first expiry after the 21 October report expect about 7.1%. Two example structures show what each reading relies on.
Meta’s shares usually move a lot after a report. This time, options expect a little less.
Meta publishes its third-quarter 2026 results after the US market closes on Wednesday 21 October 2026. In July, the company said it expects to spend USD 130-145 billion on capital expenditures in 2026 (Source: Meta, company announcement, 29 July 2026).
This article leaves the result aside and looks at a simpler question that options can help answer: how big a move does the market expect, and is that more or less than Meta usually moves?
How much Meta usually moves
Meta has reported eight times since October 2024. Four times the shares rose the next day, and four times they fell, so the direction has been a coin flip. The size has been more consistent. In five of the eight reports, the shares moved more than 7.5% in a single day. The biggest fall was 11.3%, in October 2025 (Source: Saxo price data, author calculation). Past performance is not indicative of future results.
One simple way to sum up those eight moves is the median: line them up from small to large and take the one in the middle. For Meta, that is about 8.3%. The average is a little lower, at about 7.4%, because three quiet reports pull it down. For Meta, big moves have been the normal case.
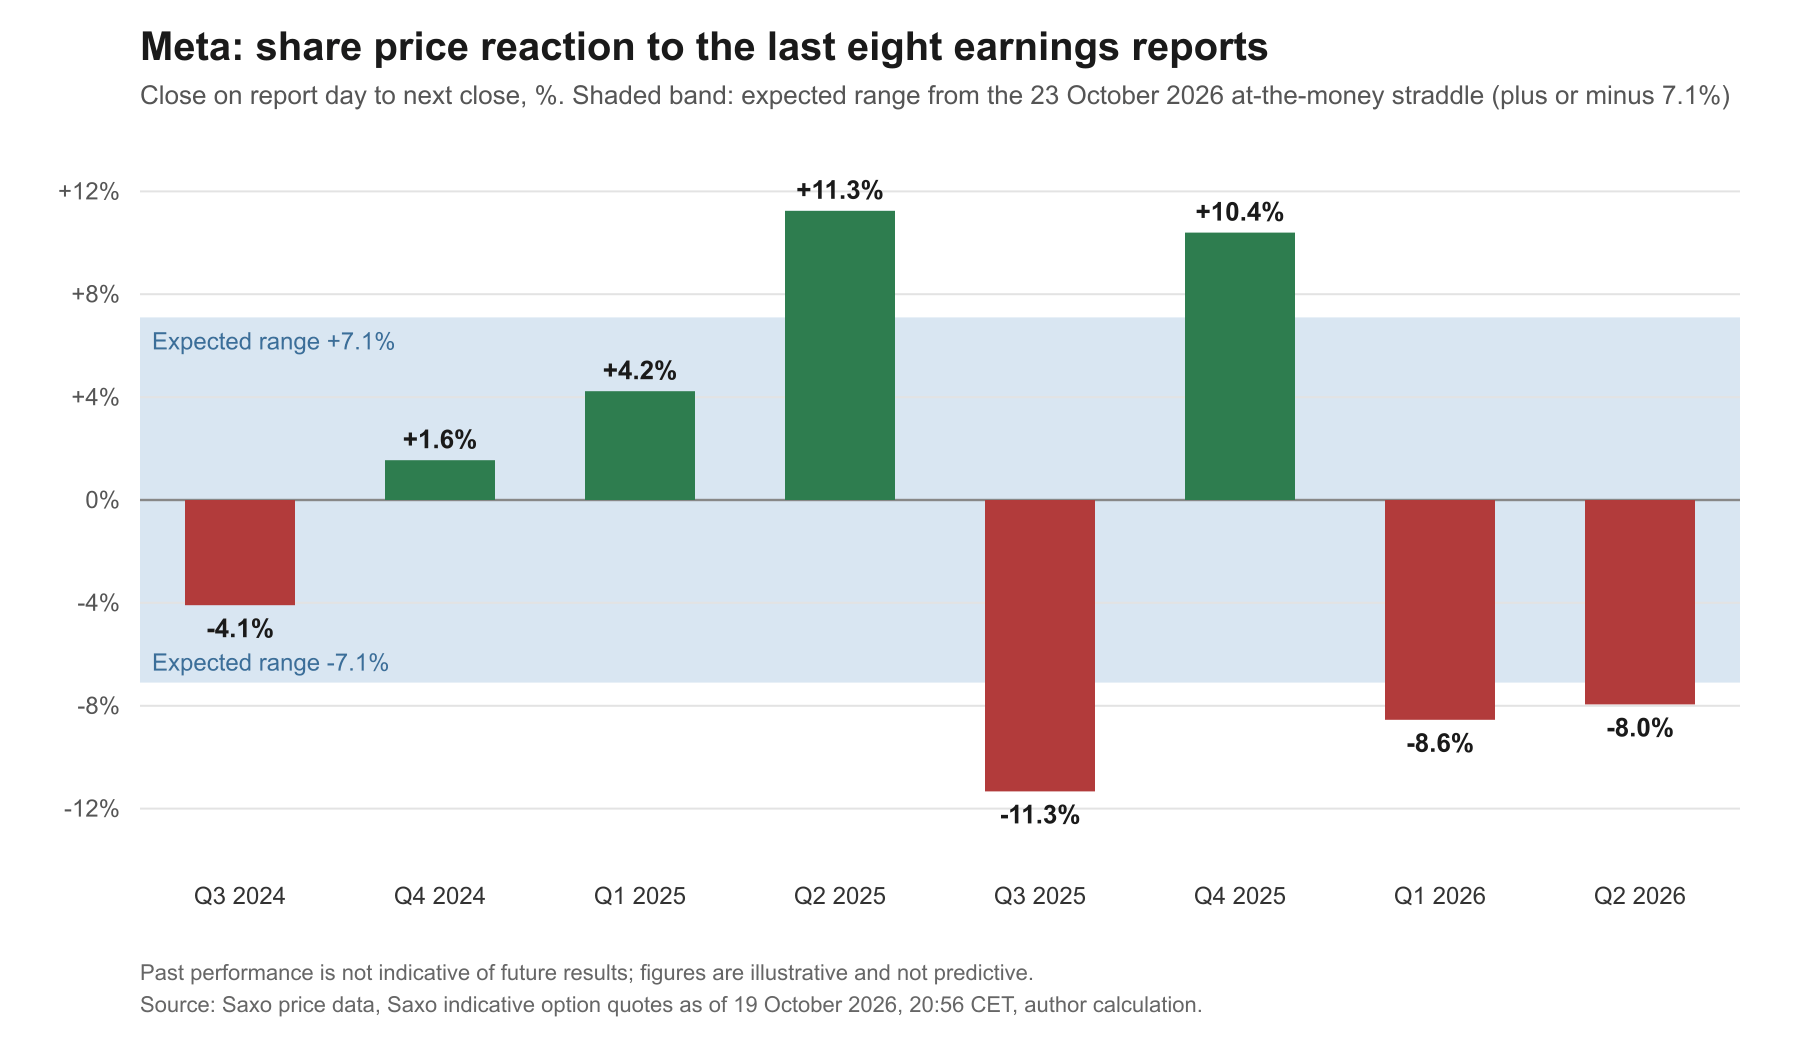 Share price move from the close on report day to the next close, last eight reports, against the range of plus or minus 7.1% priced by the at-the-money straddle on the 23 October 2026 expiry (indicative Saxo quotes as of 19 October 2026, 20:56 CET). Past performance is not indicative of future results; figures are illustrative and not predictive. Source: Saxo price data, Saxo option quotes, author calculation.
What the options market expects
Option prices also hold an estimate of how far a share might move. A quick way to read it is the straddle: the cost of buying both the call and the put at the strike closest to the share price. By expiry, the shares have to move more than that combined cost before the pair is worth more than it cost. So the straddle price is roughly the move the market is paying for.
For Meta, the first expiry after the report is 23 October 2026. With the shares at about 704, the closest strike is 705:
- 705 call: about 25.05
- 705 put: about 25.125
- Straddle (call + put): about 50.175 (25.05 + 25.125), or 7.1% of the share price
- Expected range: roughly 655 to 755
(Source: Saxo, indicative mid prices as of 19 October 2026, 20:56 CET.) Anyone can repeat this sum on a Meta option chain, though prices will have changed since.
So the market expects a move of about 7.1%, while Meta’s typical move has been about 8.3%. That 7.1% also covers the normal trading days before expiry, so the part linked to the report itself is a little smaller. Both examples below start from the gap between these two figures. A lower price does not mean the market is wrong; it may simply expect a calmer report this time. Options carry a high risk of rapid loss and are not suitable for every investor.
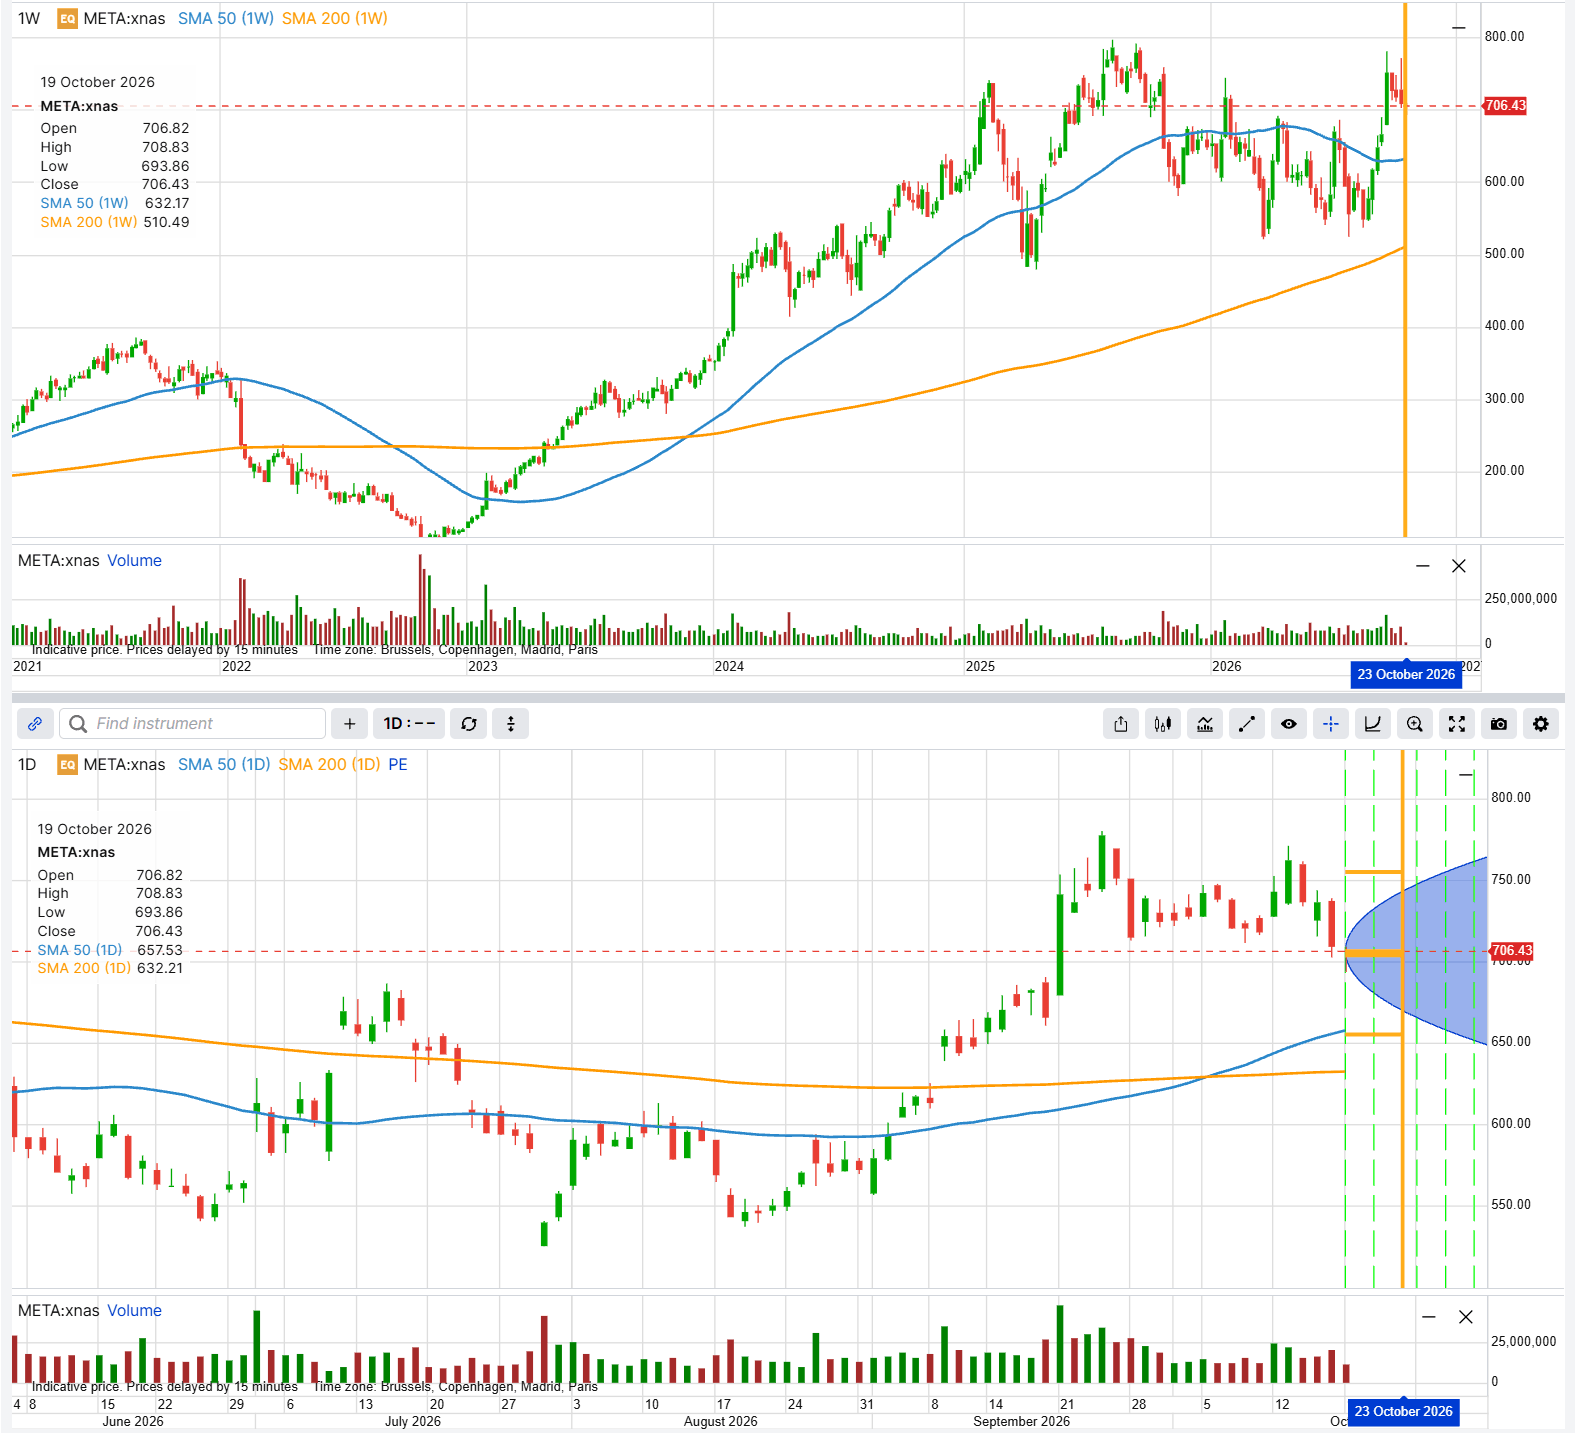 Meta share price, weekly (top) and daily (bottom), with the 23 October 2026 expiry marked. The horizontal lines mark the strikes used in the two examples below, and the shaded area shows the range implied by option prices. Past performance is not indicative of future results. Source: SaxoTrader.
Important note: The strategies and examples provided in this article are purely for educational purposes. They are intended to assist in shaping your thought process and should not be replicated or implemented without careful consideration. Every investor or trader must conduct their own due diligence and take into account their unique financial situation, risk tolerance, and investment objectives before making any decisions. Remember, investing in the stock market carries risk, and it’s crucial to make informed decisions.
Why option prices usually drop after a report
Before a report, options are expensive because nobody knows the numbers yet. Once the results are out, that uncertainty is gone, and option prices usually fall quickly, even if the shares hardly move. Traders call this IV crush, after implied volatility (IV), the amount of movement that option prices assume. It matters for both examples below. It tends to work against someone who buys options and in favour of someone who sells them.
How the strikes and the expiry were chosen
The expiry is 23 October 2026, two days after the report. A later expiry would include more normal trading days, so it would cost more and depend less on the report.
Both examples start from the same strike, 705, the one closest to the share price:
- Long straddle: buying the 705 call and the 705 put.
- Iron butterfly: selling the same call and put, and buying cheaper protection on each side, about one straddle price away, rounded to the nearest listed strikes (655 and 755).
Changing a strike changes the trade-off. Protection placed further away brings in more money but raises the maximum loss. Buying a call and a put further from the share price (a strangle) costs less than a straddle but needs a bigger move.
All examples use indicative Saxo mid prices as of 19 October 2026, 20:56 CET, and contracts of 100 shares; actual prices will differ. All figures are hypothetical and for education only. Options carry a high risk of rapid loss and are not suitable for every investor. Costs and charges apply to each leg and vary by account and venue; check the applicable rates before entering any position.
View 1: Meta moves as much as usual
Long straddle (illustrative only, not a trade recommendation)
The idea is to buy both the call and the put. If the shares jump, the call gains; if they fall, the put gains. Either way, the move has to be big enough to pay for both options.
The risk first: the price paid for the two options is the most that can be lost. That happens if Meta closes at or near 705 on 23 October 2026, and IV crush is likely to lower the value of both options from the morning after the report. Beyond the break-even points the position gains, with no fixed limit.
- Buy 1 705 call at 25.05
- Buy 1 705 put at 25.125
- Net debit: about 50.175 per share (25.05 for the call + 25.125 for the put), or USD 5,017.50 per contract
- Maximum risk: about USD 5,017.50; maximum profit: not capped (hypothetical, for education only)
- Break-even at expiry: about 654.83 and 755.18
- Risk: the maximum loss is the full premium paid, with the worst outcome if Meta closes at or near 705 at expiry. Costs and charges apply to each leg and vary by account and venue.
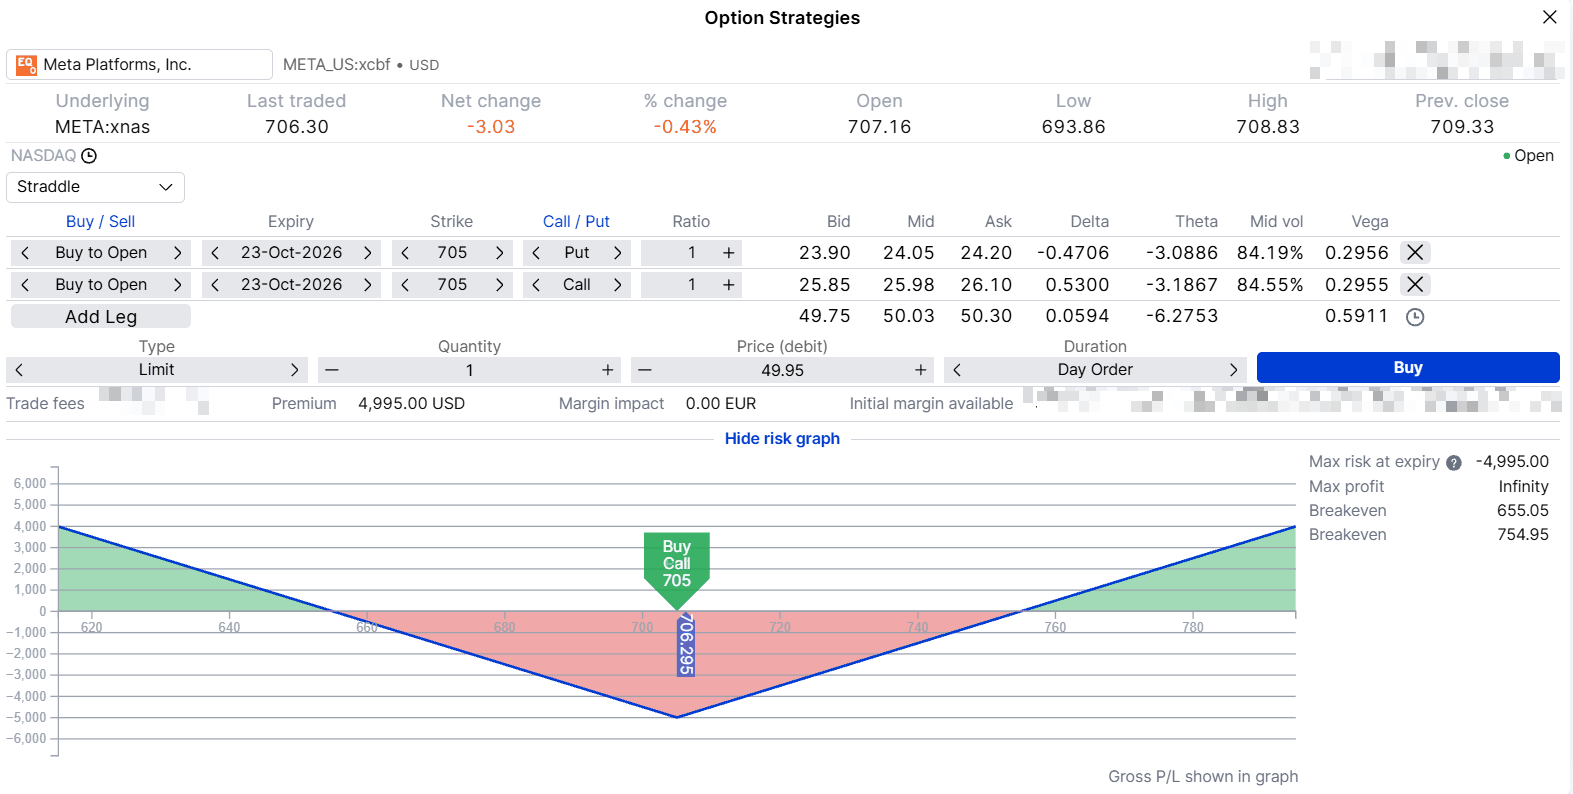 Long straddle, 705 call and 705 put, 23 October 2026 expiry, payoff at expiry. Hypothetical example for education only, indicative prices as of 19 October 2026, 20:56 CET. Past performance is not indicative of future results; figures are illustrative and not predictive. Source: SaxoTrader.
View 2: this report is calmer than the last ones
Iron butterfly (illustrative only, not a trade recommendation)
The idea is the opposite of View 1. Sell the 705 call and put and collect their price, then buy a cheaper put below and a cheaper call above. Those two bought options put a limit on the loss if the shares move a lot.
The risk first: if Meta closes beyond either bought option, the loss reaches its maximum of about USD 1,492.50 per contract. If the shares stay close to 705, the position keeps most of the money collected, and IV crush may help. The further the shares move from 705, the smaller the profit.
- Sell 1 705 put at 25.125
- Buy 1 655 put at 7.125
- Sell 1 705 call at 25.05
- Buy 1 755 call at 7.975
- Net credit: about 35.075 per share (18.00 from the puts + 17.075 from the calls), or USD 3,507.50 per contract
- Maximum risk: about USD 1,492.50 (wing width 50.00 less the 35.075 credit, or 14.925 per share); maximum profit: about USD 3,507.50 (hypothetical, for education only)
- Break-even at expiry: about 669.93 and 740.08
- Risk: the maximum loss is the wing width minus the net credit; sold options can be assigned early. Costs and charges apply to each leg and vary by account and venue.
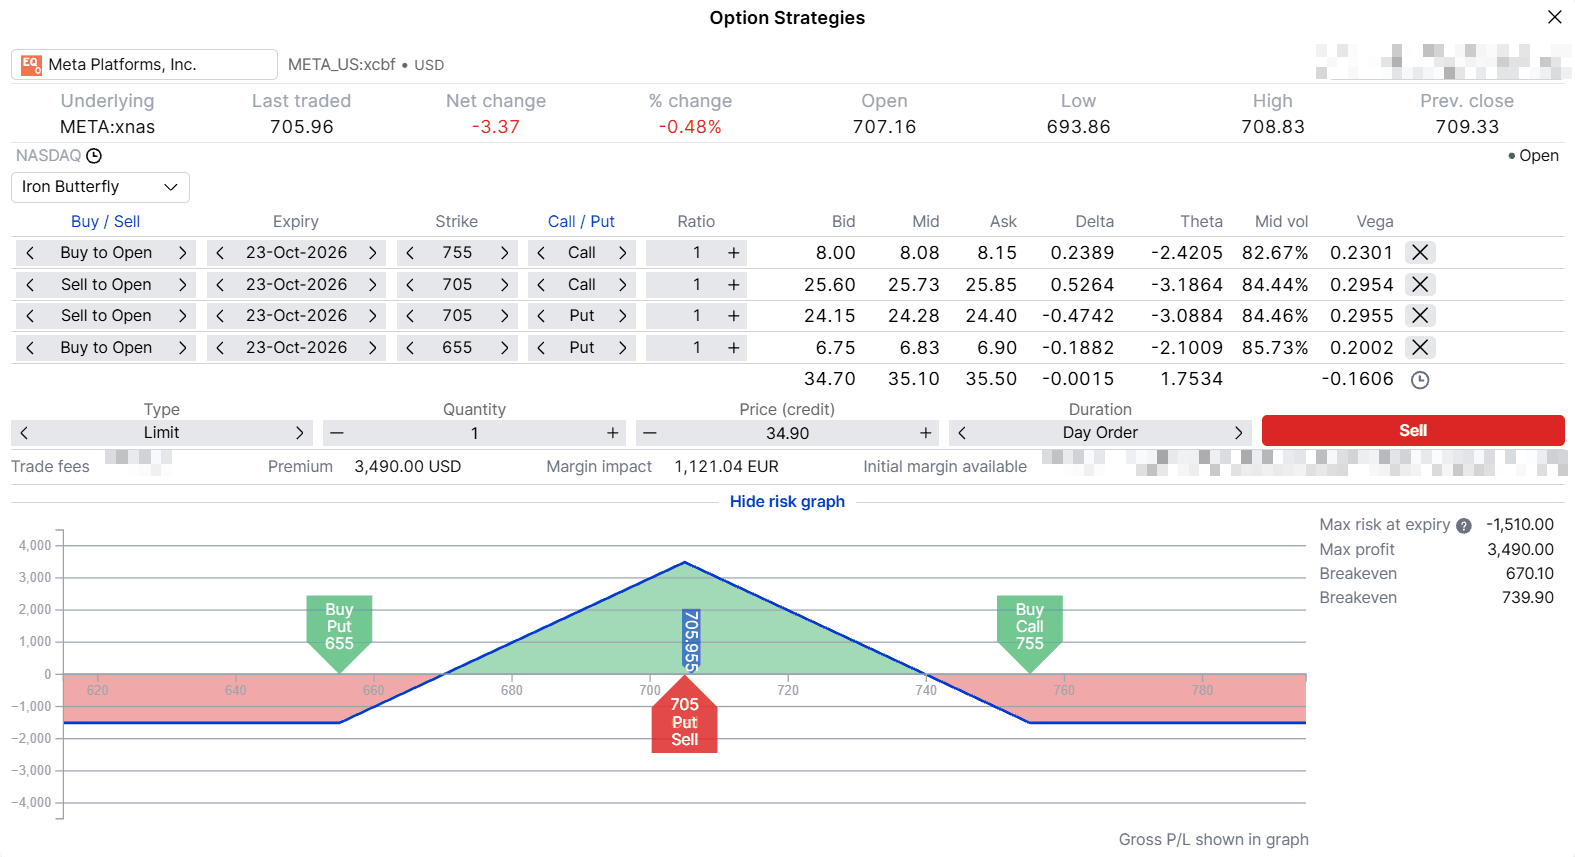 Iron butterfly, 655/705 puts and 705/755 calls, 23 October 2026 expiry, payoff at expiry. Hypothetical example for education only, indicative prices as of 19 October 2026, 20:56 CET. Past performance is not indicative of future results; figures are illustrative and not predictive. Source: SaxoTrader.
Same eight reports, two readings
The two examples are mirror images. The straddle gains at expiry only if Meta moves more than about 7.1% either way, and five of the last eight reports did that. The butterfly gains only if Meta stays within about 5% either way, and three of the last eight did that. Earlier moves came at different option prices, and past performance is not indicative of future results, so this tells us nothing about 21 October 2026. It does show what each example relies on, and both can lose their maximum. The straddle loses on a quiet report, like those in 2024 and early 2025. The butterfly loses on a report like most of the others.
Before any position: practical points
- Costs add up with every leg. Each leg has its own commission and its own gap between the buy and sell price. One order can hold up to four legs, so each example fits in a single order.
- Timing. Meta reports after the close. The first reaction shows up in after-hours trading and in the opening price on 22 October 2026, before most positions can be changed.
- The exit. Deciding before the report whether to close on 22 October 2026 or hold to expiry is easier than deciding mid-move.
- Assignment. Meta options are American-style, so a sold option that moves into the money can be exercised against the seller before expiry.
Final thoughts
Meta’s shares have usually moved a lot after a report, up or down. This time, option prices expect a little less. In our view, the more useful question may be whether that history still applies. The direction split evenly over the last eight reports.
The two examples show both answers. Each has a maximum loss known in advance, and each loses in exactly the case the other is built for. Which, if either, fits depends on a reader’s own view, risk tolerance and the prices available at the time. Options carry a high risk of rapid loss and are not suitable for every investor.
The author does not hold positions in any of the instruments mentioned in this article. The Author is permitted to wait at least 24 hours from the time of the publication before they trade the instruments themselves.
| Related articles/content |
|---|
| Tesla earnings the median says small the average says big What do options price | 19 Oct 2026 ASML earnings three ways to read the move options are pricing | 12 Oct 2026 Two banks one morning what options price for Goldman Sachs and Wells Fargo earnings | 9 Oct 2026 Same coin different payoffs an options toolkit for earnings season | 7 Oct 2026 Earnings season is close to a coin flip The edge is in what happens next | 5 Oct 2026 Finding unusually expensive or cheap options in the Saxo screener | 18 Sep 2026 Implied volatility rank what it measures and what it misses | 11 Sep 2026 Nine prints later what Q2 earnings season taught us | 11 Aug 2026 What IV crush really means in practice reviewed version | 9 April 2026 Trading earnings with defined | 31 Mar 2026 |
| More from the author |
|---|