Outrageous Predictions
Executive Summary: Outrageous Predictions 2026
Saxo Group
Head of Macroeconomic Research
The goldilocks economy is falling apart: global PMI are getting lower, liquidity stress can be seen in USD money markets, early signs of recession are popping up in the US, and geopolitical risk remains high due to the risk of trade war and tensions between Sunni and Shiite Muslims in the Middle East.
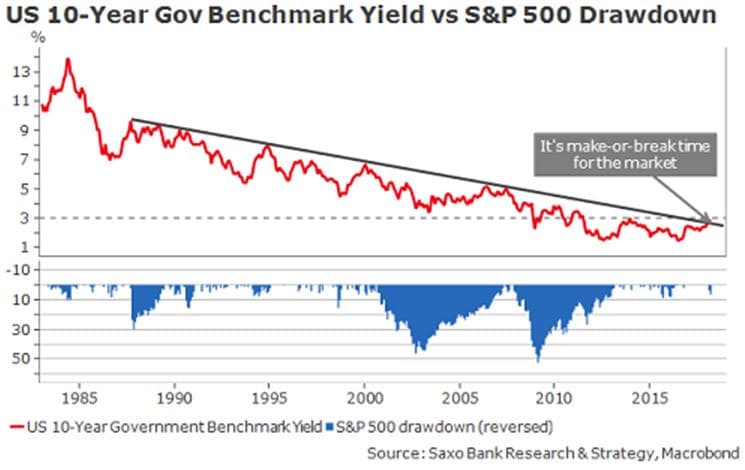
Contrary to what has been written here and there, there is no magic surrounding the 3% level on US 10-year government benchmark yields. So far, short-term movements on the US bond market are mainly the result of a downward adjustment of global growth expectations. Recent hard and soft data have confirmed that the global momentum is losing steam, contrary to what the consensus expected at the end of 2017. Therefore, it is certainly too early to panic but, as we can see in the graph below, in the long run, there is little doubt that if US interest rates continue to increase, it will lead to downward pressures on the equity market, as was the case since the 1980s.
The S&P 500 drawdown could be as little as 10% as it was in 1994 or it could reach much higher levels, as was the case in the mid-1980s at nearly 30%.
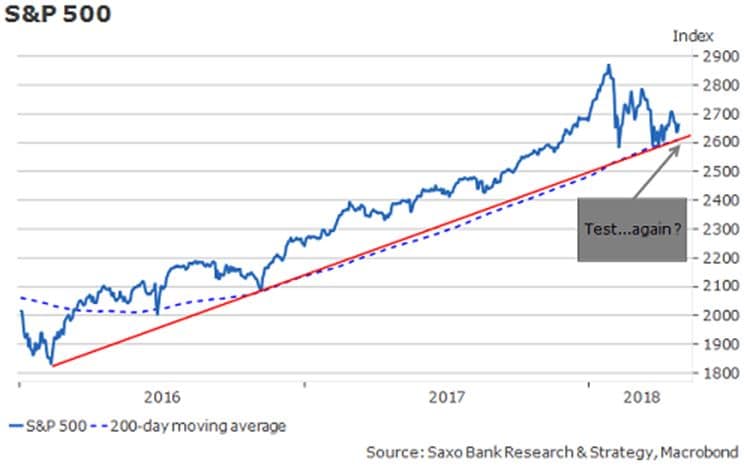
Many major markets are sitting at critical technical levels. Despite a very positive earnings season in the US (earnings per share growth is at 24% versus expectations of 17% and sales growth is about 10% year-on-year, the highest level in 10 years), risk sentiment has turned negative over the past few weeks – earnings were solid but the good news was already priced into stocks.
In this context, the market is focusing on rising risks and a gloomier macro outlook, and many investors wonder if the February selloff was enough. The S&P 500 is at the crossroads: the trendline that has been in place over the past two years is now barely hanging on, together with the 200-day moving average.
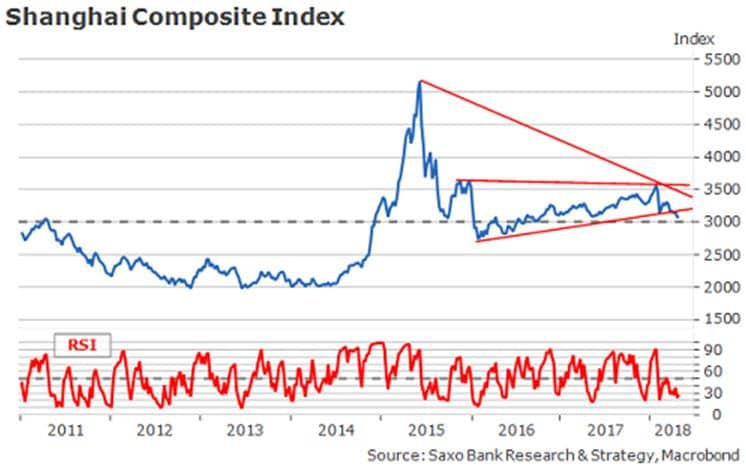
Further downside is highly possible and if that were to happen, it is not unlikely that Asian markets will be the first to fall. In November 2017, the decline in China’s stock market resulted in a lagging consolidation of the US and the European stock markets. Since mid-2016, the Shanghai Composite Index has evolved in a range of 500 basis points between 3,000 and 3,500 bps (see graph below). It is quite obvious that the support level at 3,000 points represents an important psychological turning point that the Chinese authorities don’t want to see broken anytime soon.
Over the last few days, Beijing has tried to prop it up but with a rather mixed success so far. What is even more worrying is that the decline in equities has been recently driven by China’s domestic consumer sector, which might be a sign of the economy’s deeply rooted troubles.
In the coming weeks and months, investors will have to get used to a challenging and risky combination of lower liquidity, higher volatility, and disappointing data. This is a pivotal period for the market: solid data continue to be released but when we look under the hood, we see that the economy is clearly losing momentum. Let us take the example of US Q1 GDP: the headline GDP number beat the consensus but some of the most important US GDP drivers are falling. Capex contributed only half the amount it did in Q4'17 and the “strong consumer” narrative is clearly done for, since consumption growth was up only 1.1% in Q1.
The outlook for the US is getting uglier each day. The main macro theme for the US in the coming quarters is the risk of stagflation. It is becoming real and it has not been priced in yet. The market impact will be completely different to "Trumpflation" in late 2016 and it will likely be quite negative.
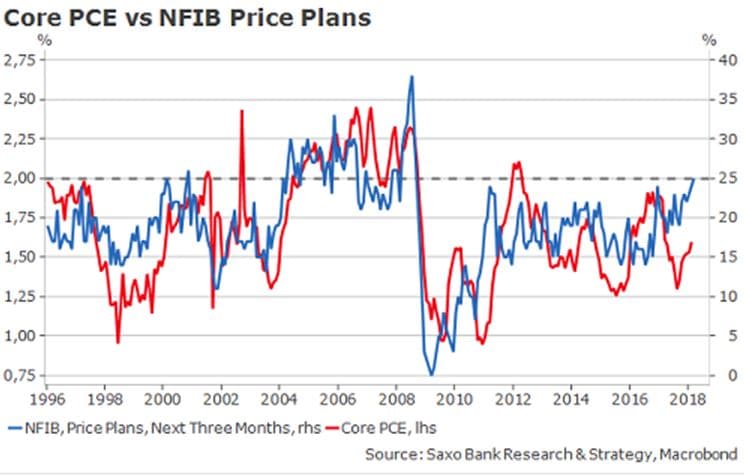
The uptrends in core CPI and core PCE are now well-established. As we can see below, there is a very strong correlation between core PCE and NFIB price plans. In the last NFIB survey, the proportion of small businesses that signalled price increases has reached the highest level since 2009, which should fuel higher inflation in the medium term. The problem is that what is good for Main Street (higher wages) is not always good for Wall Street, especially if growth is doomed to decrease.
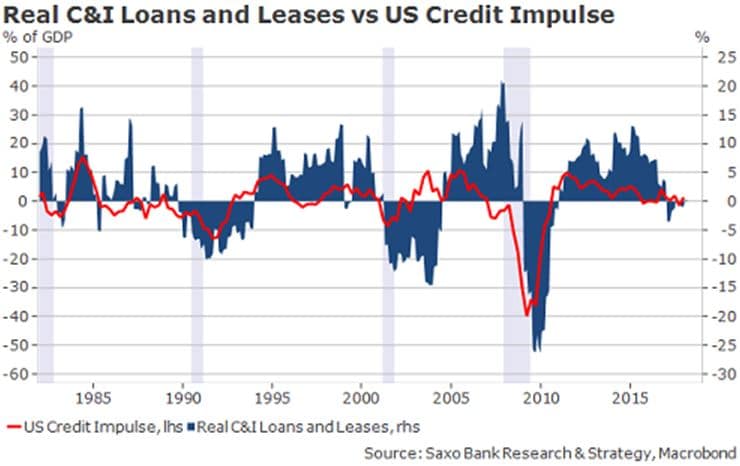
The next graph is one of our favorite “scary charts” concerning growth outlook. In a highly-leveraged economy like the US, credit is a crucial driver of growth. As a result of monetary policy normalisation, credit impulse and CPI-adjusted C&I loans are close to zero, which clearly points to lower growth to come.
Obviously, the situation is rather different than in the 1970s when stagflation occurred in the shadow of the oil crisis. Nowadays, the economy is more financialised and, though oil prices are going up, what really matters is liquidity and monetary policy.
Nonetheless, if the risk of stagflation materialises, the market effect will certainly be the same as in the 1970s: gold and silver could be the main winners.