
Access all our platforms from a single account.

Twenty-one names where option premium stood out after the 13 November close

Summary: UCB sat at the top of its own one-year option range at the 13 November close, while Arcadis sat at the floor. Twenty-one readings, and what a volatility number still cannot tell you.
A rank that fell fast says as much as one that sits high, and neither says where the stock is going.
A nightly collector built on the Saxo API records implied volatility, IV rank and IV percentile for a US set (S&P 100 plus 50 liquid ETFs) and a euro-zone set (every euro-denominated stock option root in Saxo’s catalogue). This edition covers the close of Friday 13 November 2026 (Source: Saxo platform, recorded 14 November 2026). Past performance is not indicative of future results.
Twenty-five days of history now exist, so the list includes how far ranks travelled over five sessions. Nothing here is a trade recommendation. Options carry a high risk of rapid loss and are not suitable for every investor.
Important note: The strategies and examples provided in this article are purely for educational purposes. They are intended to assist in shaping your thought process and should not be replicated or implemented without careful consideration. Every investor or trader must conduct their own due diligence and take into account their unique financial situation, risk tolerance, and investment objectives before making any decisions. Remember, investing in the stock market carries risk, and it’s crucial to make informed decisions.
Reading the numbers together
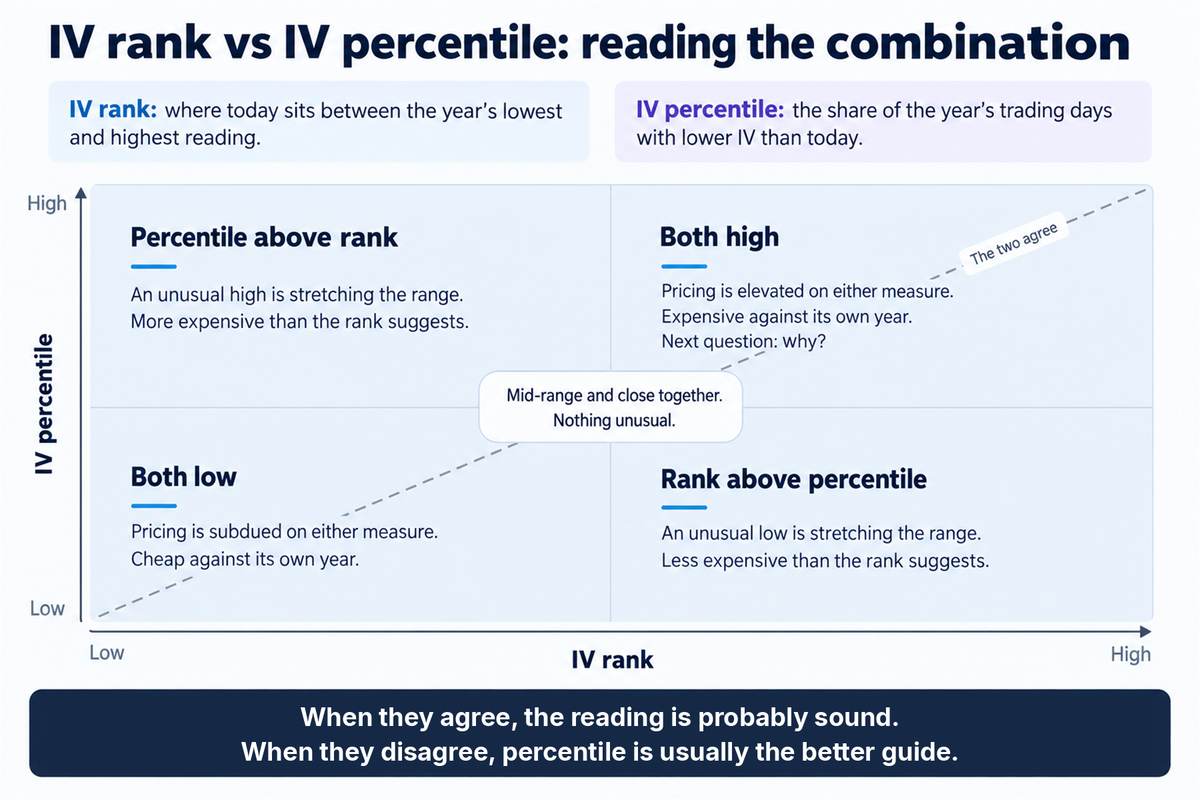
IV rank places today’s implied volatility between the lowest and highest reading of the past year. IV percentile counts the share of days that closed below today’s level. D5 is the rank change over five sessions. None of them says anything about direction.
All figures below: Source: Saxo platform, as of the 13 November 2026 close. Past performance is not indicative of future results.
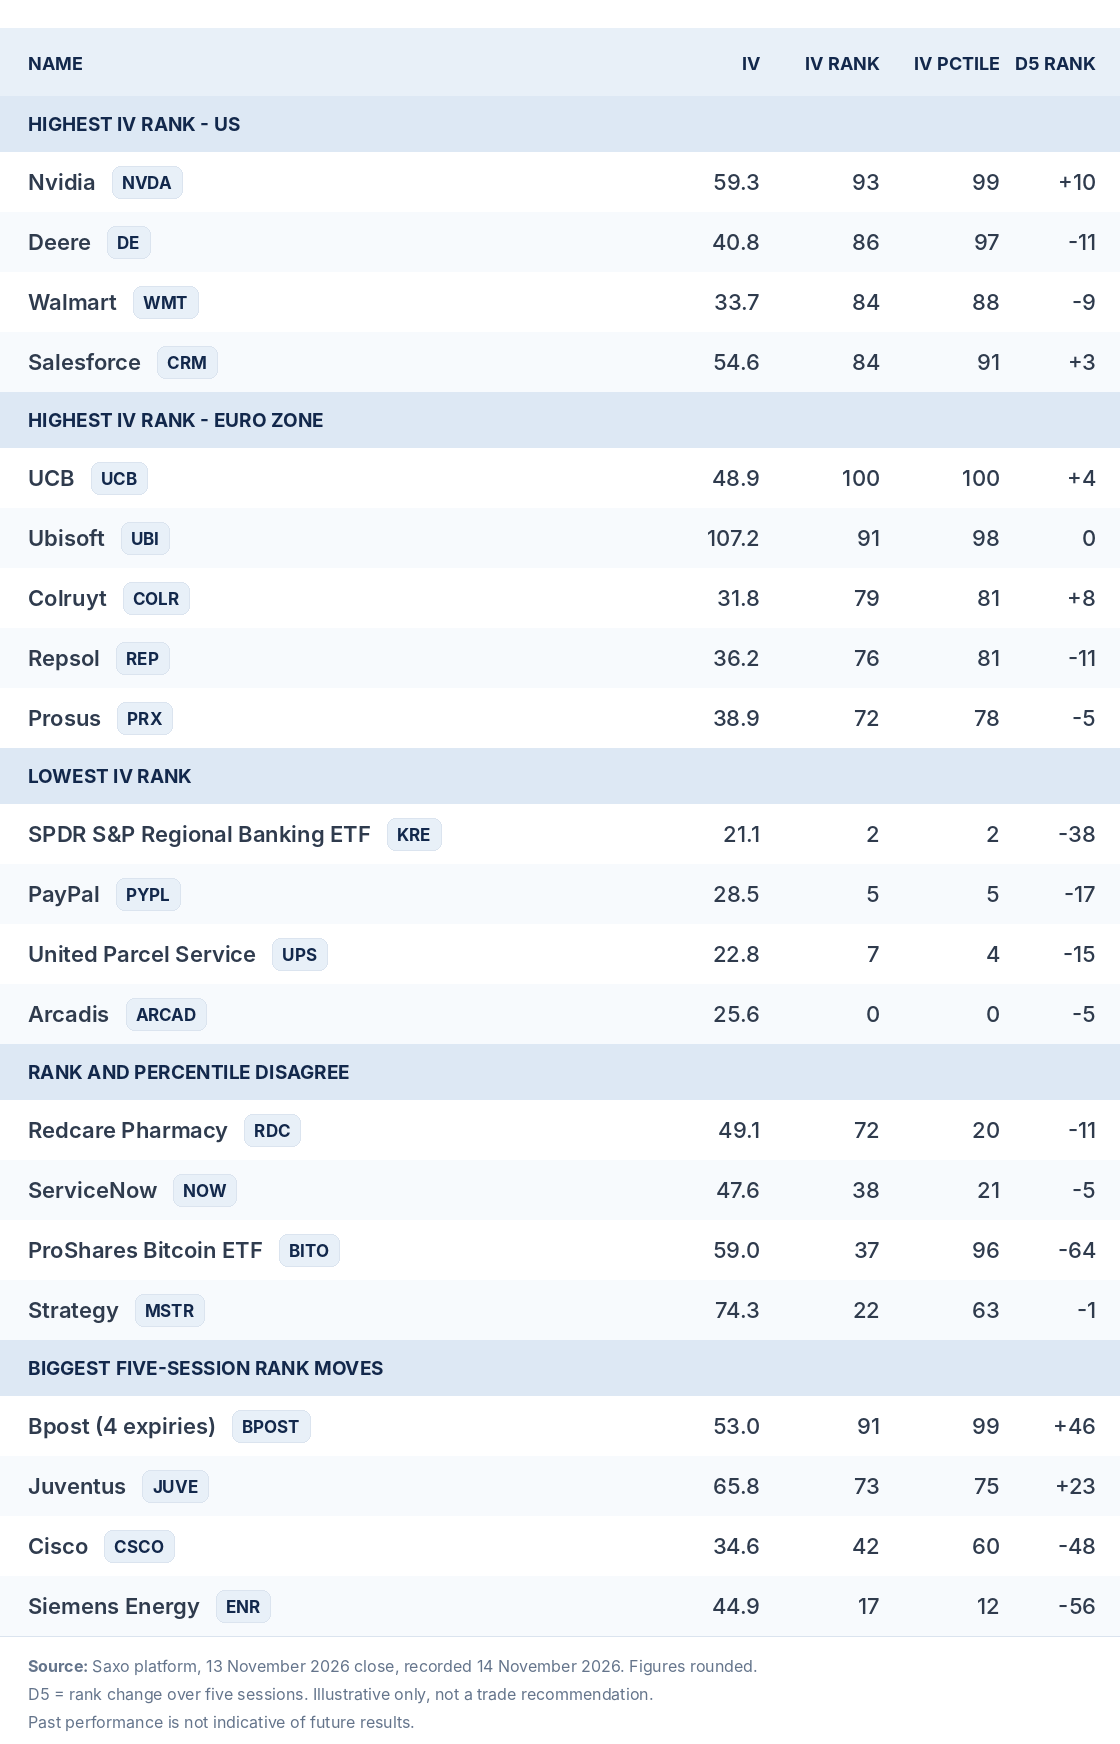 Implied volatility, IV rank, IV percentile and five-session rank change for twenty-one underlyings, 13 November 2026 close. Source: Saxo platform
This table is illustrative and for educational purposes only; it is not predictive and not a trade recommendation. Past performance is not indicative of future results.
Where implied volatility sat highest - US
Illustrative only, not trade recommendations. Options carry a high risk of rapid loss and are not suitable for every investor.
- Nvidia (NVDA) - IV 59.3, rank 93, percentile 99. Rank rose about ten points in five sessions. Its third-quarter results call is set for Tuesday 17 November (Source: company announcement).
- Deere (DE) - IV 40.8, rank 86, percentile 97. Rank is eleven points lower than a week earlier. The fourth-quarter earnings call is set for Wednesday 25 November (Source: company announcement).
- Walmart (WMT) - IV 33.7, rank 84, percentile 88. High on both measures. We have not verified its next results date, so check the company’s investor calendar.
- Salesforce (CRM) - IV 54.6, rank 84, percentile 91. Rank and percentile agree and the five-session change was small.
Where implied volatility sat highest - euro zone
Filtered to names with at least seven listed expiries and a rank already elevated two sessions earlier. Financiere de Tubize and ADP were left out for having six, and adjusted ex-event contracts because their front expiry sits in December.
Illustrative only, not trade recommendations. Options carry a high risk of rapid loss and are not suitable for every investor.
- UCB (UCB) - IV 48.9, rank 100, percentile 100. The top of its own one-year range on both measures, with seven expiries.
- Ubisoft (UBI) - IV 107.2, rank 91, percentile 98. One of the highest absolute levels in the screen; rank is relative to the name’s own history.
- Colruyt (COLR) - IV 31.8, rank 79, percentile 81. Rank was 83 two sessions earlier.
- Repsol (REP) - IV 36.2, rank 76, percentile 81. Ten listed expiries.
- Prosus (PRX) - IV 38.9, rank 72, percentile 78. Elevated on both measures, with nine expiries.
Where implied volatility sat lowest
A low reading is not an invitation to buy options. It may reflect an absence of scheduled catalysts, and implied volatility can stay low for long stretches.
Illustrative only, not trade recommendations. Options carry a high risk of rapid loss and are not suitable for every investor.
- SPDR S&P Regional Banking ETF (KRE) - IV 21.1, rank 2, percentile 2. Rank fell about 38 points in five sessions. Costs and charges apply; see Saxo pricing for full details.
- PayPal (PYPL) - IV 28.5, rank 5, percentile 5. D5 about minus 17.
- United Parcel Service (UPS) - IV 22.8, rank 7, percentile 4. D5 about minus 15.
- Arcadis (ARCAD) - IV 25.6, rank 0, percentile 0. One of several euro-zone names at the floor, with eight expiries.
When rank and percentile disagree
Illustrative only, not trade recommendations. Options carry a high risk of rapid loss and are not suitable for every investor.
- Redcare Pharmacy (RDC) - IV 49.1, rank 72, percentile 20. Rank well above percentile may indicate one spike set the top of the range while most days sat lower.
- ServiceNow (NOW) - IV 47.6, rank 38, percentile 21. Same pattern, smaller gap.
- ProShares Bitcoin ETF (BITO) - IV 59.0, rank 37, percentile 96. The mirror image: a mid-range rank on a range stretched by an earlier extreme, with the reading above about 96 days in 100. Costs and charges apply; see Saxo pricing for full details.
- Strategy (MSTR) - IV 74.3, rank 22, percentile 63. A very high level that still ranks low, which may reflect an old extreme rather than calm.
Which ranks moved most over five sessions
Illustrative only, not trade recommendations. Options carry a high risk of rapid loss and are not suitable for every investor.
- Bpost (BPOST) - IV 53.0, rank 91, percentile 99, D5 plus 46. The biggest rise in the euro-zone list, but only four listed expiries, so the level rests on a thin book.
- Juventus (JUVE) - IV 65.8, rank 73, percentile 75, D5 plus 23. Rank was 38 on the 12 November close, so nearly all of the move came on the final day.
- Cisco (CSCO) - IV 34.6, rank 42, percentile 60, D5 minus 48. Cisco reported after the close on Thursday 12 November (Source: company announcement), and rank fell from 80 to 42 the next session as the front expiry also rolled from 13 to 20 November.
- Siemens Energy (ENR) - IV 44.9, rank 17, percentile 12, D5 minus 56. Rank fell from 66 to 26 on 11 November, the day the company published its fiscal 2026 earnings release (Source: company announcement).
What this screen does not tell you
Four limits apply.
- It says nothing about direction. A high IV rank is consistent with the market pricing a large move up, a large move down, or simply an uncertain one.
- It has a short memory. Twenty-five days is enough for a five-session change, not a trend, and a contract roll can explain part of a move, as with Cisco.
- It does not measure liquidity. Bid-offer width, open interest and the number of listed expiries decide whether any of this is tradeable.
- It is not always like for like: one headline implied volatility per underlying, from whichever expiry is nearest.
Final thoughts
A screen like this separates two questions traders routinely collapse into one: how much a market is moving, and how much movement is already in the price.
A high rank says optionality is expensive against the past year, and expensive things can become more expensive. A collapsed rank says an event may have passed, not that the stock has become safe. In our view the screen is best used to decide which names deserve a closer look at the chain, where bid-offer spread, open interest and the catalyst calendar do the real work.
Options carry a high risk of rapid loss and are not suitable for every investor. Future outcomes are uncertain and may result in losses. See Saxo pricing for costs and applicable charges: https://www.home.saxo/rates-and-conditions/pricing-overview
The author does not hold positions in any of the instruments mentioned in this article.
The Author is permitted to wait at least 24 hours from the time of the publication before they trade the instruments themselves.
| Related articles/content |
|---|
| Is it the company or its sector Option premium moved in packs last week | 2 Nov 2026 Twenty-one options markets where premium stood out on 23 October | 26 Oct 2026 Twenty-one names where option premium stood out after the October expiry | 19 Oct 2026 Finding unusually expensive or cheap options in the Saxo screener | 18 Sep 2026 Implied volatility rank what it measures and what it misses | 11 Sep 2026 What IV crush really means in practice reviewed version | 9 Apr 2026 Trading earnings with defined | 31 Mar 2026 |
| More from the author |
|---|