
Access all our platforms from a single account.

One-day protection jumps as the index slips - Options Brief - 13 November 2026

Summary: The S&P 500 barely moved on Thursday, yet the price of one day of protection jumped by a quarter. Producer prices land at 14:30 CET. Was the market paying for a number, or for something longer?
The S&P 500 slipped only a little, but what one day of protection costs jumped by about a quarter ahead of today’s US producer prices.
MARKET REGIME: NEUTRAL / CHOP | VIX 18.70 | TERM STRUCTURE: CONTANGO | SKEW: ELEVATED (150.16) | FRONT-MONTH VIX FUTURES: 18.950
Today in brief
Thursday’s tension sat at the very front of the volatility curve. The S&P 500 fell only 0.35% to 7,592.40, yet the one-day volatility gauge, which measures what options charge for protection over the next session, jumped 26.50% to 15.99. Further out the moves shrank step by step: the VIX, the 30-day gauge, rose 6.92% to 18.70 and the one-year gauge only 1.71%. In our view that pattern may suggest traders paid up for cover around one event rather than for a lasting change in risk: October producer prices at 14:30 CET, alongside five Fed speakers.
The price of today’s expiry moved the same way. It now prices a move of about 0.73% for the S&P 500, against the 0.82% the same expiry carried at Wednesday’s close for two sessions. The clock alone would have cut that to about 0.58%, so in our view implied volatility itself may have risen for today.
The pain was uneven beneath a small index move. Nvidia fell 4.34% after its chief executive’s departure while AMD and Broadcom gained more than 5%, the equal-weighted S&P 500 fell 0.88% and small caps 1.64%. Nvidia’s volatility rank rose to 93.3, and its options price a report-day move of about 7.7% for 17 November, roughly 1.9 times its average after its last eight reports.
Backdrop: the S&P 500 has used 122% of the week’s priced range, the gold fund 177% to the downside, and the Treasury volatility gauge rose 6.47% as yields climbed. The flow showed no readable direction.
That is the whole brief in one read. The sections below hold the detail behind each paragraph, with the charts, the full set of readings and the sources, for when you want to go deeper on one part.
Headline driver
US stocks fell on Thursday as Nvidia’s leadership crisis deepened, according to the Saxo Market Quick Take. Nvidia dropped 4.3% after chief executive Jensen Huang’s departure, while AMD rose 5.9% and Broadcom 5.5% as investors reassessed the market for artificial intelligence chips.
Rates added pressure. Fed officials repeated a hawkish message after a third consecutive above-consensus inflation reading, and the Quick Take says markets now price one full rate hike for December. The two-year Treasury yield rose about 14 basis points to 4.88% and the ten-year almost 13 basis points to near 5.12%, after the weakest 30-year auction since the summer. US futures pointed higher this morning.
Market snapshot
- US (Thursday 12 November close): S&P 500 7,592.40, down 0.35%. Nasdaq 100 28,289.19, down 0.30%. The Dow fell 0.36% to 52,302.24 and the equal-weighted S&P 500 0.88%. Small caps fell 1.64%, the semiconductor fund 1.03% and Nvidia 4.34% to 166.19, while Alphabet rose 1.79% and Tesla 1.69%.
- Europe (Thursday close): the Stoxx 600 rose about 0.1% for a fourth straight gain after touching a record, and the DAX 0.41% to 26,771.88. Burberry jumped about 8% on better-than-expected results.
- Asia (Friday, 05:00 CET): the Hang Seng was down 0.92%, the Hang Seng Tech index 1.75% and the Kospi 0.71%.
- Commodities and rates: Brent traded at 95.50 and WTI at 88.22. Gold futures traded at 3,924.3 after a 13-month low near 3,852 on Thursday, and the gold fund closed down 2.82%. The ten-year Treasury yield sat near 5.12% and the dollar near 159.89 yen.
- Market regime: neutral, with the VIX at 18.70, the curve in contango and SKEW at 150.16, on its 60-session median.
Index levels and volatility readings from the watchlist export taken at 05:00 CET on 13 November 2026, which carries Thursday’s US and European closes and early Asian trading; the Stoxx 600 move, Burberry, the gold low, Treasury yield changes and policy context from the same-morning Saxo Market Quick Take. Past performance is not indicative of future results. Source: Saxo, Bloomberg, CBOE.
Volatility surface
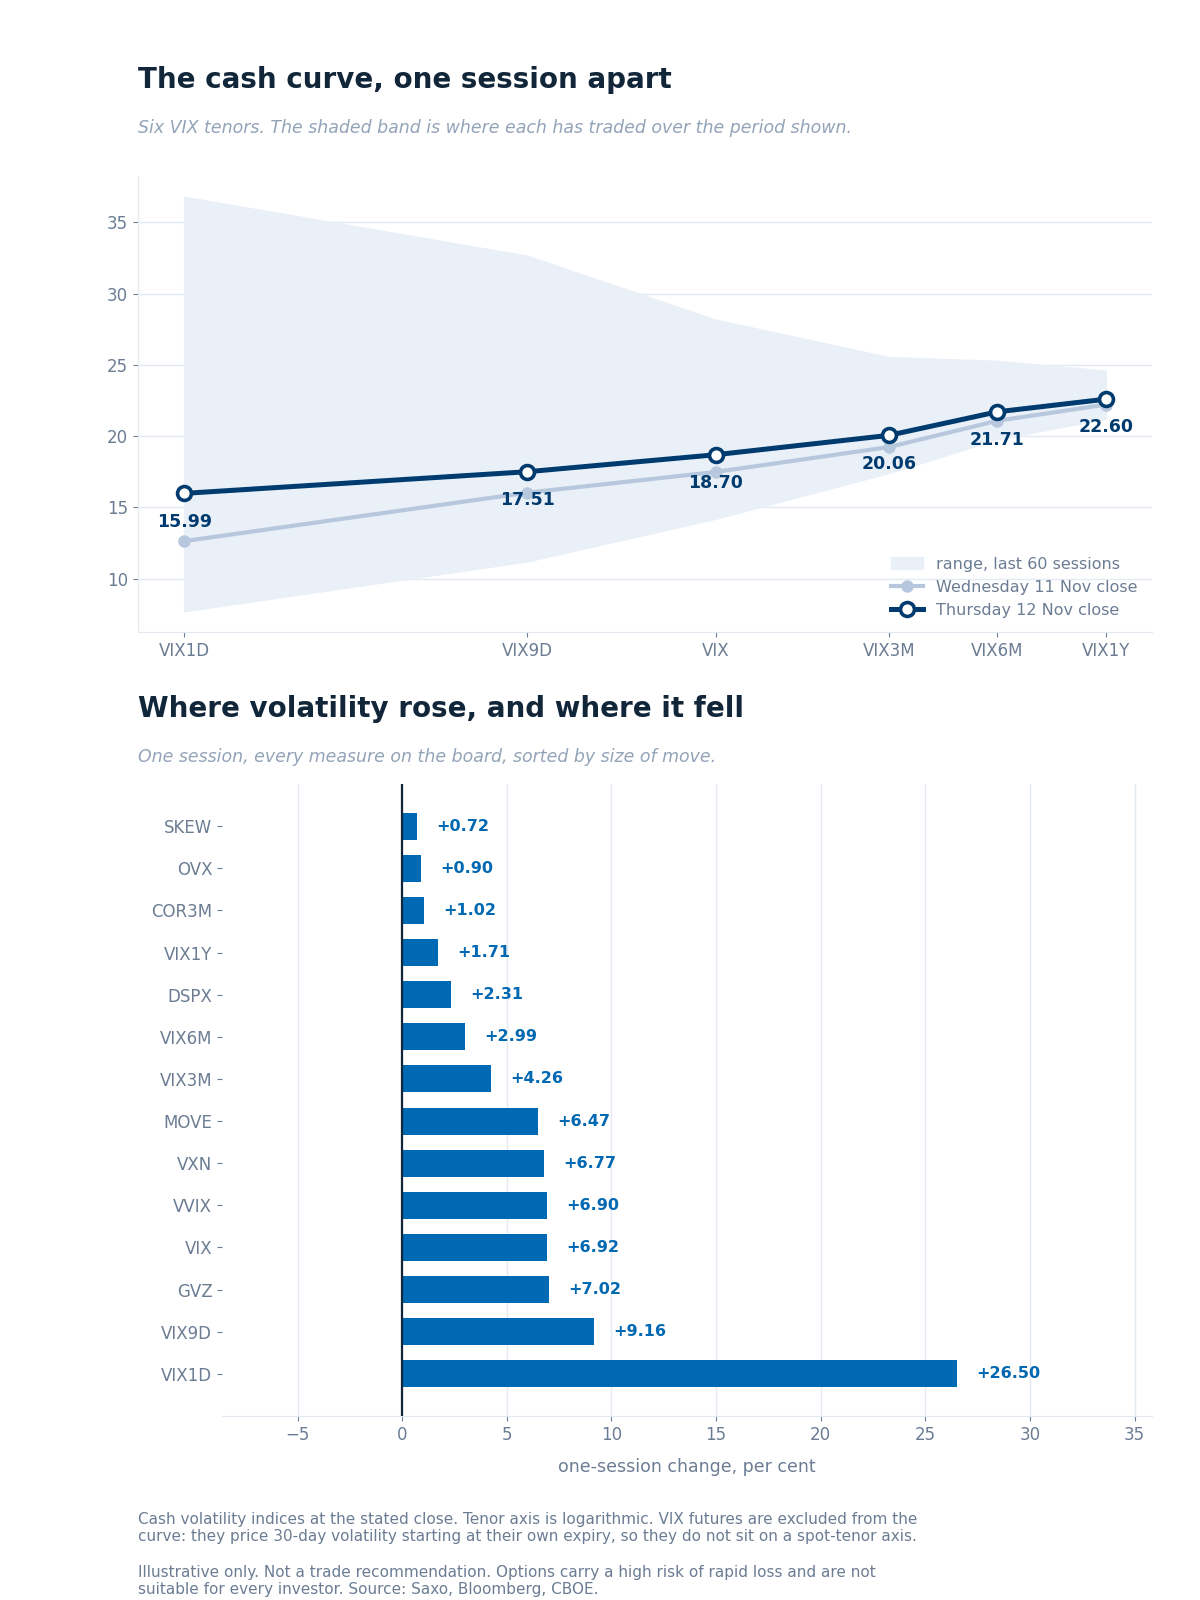
The cash curve at Thursday’s close against Wednesday’s, over each tenor’s 60-session range, with the one-session change across every measure. Illustrative only. Past performance is not indicative of future results. Source: Saxo, Bloomberg, CBOE.
Every gauge on the chart rose, and the shorter the tenor, the larger the rise. The one-day gauge gained 26.50% to 15.99, the nine-day 9.16% to 17.51 and the VIX 6.92% to 18.70, while the six-month rose 2.99% and the one-year 1.71%. MOVE, the Treasury volatility gauge, rose 6.47% to 98.42. VIX futures stay off the chart, since each prices a month from its own expiry.
Ratios. VIX3M/VIX fell to 1.07 from 1.10, a flatter curve at the front. VXN/VIX held at 1.53, with Nasdaq volatility at 28.55, close to 10 points above the broad gauge.
VIX futures. November trades at 18.95 and December at 19.68. A parity check on the 18 November options, quoted from Thursday’s close, reads 18.68, in line with spot at 18.70; the feed’s 18.95 includes overnight trading, so we draw no session comparison.
Tails and correlation. SKEW rose 0.72% to 150.16, at its 60-session median of 150.08 and above its longer median of 146.00 in our store. Implied correlation rose 1.02% to 11.88 and the dispersion index 2.31% to 39.02.
Single-name volatility
Across the board, single-name volatility hardly moved, but the two regions split. On a common set of 522 underlyings the median implied-volatility rank eased to 31.3 from 31.6, with 229 names up and 289 down, and 14 names still at a rank of 80 or more. The US median rose to 39.1 from 36.8 while the euro-zone median fell to 25.4 from 28.3.
The index measures above rose, and so did the US index funds. The S&P 500 fund’s rank rose to 25.5 from 20.6, the Nasdaq 100 fund to 56.4 from 50.0 and the small-cap fund to 18.0 from 13.6. Chipmakers led the single names: Nvidia rose to 93.3 from 77.0, at the 98.8th percentile, Broadcom to 74.2 from 63.2 and AMD to 49.1 from 42.5. Tesla jumped to 46.9 from 28.5 and Alphabet to 42.8 from 31.7. The long-dated Treasury fund rose to 51.8 from 45.3.
Implied-volatility rank from the Saxo screener, read at about 03:00 CET on 13 November 2026, carrying Thursday’s close, against the reading carrying Wednesday’s close. Source: Saxo.
Options flow sentiment
Based on end-of-day Thursday 12 November, yesterday’s positioning, not today’s price action.
- Single-name flow centred on Nvidia, but its larger positions carried no clear buyer or seller, and in our view most put volume elsewhere looked like position transfer rather than protection.
- Sector and ETF flow showed no readable direction and little bought index protection.
Where the week's range sits
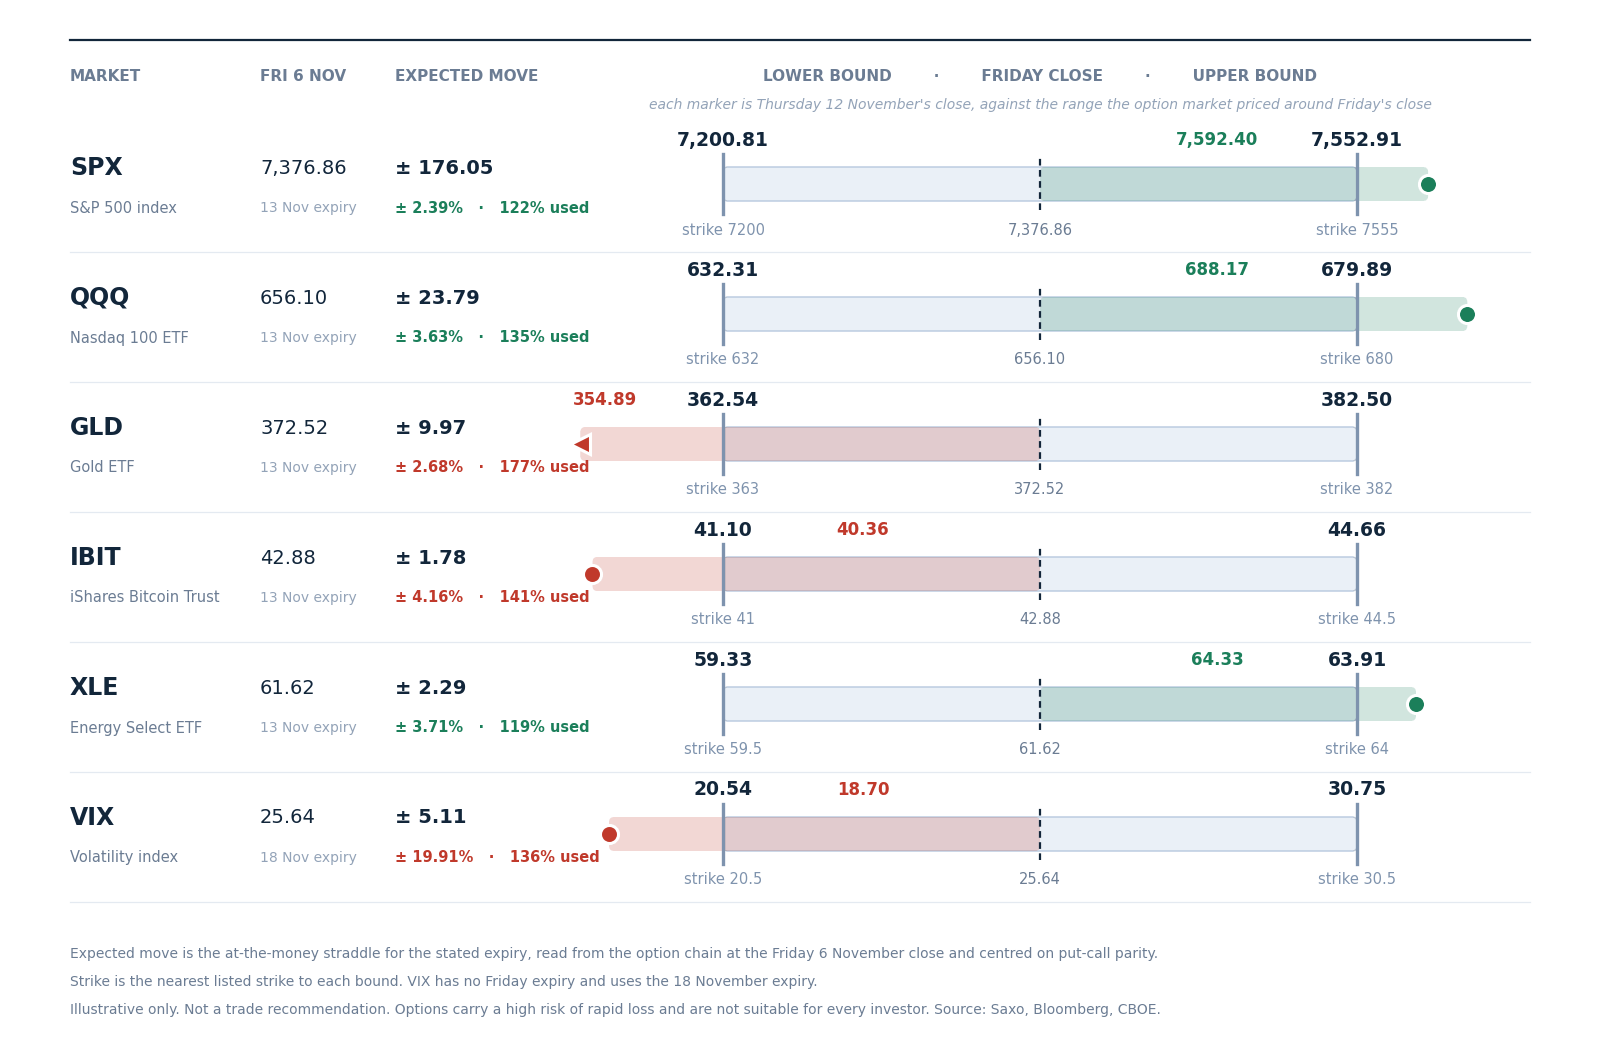
The range the option market priced for this week around Friday 6 November’s close, with each marker at Thursday 12 November’s close. Illustrative only, not a trade recommendation. Past performance is not indicative of future results. Source: Saxo, Bloomberg, CBOE.
The S&P 500 started the week with 176.05 points, about 2.39%, priced around Friday’s 7,376.86 close, from 7,200.81 to 7,552.91. Thursday’s close at 7,592.40 still sits above the upper bound, so the index has used 122% of its range, down from 138% after Wednesday. The Nasdaq 100 fund has used 135% and the energy fund 119%, both to the upside.
The gold fund moved furthest. At 354.89 it closed below its 362.54 lower bound, having used 177% of its range to the downside, up from 74% a session earlier. The bitcoin fund has used 141% to the downside and the VIX, at 18.70 against a 20.54 lower bound, 136%.
Options carry a high risk of rapid loss and are not suitable for every investor. Costs and charges apply and vary by account and venue; check the rates applicable to you.
Today's catalysts
- Today: 10:00 CET the IEA monthly oil market report; 11:00 CET euro-zone third-quarter growth, second reading; 14:30 CET US October producer prices; Fed speakers from 14:30 CET, Goolsbee, Collins, Logan, Bowman and Daly, with Logan and Bowman voters.
- Next week: Nvidia, Home Depot and Disney report on Tuesday; Palo Alto Networks, TJX, Lowe’s and Target on Wednesday; Walmart and Intuit on Thursday.
Earnings scorecard
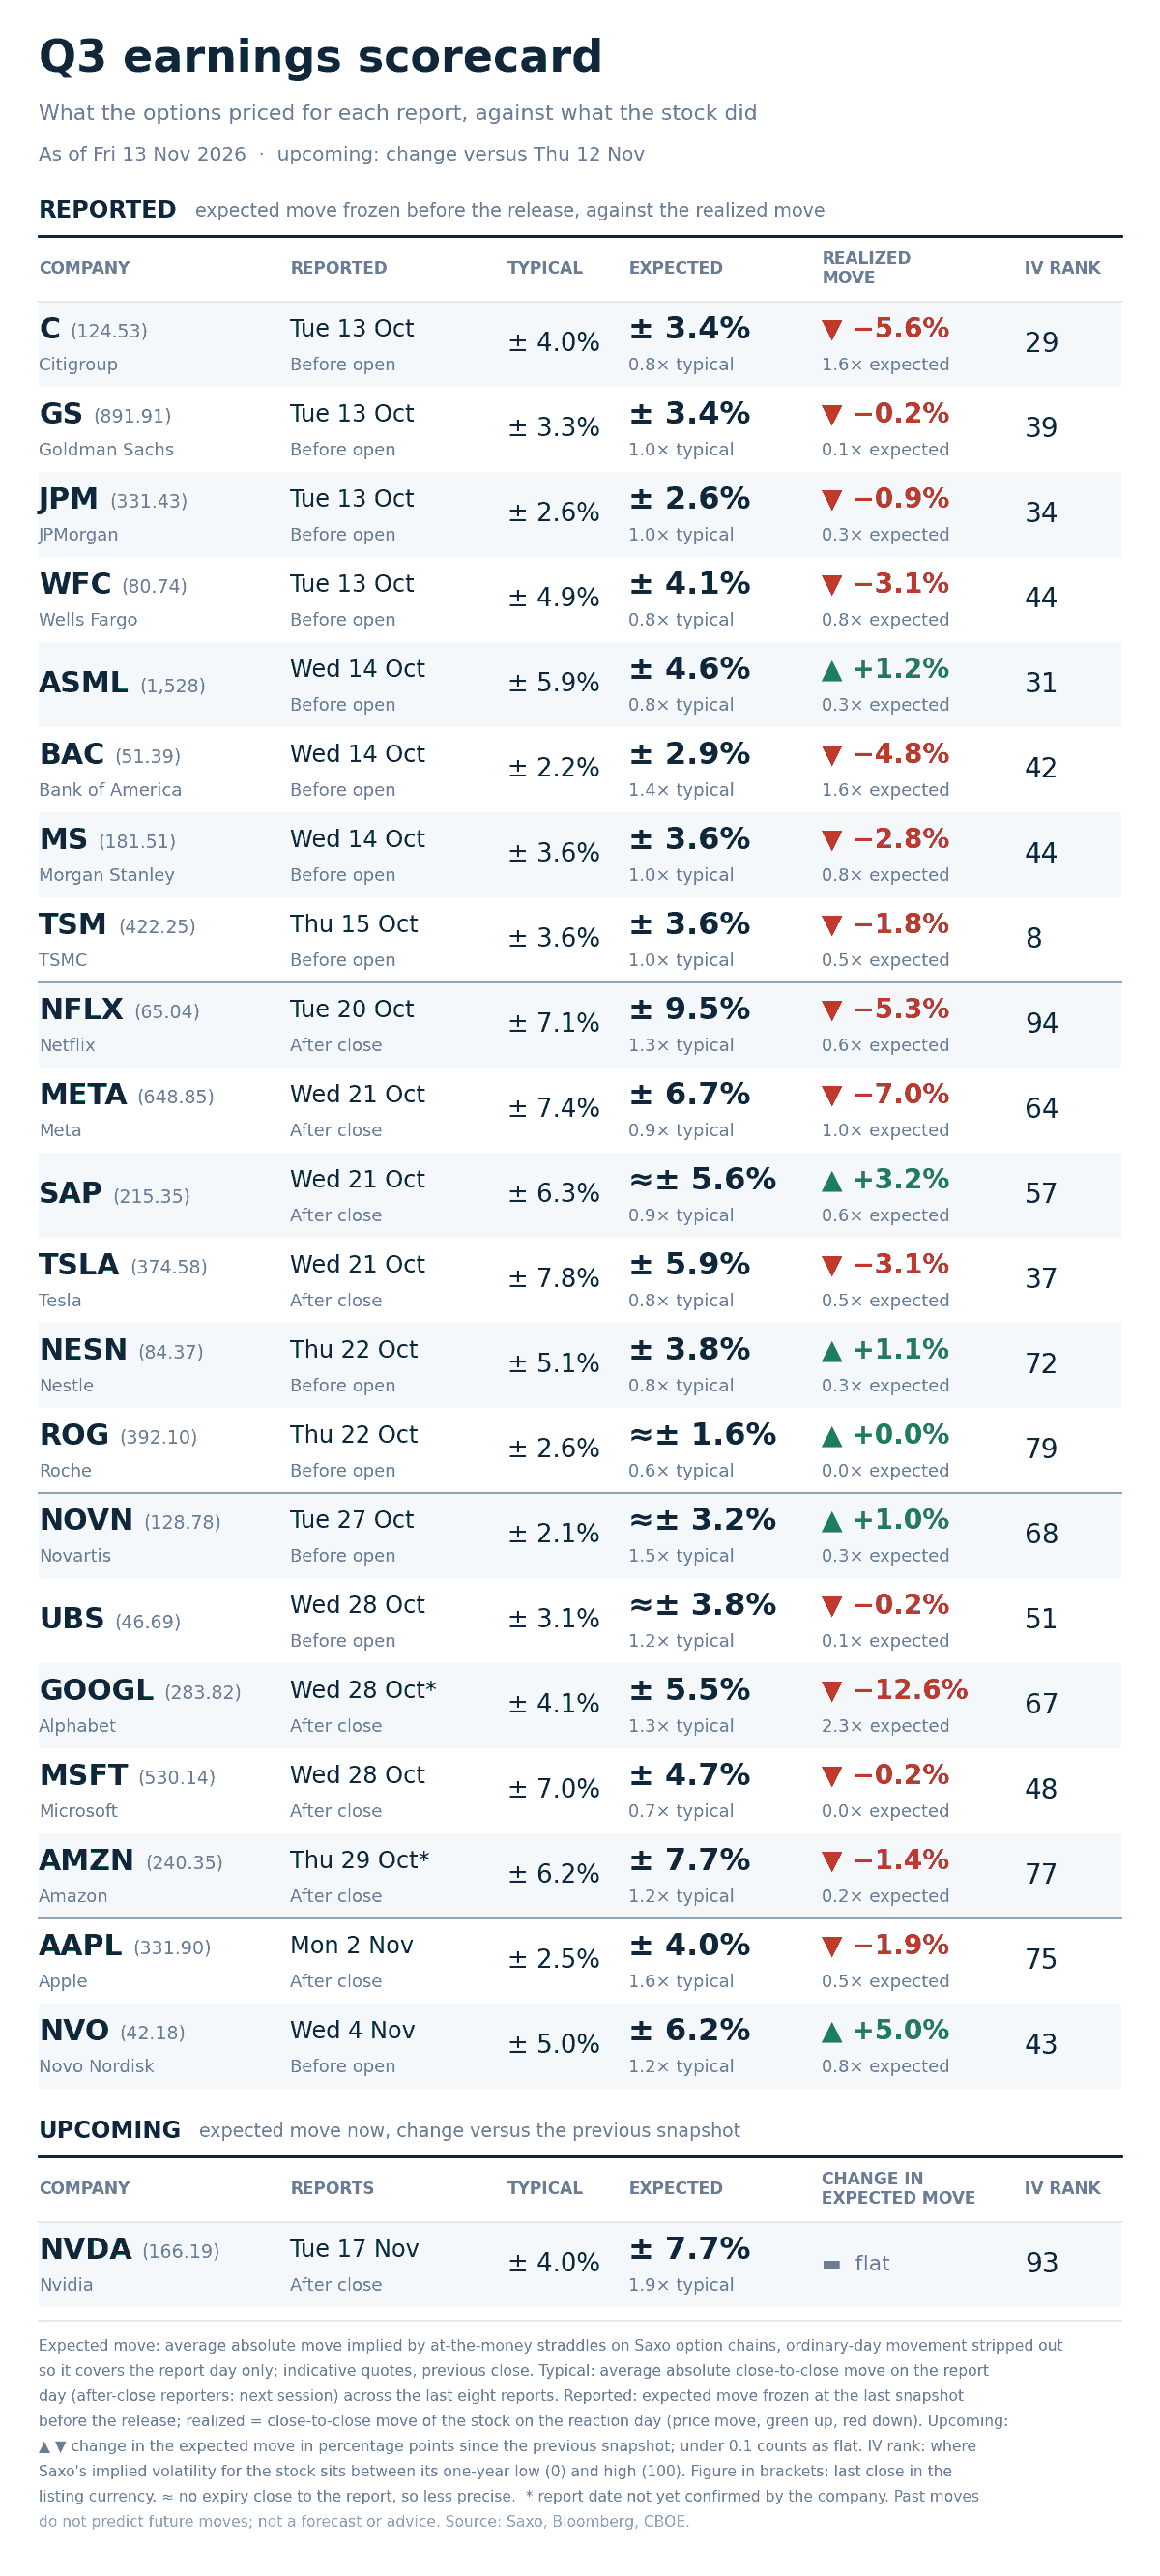
Option-implied expected move for each report day against the stock’s average move after its last eight reports, across the twenty-two names tracked this season. Past performance is not indicative of future results. Source: Saxo, Bloomberg, CBOE.
Nvidia remains the one upcoming name. At Thursday’s close its options priced a report-day move of about 7.7% for 17 November, 1.9 times the 4.0% it has moved on average after its last eight reports, against 7.8% a session earlier. Its last four report-day moves were 3.1%, 5.5% and 1.8% lower and 8.7% higher.
Its implied-volatility rank stands at 93. In our view the contrast may matter: the rank says Nvidia’s options are expensive against their own year, while the report-day figure barely changed after a 4.34% fall on the leadership news, which may suggest the extra premium went into the days around the report rather than into the report itself.
The other twenty-one names have reported and their board is unchanged.
Options carry a high risk of rapid loss and are not suitable for every investor. Costs and charges apply and vary by account and venue; check the rates applicable to you. Past performance is not indicative of future results.
What the market is pricing
- Session implied range: S&P 500 options price about 55 points, 0.73%, for today’s expiry, from indicative quotes read before the US open. The one-day gauge at 15.99 implies about 1.01%, a one-standard-deviation figure, a different measure from the expected move.
- Clock against price: Wednesday’s edition quoted 62 points, 0.82%, for the same expiry from the same chain at Wednesday’s close, with two sessions left. Time alone would have left about 44 points, 0.58%, so in our view the market may have added premium for today’s data.
- Week ahead: the 20 November expiry, which spans Nvidia’s report, prices about 137 points, 1.80%. Netting out today leaves about 1.65% for the five sessions after it.
- Correlation read: implied correlation and the dispersion index both rose while the index fell only 0.35%. In our view that may suggest the market is pricing stock-specific moves, led by chipmakers, more than one move for the whole index.
In our view the first test may be the producer price release at 14:30 CET, where Thursday’s one-day premium meets the actual number, with Fed voters speaking afterwards. Options carry a high risk of rapid loss and are not suitable for every investor. Costs and charges apply and vary by account and venue; check the rates applicable to you. Past performance is not indicative of future results.
| More from the author |
|---|