It all started on February 2 with a disturbingly high US wage growth print (2.9% year-on-year) and the publication of a higher-than-expected US CPI print for January (2.1% y/y). The markets saw short-lived panic caused by worries that an inflationary shock would push the Federal Reserve to tighten monetary policy faster than previously forecast.
To some extent, the fear of an inflationary shock was the perfect excuse at the right time for a market correction. As mentioned in previous analyses, according to most metrics – including the Warren Buffet and the Hussman indicators – the overvaluation of the US market is close to its 2000 level.
Nonetheless, the fear of an inflationary shock was not only an excuse, it reflected a belief expressed for several years by some investors that quantitative easing could end up in hyperinflation (this is what we commonly call the ketchup theory of inflation). As a consequence, the first weeks of February have seen investors starting to ask about strategies to protect their portfolios against rising inflation. They began to look into equities that have traditionally proven quite resilient, such as luxury and healthcare companies (as they are able to pass on higher inflation to their customers due to their dominant market position).
It is all nonsense! There is little doubt that the fears of an inflationary shock are greatly exaggerated. Inflation is going nowhere. It will remain quite low compared to the pre-crisis level.
Let’s take a close look at the US inflation data...
Core inflation was released at 1.8% y/y, at the same level as the previous month and much the same as the past year. Headline inflation was at 2.1%, only 0.1% over the target. Rationally, this small difference does not matter much. It is partially explained by stronger electronics, transportation, and medical care but also by the fact that CPI has been heavily impacted by higher oil prices.
As a gentle reminder, a sudden increase is nothing new. In early 2017, US inflation went up significantly due to base effects before vanishing for the rest of the year. So far, there has been no sign that the current increase can last over the coming months.
Inflation is one of the most complex data points to accurately forecast. That being said, major structural and cyclical forces driving inflation indicate that it won’t leave the ketchup bottle anytime soon.
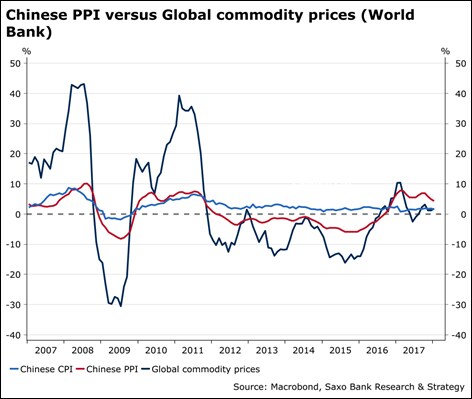
Commodity prices and China bring little support in short and medium terms Energy prices, and more broadly commodity prices, do not support the view of higher inflation as shown by the chart below. Our global commodity prices index, based on no less than 14 commodities, was up only 1.4% y/y last January versus 10.3% y/y in January 2017. China, which has been a key exporter of deflation from 2012 to mid-2016, is now exporting inflation but at a very slow rate. Over the past three months, PPI has been slowing down while CPI remains quite subdued.
 Wage growth is rising but the link between unemployment and inflation might be broken
We have recently seen a strong focus on higher wage rates in the US. The last data (+2.9% y/y) made investors break out in a collective cold sweat due to the strong and unexpected acceleration. This leads me to three thoughts...
First, after some digging, it appears that the surge partially reflects a reduction in hours worked due to bad weather.
Second, thought a large number of firms plan to raise wages in the next three months (according to the last NFIB survey), ongoing wage growth is still lower than before the financial crisis in the United States, but also lower than in most developed countries (except Germany!). In most cases, this trend is explained by labour market slack. That said, the amount of labour reserves is much higher in the euro area than in the United States where it stands at 8.1% based on the U6-measure (which includes the official unemployment rate, discouraged workers and part-time workers for economic reasons).
Even if the level market slack were smaller, there is no indication that this would automatically trigger a jump in inflation. Several recent studies underline that the link between inflation and unemployment may be broken.
Among all these papers, a thoughtful analysis from the Bank of France points out that inflation in the G7 countries is holding stationary instead of unemployment, thus raising questions as to the pertinence of the Phillips curve. This time might be different, at least in terms of inflation dynamics.
Another study published by the Chicago Booth School of Business reaches the same conclusion for the US.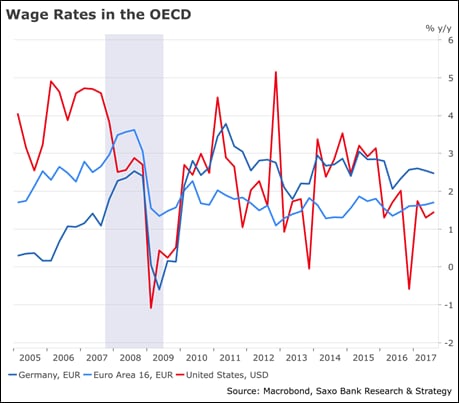
Third, based on historical analysis, wage growth plays a driver role in higher inflation only when it exceeds 4% in nominal terms, such as between 2003 and the financial crisis. Over this period, it has helped the Federal Reserve to deliver on the inflation target. At the current speed and, even if the most optimistic forecasts that expect a wage increase of around 3.5% this year come true, it is unlikely to cause inflation to overshoot.
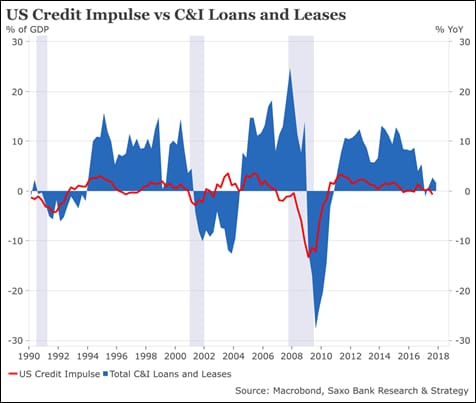
Net lending demand is weak
Getting back to basics, inflation is above all a result of the velocity of money which is dependent on net lending demand. Below, I have included a graph that explains why inflation is doomed to stay low compared to previous periods in the US. The US credit impulse, which is built using the flow of new loans from the domestic non-financial sectors, as well as commercial and industrial loans and leases (which give a broader view on credit in the US), are both very weak.
On top of that, other long-term structural factors limit the rise in inflation: the accumulation of debt, ageing, new technologies, and the development of new, low-cost business models. Over recent years, inflation has been limited in the goods and services market due to greater reliance on outsourcing and freelance workers, allowing companies to be less constrained by the rigidity of costs and wages.
These phenomena are likely to last and prevent any inflationary shock.
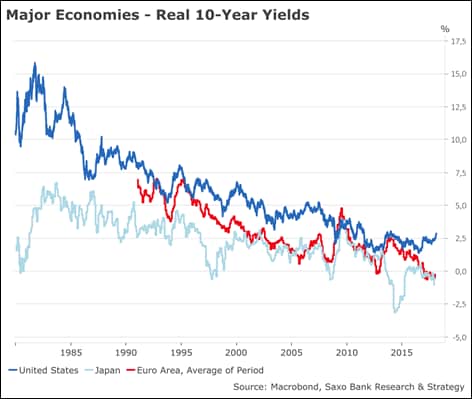
Real yields are still quite low
Many investors are worried about inflation because iwe learned from our textbooks that higher inflation means higher yields across the yield curve. However, what really matters is real yields. The chart below shows real 10-year bond yields for major economies. The key message to remember is that although they are rising, there is still a long way to go before they reach the Great Moderation norms.
The era of low interest rates is not over yet.
We have not entered into a new paradigm.
What are the main takeaways?
Investors should not get fixated on short runs of inflation data that are quite volatile and do not indicate that a new trend is emerging.
There is no inflation problem. US CPI increased because it is heavily impacted by oil prices but core CPI and CPE were aligned with expectations.
Despite the recent market turmoil, there is little consensus over the Fed’s overall capacity to deliver more than three hikes this year and it is clear that a couple of data points won’t change the central bank’s strategy.
Yes, inflation is slowly coming back. In the G7 countries, average CPI is at 1.7% but it is slightly lower than in February 2017 (1.8%). In BRICS + Indonesia, average CPI remains close to its lowest post-crisis point at 3.5%. Therefore, inflation is not a game changer for the market. It would be if US CPI enters into the risk zone between 3% and 4%. But this scenario is highly unlikely due to structural factors and weak inflation impulse limiting inflation pressure.
