
Un seul compte Saxo suffit pour accéder à nos plateformes.

Where the strikes go: a Meta earnings case study
Options 10 minutes to read

Résumé: Two traders sell the same iron condor into Meta's earnings and end up with completely different positions, because one chose 550 and 650 and the other chose 570 and 630. So who picked right, and how would you know?
Two traders can sell the same iron condor into the same event and end up with completely different positions, because one chose 550 and 650 and the other chose 570 and 630.
Ask a trader why they picked a strike and the answer is often some version of “it looked about right.” The expected move gets quoted, rounded to a convenient number, and a structure built around it. That works often enough to feel like a method.
Meta Platforms (META) reports second-quarter results after the US close on Wednesday 29 July 2026, at approximately 22:30 CET. The stock closed Monday at $593.50, down roughly 11% since its April print, when raised capital-expenditure guidance sent it 8.2% lower in a session (Source: Saxo and Bloomberg, as of 27 July 2026). The 31 July weekly is the first expiry containing the result.
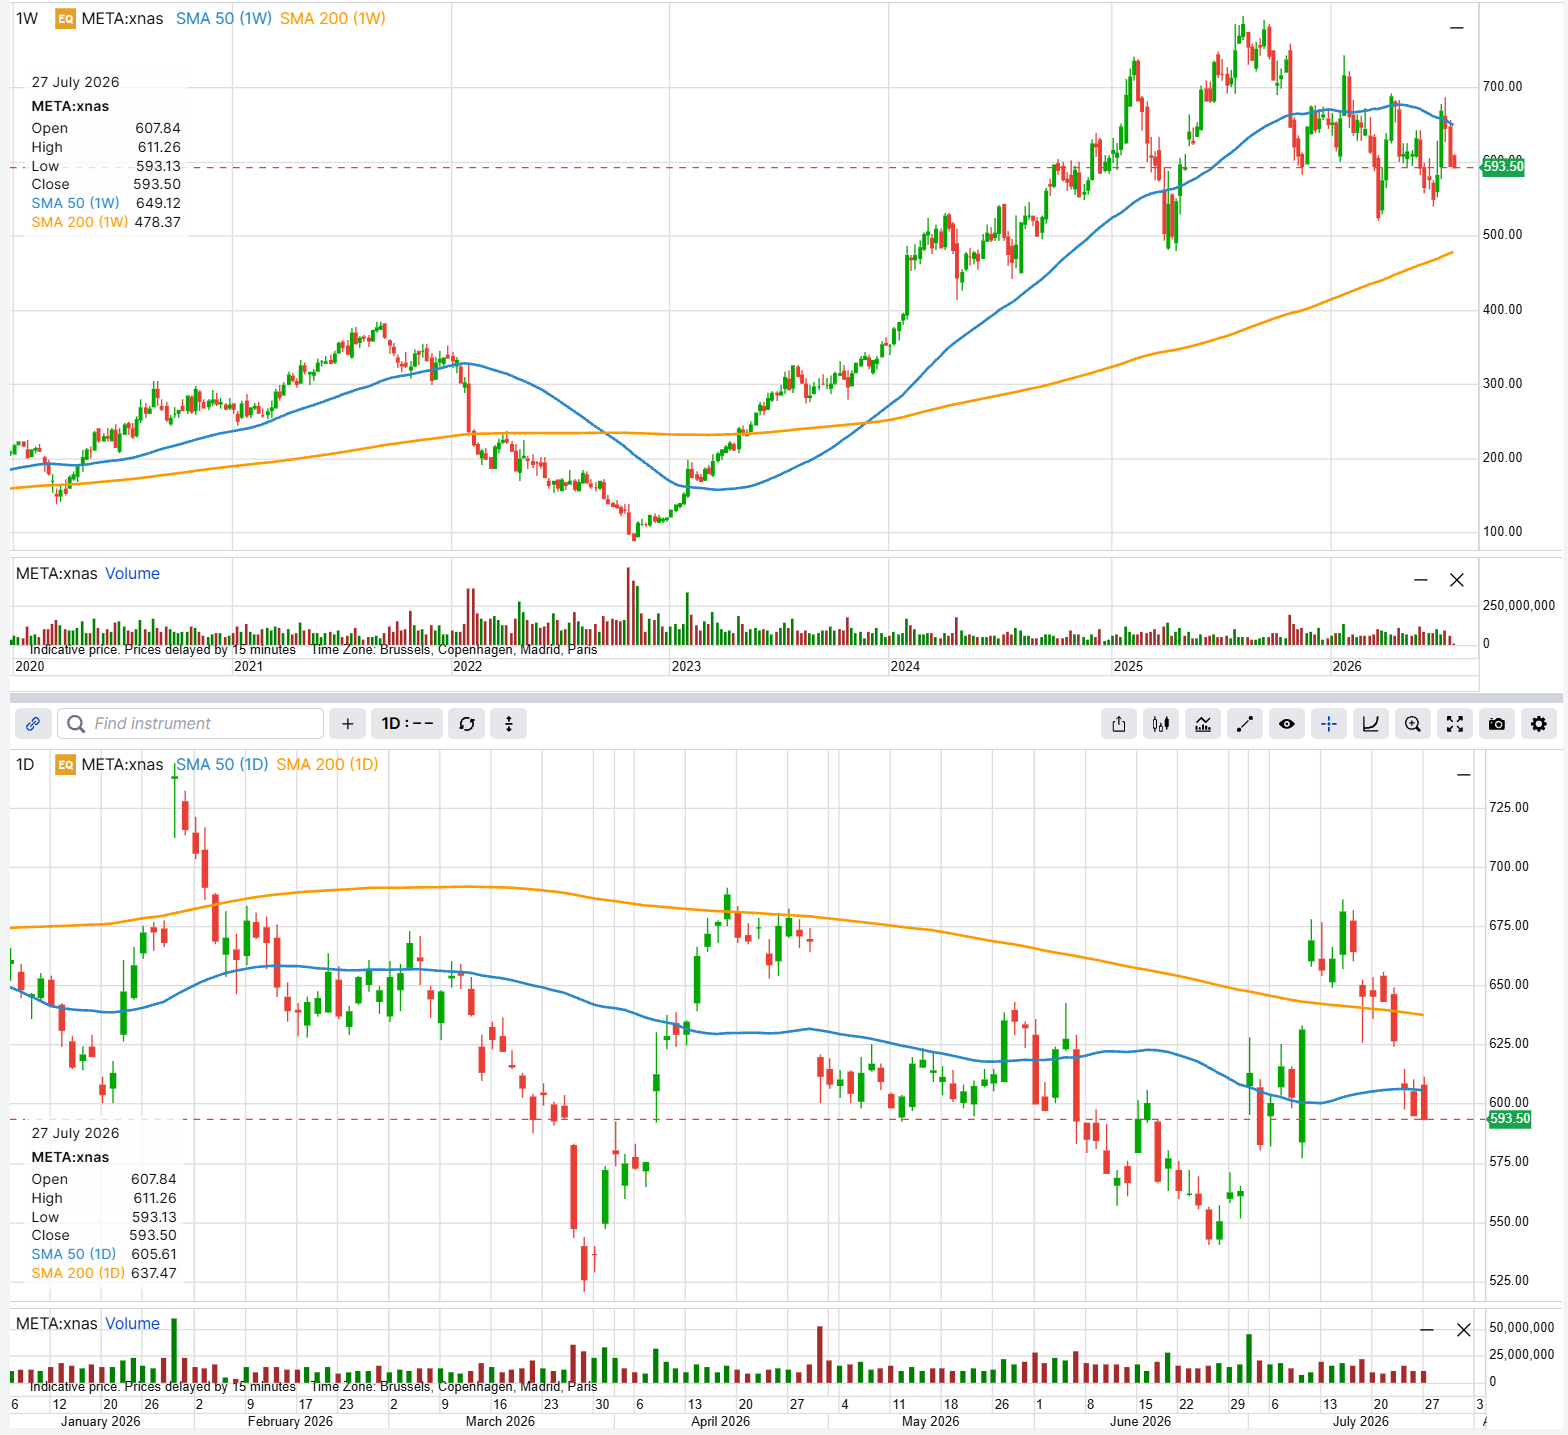 META enters earnings week below both daily moving averages, having faded from $607.84 to close near its low. Source: Saxo, as of 27 July 2026
Past performance is not indicative of future results; figures are illustrative and not predictive.
Three ways to find a level
Each lens answers the same question in a different language. The options chain prices the move: add the at-the-money call and put premiums in the expiry that captures the event, and the total is what buyers are paying for movement. The chart remembers it: moving averages mark levels where price has repeatedly stalled. Open interest records it, not as a forecast, but dealers short those contracts have hedging to do nearby, so quotes there tend to be deeper.
Run all three on the 31 July expiry and the edges land like this (Source: Saxo, as of the 27 July close):
- Implied move (straddle $49.00, or 8.3%): lower edge $545 · upper edge $643
- Moving averages: lower edge $545-550, June swing lows · upper edge $637 (200-day), $649 (weekly 50)
- Open interest: lower edge $550, 4,759 contracts · upper edge $655, 5,845 · $650, 4,182
- 16-delta strikes: lower edge $540 · upper edge $663
Compare the lower edges against one another, then the upper edges. Three of the four agree closely, falling inside five points on the downside and eighteen on the upside. A moving average is arithmetic on old closes and open interest reflects positions opened weeks ago, yet both land where today’s option pricing lands. That is what makes 550 and 650 defensible rather than convenient.
The fourth disagrees, and why is worth knowing. On Friday the 16-delta strikes sat at 550 and 652.50, right on top of the others. Implied volatility then rose about five points, and a delta band widens with volatility even when the stock barely moves: the 550 put that was a 16-delta option on Friday is a 22-delta option now, and the true 16-delta strikes have slid to roughly 540 and 663. In our view that may be the more useful signal of the four, because it dates the other three: averages and open interest describe what has happened, the delta band what is priced now.
The 50-day average at $605.61 is the one level inside the range rather than at an edge, 2.0% overhead. It matters later, as a candidate for a structure’s centre.
One more number sets up everything below. At-the-money implied volatility for 31 July was near 99%, against 53% for 21 August. That gap is earnings premium, and it collapses on Thursday morning whichever way the stock goes.
Important note: The strategies and examples provided in this article are purely for educational purposes. They are intended to assist in shaping your thought process and should not be replicated or implemented without careful consideration. Every investor or trader must conduct their own due diligence and take into account their unique financial situation, risk tolerance, and investment objectives before making any decisions. Remember, investing in the stock market carries risk, and it’s crucial to make informed decisions.
Bullish view: getting paid to define a floor
A trader who thinks the 550 shelf holds can sell that view rather than buy it. A put credit spread collects premium and caps the loss at the width minus the credit.
Example structure (illustrative only - not a trade recommendation)
- Sell 1 META 31 July 2026 $560 put at approximately $10.77
- Buy 1 META 31 July 2026 $545 put at approximately $6.90
- Net credit: approximately $3.87 ($387 per spread) = $10.77 collected on the short 560 put minus $6.90 paid for the long 545 put
- Maximum loss: approximately $1,113 if META settles at or below $545, against a maximum profit of approximately $387 if it settles at or above $560 (hypothetical, for education only)
- Break-even: approximately $556.13, about 6.3% below spot
The risk deserves stating first: a settle below $545 costs roughly three times the credit collected, and Meta gapped 8.2% on its last report. Against that, the position profits anywhere above $556.13, covering a fall of up to 6.3% as well as a flat tape. The long 545 put sits at the lower implied-move edge; the short 560 sits deliberately above the 550 confluence. Costs and charges apply to each leg; see Saxo pricing: https://www.home.saxo/rates-and-conditions/pricing-overview
Strategy insight - what you pay for cushion. Sliding the short strike down to 550 widens the cushion but cuts credit-to-risk from 35% to roughly 25%. Neither placement is correct; the choice turns on whether the premium compensates for the ground given up. Options carry a high risk of rapid loss and are not suitable for every investor.
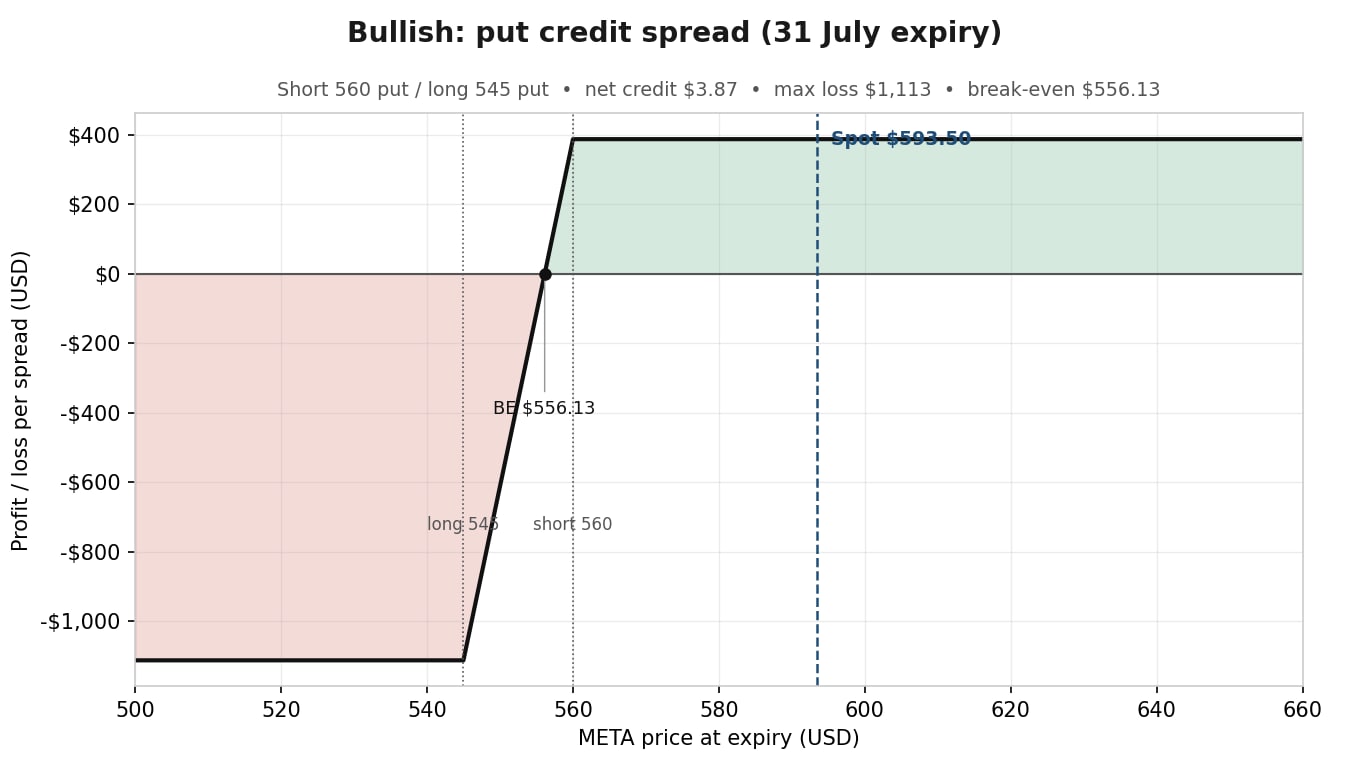 Put credit spread, 560/545, at the 31 July expiry. Illustrative only - not a trade recommendation, and not predictive. Source: Saxo
Past performance is not indicative of future results; figures are illustrative and not predictive.
Neutral view: how tightly do you sell the move?
A trader who thinks 8.3% is too generous still has a choice. The iron butterfly and the short iron condor both sell the move, and disagree completely about how much precision to demand for how much money.
Example structure (illustrative only - not a trade recommendation)
- Iron butterfly: sell 1 META 31 July 2026 $605 put at approximately $30.60 and 1 $605 call at approximately $19.52; buy 1 $555 put at approximately $9.45 and 1 $655 call at approximately $6.08
- Net credit: approximately $34.59 ($3,459) = $30.60 + $19.52 collected on the short 605 straddle, minus $9.45 + $6.08 paid for the wings
- Maximum loss: approximately $1,541 beyond either wing, against a maximum profit of approximately $3,459 only at exactly $605 (hypothetical, for education only)
- Break-evens: approximately $570.41 and $639.59
- Iron condor: sell 1 $550 put at approximately $8.07 and buy 1 $525 put at approximately $3.42; sell 1 $650 call at approximately $6.85 and buy 1 $675 call at approximately $3.60
- Net credit: approximately $7.90 ($790) = $4.65 from the put spread plus $3.25 from the call spread
- Maximum loss: approximately $1,710 beyond $525 or $675, against a maximum profit of approximately $790 anywhere between $550 and $650 (hypothetical, for education only)
- Break-evens: approximately $542.10 and $657.90
Both risk more than they collect, and a gap the size of April’s would breach either set of short strikes. What separates them is shape. The butterfly’s break-evens sit at -3.9% and +7.8%, inside the 8.3% the chain is pricing; the condor’s sit at -8.7% and +10.8%, outside it.
So the butterfly pays more than four times as much and needs Meta to do something the market rates as less likely than not, while the condor asks only that the stock stay inside a range already treated as probable. In our view neither appears obviously better priced; the choice could come down to whether the trader has a view on where Meta lands or only on how far it travels.
The butterfly body sits at $605, the 50-day average, rather than at spot. That makes it mildly bullish rather than neutral, which is why its break-evens are asymmetric. Costs and charges apply to each leg; see Saxo pricing: https://www.home.saxo/rates-and-conditions/pricing-overview Options carry a high risk of rapid loss and are not suitable for every investor.
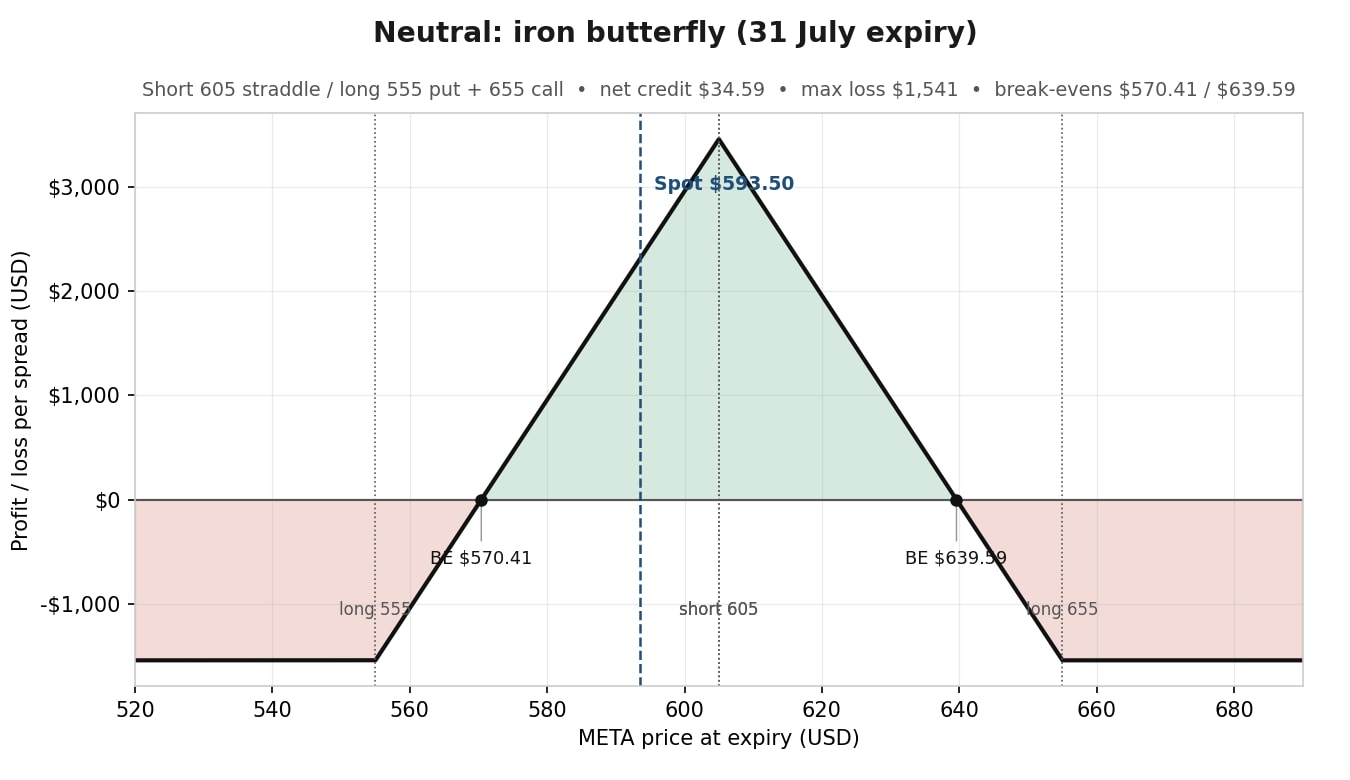 Iron butterfly, 555/605/655, at the 31 July expiry. Illustrative only - not a trade recommendation, and not predictive. Source: Saxo
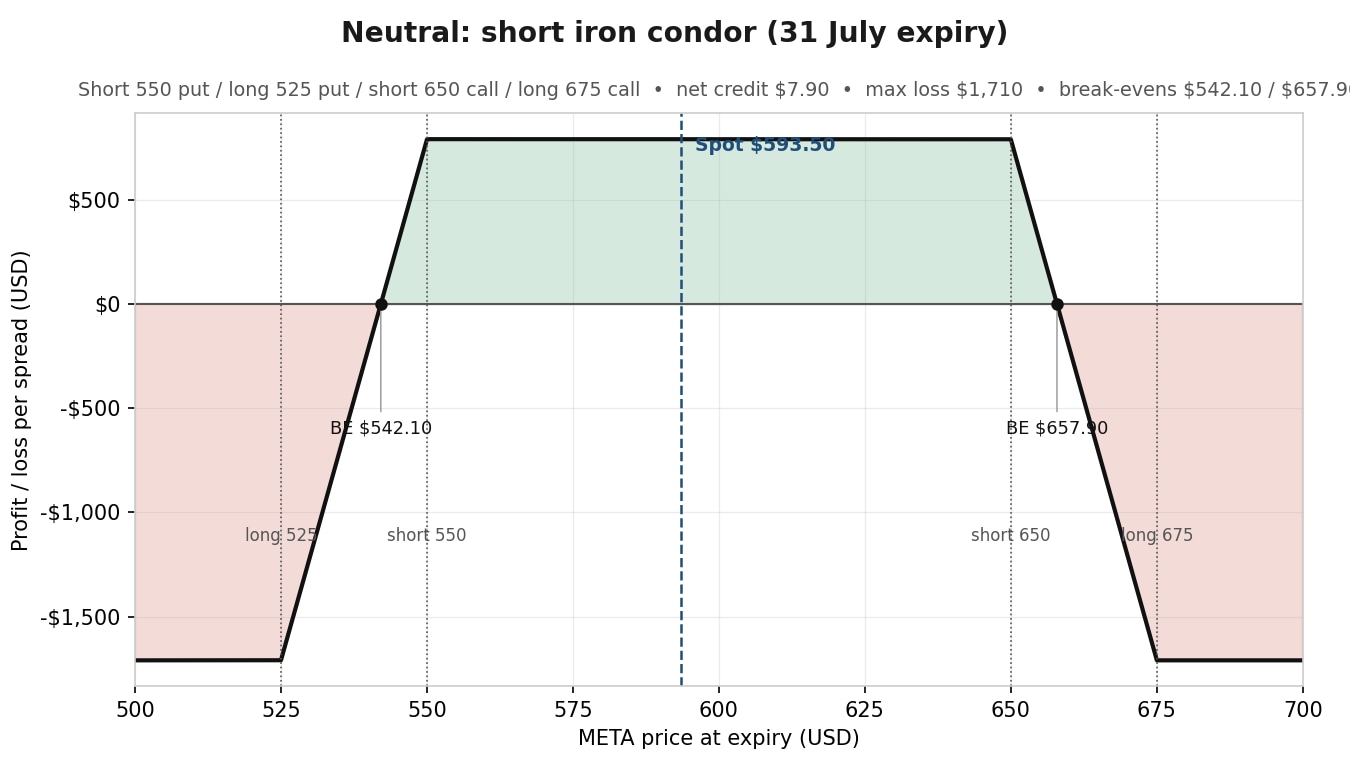 Short iron condor, 525/550 and 650/675, at the 31 July expiry. Note the wider profit zone and the smaller credit against the butterfly above. Illustrative only - not a trade recommendation, and not predictive. Source: Saxo
Past performance is not indicative of future results; figures are illustrative and not predictive.
Bearish view: selling the generous upside
The upside is where the chain prices most room: 50 points above spot against 48 below.
Example structure (illustrative only - not a trade recommendation)
- Sell 1 META 31 July 2026 $640 call at approximately $8.85
- Buy 1 META 31 July 2026 $655 call at approximately $6.08
- Net credit: approximately $2.77 ($277 per spread) = $8.85 collected on the short 640 call minus $6.08 paid for the long 655 call
- Maximum loss: approximately $1,223 if META settles at or above $655, against a maximum profit of approximately $277 if it settles at or below $640 (hypothetical, for education only)
- Break-even: approximately $642.77, about 8.3% above spot
The loss runs to more than four times the credit if Meta clears $655, and stronger advertising revenue with softer capital-expenditure guidance could produce it. Against that, the spread profits in every outcome below $642.77. The short 640 sits just above the 200-day at 637.47, the first level the stock would have to reclaim; the long 655 sits on the heaviest call line and above the weekly average. Costs and charges apply to each leg; see Saxo pricing: https://www.home.saxo/rates-and-conditions/pricing-overview Options carry a high risk of rapid loss and are not suitable for every investor.
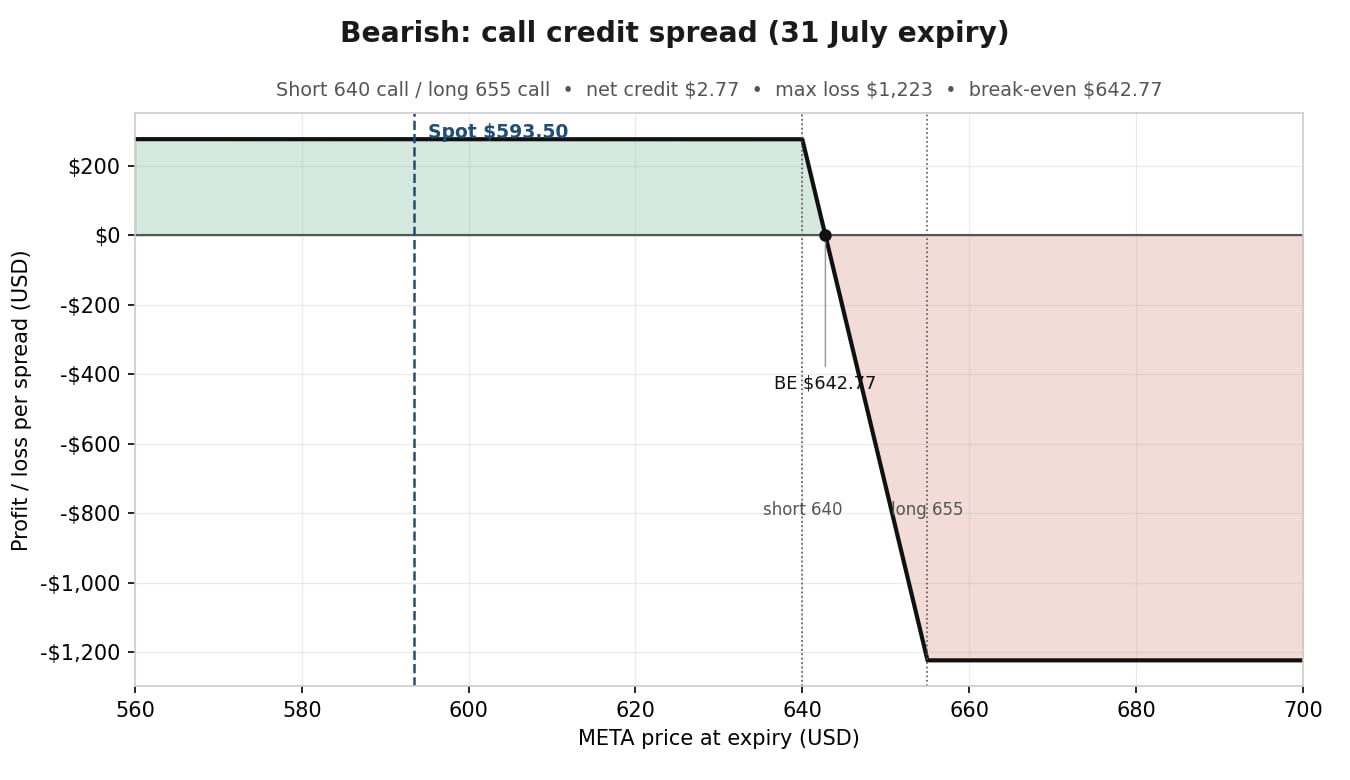 Call credit spread, 640/655, with the short strike above the 200-day moving average, at the 31 July expiry. Illustrative only - not a trade recommendation, and not predictive. Source: Saxo
Past performance is not indicative of future results; figures are illustrative and not predictive.
Before placing the trade, check:
- Bid/ask spreads, which on a four-day weekly can erase the theoretical edge
- Volume and open interest at the chosen strikes, not the expiry as a whole
- Implied volatility against what the stock has delivered on past reports
- An exit plan defined before entry, particularly for the four-leg structures
Assignment risk note: Because META options are American-style, short legs can be assigned before expiry if they move in the money. Traders should monitor short options and understand the assignment process before entering the trade.
Final thoughts
The three structures above are ordinary, and straightforward to set up in our platforms. The work was in the strikes. 550 and 650 are not round numbers that felt about right; they are where the implied move, the moving averages and the open interest converged.
The method transfers to any liquid name with a scheduled catalyst. Take the straddle for the range, the averages for the levels price remembers, the open interest for where contracts sit, the delta band for what is being priced now. When they agree, the strike has several reasons behind it. When one walks away, as the delta band did here, that is information too, and usually about the lens rather than the level.
Meta reports on Wednesday evening. By Thursday morning the 99% implied volatility in the 31 July expiry will be gone, whatever the stock has done.
This content is marketing material and should not be regarded as investment advice. Trading financial instruments carries risks and historic performance is not a guarantee of future results.
The Author is permitted to wait at least 24 hours from the time of the publication before they trade the instruments themselves.
The instrument(s) referenced in this content may be issued by a partner, from whom Saxo receives promotional fees, payment or retrocessions. While Saxo may receive compensation from these partnerships, all content is created with the aim of providing clients with valuable information and options.
This content will not be changed or subject to review after publication.
| Related articles/content |
|---|
| What IV crush really means in practice reviewed version | 9 April 2026 Trading earnings with defined | 31 Mar 2026 Amazon into earnings choosing a structure when the move is already priced | 28 July 2026 Hedging a portfolio near the highs four ways to buy insurance while it is cheap | 17 July 2026 Before Alphabet reports reading the expected move and structuring three views | 16 July 2026 How to trade an earnings event with options a Netflix case study | 15 July 2026 ASML how to position with options ahead of Q2 earnings | 13 July 2026 BABA three option strategies for three market views | 9 July 2026 Chips slide index shrugs - Options Brief - 27 July 2026 Options Brief - Twin shock tech tumbles - 24 July 2026 |
| More from the author |
|---|