
Un seul compte Saxo suffit pour accéder à nos plateformes.

Hedging a portfolio near the highs: four ways to buy insurance while it is cheap
Options 10 minutes to read

Résumé: An overnight tech-led selloff has nudged volatility up from subdued levels - a reminder, not yet a regime change - and index protection is still historically cheap. This article prices four ways to hedge a broad equity book off the SPX chain (a 16 July snapshot) - a protective put, a collar, a put-spread collar and a deep tail overlay - so the cost-versus-protection trade-off is visible in dollars.
A calm tape is when you build the shelter; an overnight wobble is the reminder – and even with volatility ticking up, index insurance is still not expensive.
This article was priced on 16 July 2026, when the S&P 500 sat around 7,560 – roughly 0.7% below its 2 June closing high of 7,620.90 – and the VIX was near 16, toward the lower end of its multi-year range (Source: exchange data, Cboe). Overnight into 17 July that calm broke: a tech-led selloff pushed the VIX up more than a point to about 16.73, with Nasdaq 100 futures down roughly 1.5% and weakness deepening across Asia (Source: exchange data, Cboe; index futures, as of early 17 July 2026). The move is a useful reminder rather than, in our view, a regime change – and it sharpens the point of this piece. Past performance is not indicative of future results.
That is worth pausing on, because most investors think about downside protection only after a shock – once implied volatility has spiked and puts have repriced two or three times higher. A one-point pop in the VIX to the mid-16s is a small version of exactly that mechanism; even so, a mid-16s VIX is still low by historical standards, so protection has become slightly dearer overnight but remains far from expensive. Buying insurance while it is still cheap and the need feels remote is, in our view, the more disciplined moment – even if it is the less instinctive one. Options carry a high risk of rapid loss and are not suitable for every investor.
This piece is not a call to hedge. For an investor holding a broadly diversified equity book, the useful question is whether the cost of protection is justified by their own risk tolerance and horizon, and if so, which structure fits. Below are four, each occupying a different point on the same trade-off surface.
Key takeaways
- Even after the overnight pop in volatility, a mid-16s VIX keeps index put protection cheap in absolute terms – the reason to consider it now rather than after the next leg.
- Every hedge trades away one of three things: cash (premium), upside (a cap), or completeness (a protection gap). You rarely give up none.
- The four structures below are priced off the 16 July SPX chain and sized to a hypothetical portfolio, so the choices are comparable in dollars; reprice from the live chain before any entry.
First, size the risk before choosing a structure
A hedge only works if it is scaled to what it protects. The starting point is beta-weighting: expressing the whole book as an equivalent amount of index exposure. A portfolio that moves roughly one-for-one with the S&P 500 has a beta near 1.0, so its index-equivalent notional is close to its market value.
Take a hypothetical $1.5 million book with a beta of about 1.0. One SPX option contract carries a notional of the index level times the $100 multiplier, or roughly $756,000 at 7,560. Two contracts therefore cover close to the full $1.5 million of exposure. That is the anchor for everything that follows: two SPX contracts, expiring 16 October 2026 (the 92-day expiry), priced from the chain on 16 July 2026 (Source: SaxoTrader, indicative intraday mids). These are a 16 July snapshot; after the overnight move, puts will be somewhat richer and calls a little cheaper, so treat every figure below as illustrative and reprice from the live chain before any entry.
Important note: The strategies and examples provided in this article are purely for educational purposes. They are intended to assist in shaping your thought process and should not be replicated or implemented without careful consideration. Every investor or trader must conduct their own due diligence and take into account their unique financial situation, risk tolerance, and investment objectives before making any decisions. Remember, investing in the stock market carries risk, and it’s crucial to make informed decisions.
The following examples are hypothetical and for educational use only; they are not advice or trade recommendations.
The protective put: full insurance, paid in cash
The simplest hedge buys a put below the current level and holds it as a floor. It leaves all upside intact and, in exchange, costs premium that decays if the market does nothing.
Example structure (illustrative only – not a trade recommendation)
- Buy 2 × 16 October 2026 7,175 put (about 99.35 points, ≈ $9,935 each)
- Net debit: approximately $19,870 = two puts at $9,935 each (hypothetical, for education only)
- Maximum risk on the hedge: the $19,870 premium (about 1.3% of the book for 92 days)
- Protection floor: below 7,175, roughly 5% under spot
- Worst-case book outcome: approximately −6.4%, reached at or below 7,175 and flat thereafter
- Costs and charges apply to each leg; see Saxo pricing for full details
The put pays nothing until the index falls through 7,175, so the first ~5% of any decline is a deductible the investor still absorbs. Below the strike, each point the index loses is offset by the put, capping the total drawdown near 6.4% of the book once the premium is included. Above spot, the portfolio compounds as if unhedged, minus the premium paid.
Strategy insight – the cost of an unbroken floor. A protective put may appeal because it preserves the full upside while capping the downside at a known level; the trade-off is the premium, which is a certain cost paid against an uncertain event. At an at-the-money strike the same put would run about 2.5% for 92 days – close to 10% a year if rolled continuously (Source: SaxoTrader Pro indicative mids, 16 July 2026), which is why most hedgers accept a deductible rather than insure from the first dollar.
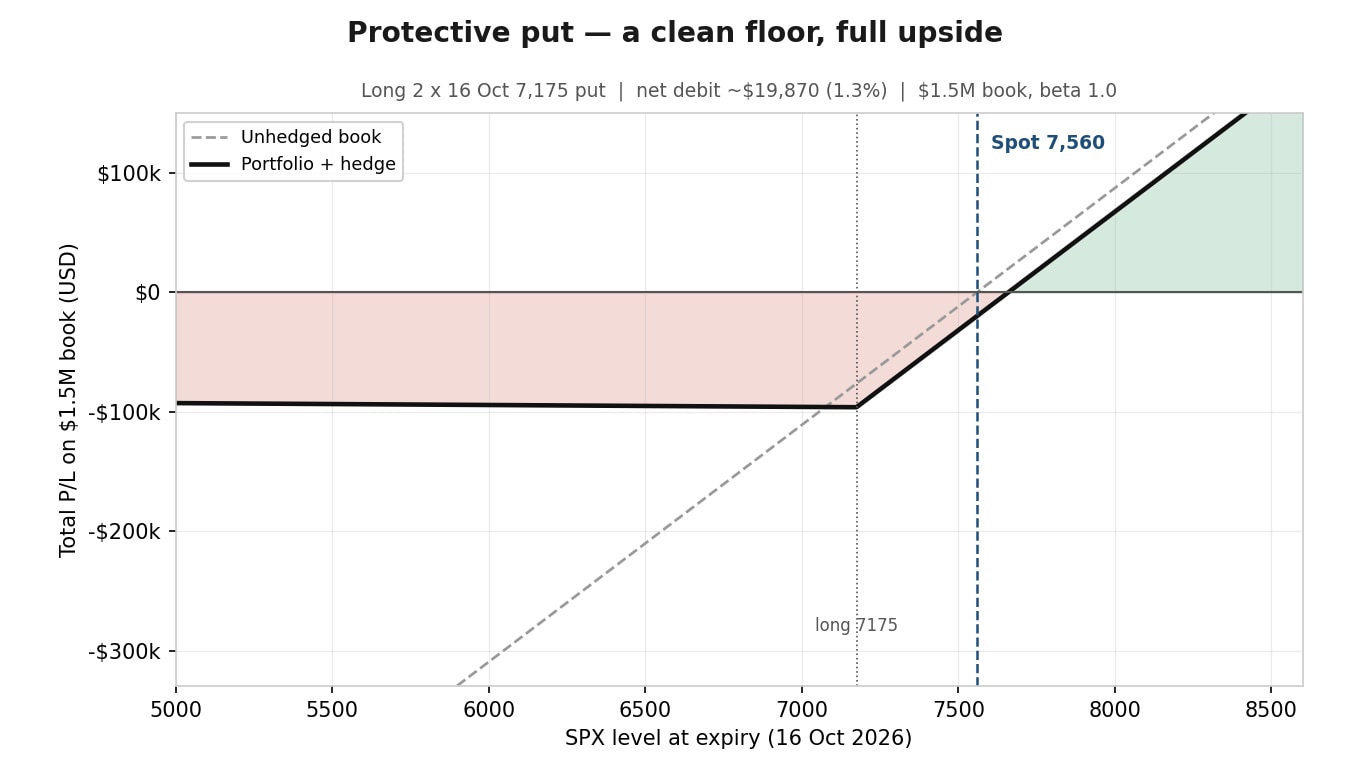 Protective put – portfolio plus hedge, floor near 7,175. This chart is illustrative and for educational purposes only. Past performance is not indicative of future results; figures are illustrative and not predictive. Source: Saxo
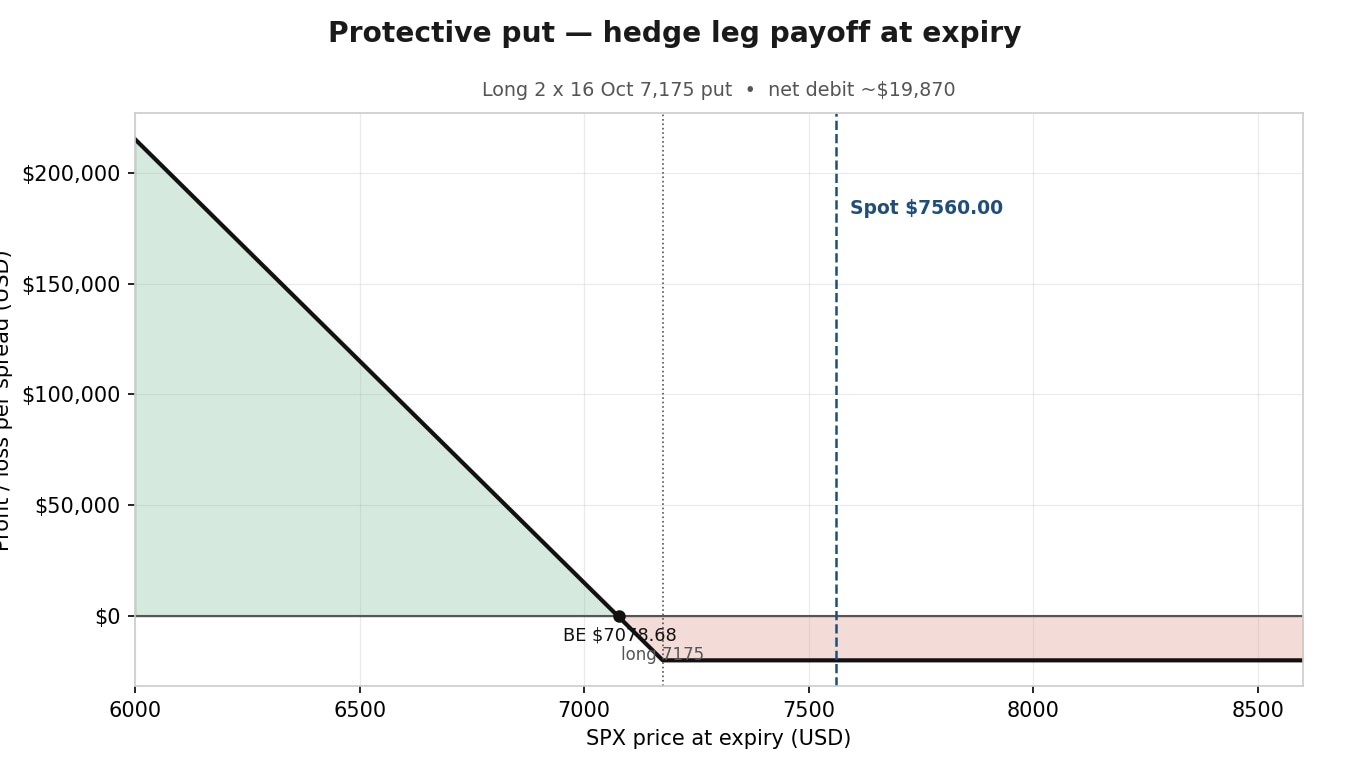 The hedge leg on its own – long put payoff at expiry. Illustrative and educational only; not predictive. Source: Saxo
The collar: finance the put by selling the upside
A collar keeps the same put but pays for most of it by selling a call above the market. The cost falls toward zero; in return, gains above the call strike are handed back. The following example is hypothetical and for educational use only.
Example structure (illustrative only – not a trade recommendation)
- Buy 2 × 16 October 2026 7,175 put (about 99.35 points, ≈ $9,935 each)
- Sell 2 × 16 October 2026 7,950 call (about 75.55 points, ≈ $7,555 each)
- Net debit: approximately $4,760 = $19,870 paid for the puts, less $15,110 taken in on the calls (hypothetical, for education only)
- Maximum risk: floored near −5.4% of the book below 7,175
- Maximum gain: capped near +4.8% of the book at 7,950 (about 5% above spot)
- Costs and charges apply to each leg; see Saxo pricing for full details
The long put still defines the floor; the short call pays for it but caps participation above 7,950. Because the call brings the net cost down to about 0.3% of the book, the collar produces a slightly better downside outcome than the naked put; the only thing given up is the gain above the cap. That is the essence of the structure: it converts uncertain upside into cheap, defined protection.
Strategy insight – you pay with upside, not cash. A collar may suit an investor who wants protection without the premium drag and is willing to forgo strong rallies; the risk is precisely that give-up, since a sharp advance above 7,950 would leave the capped book trailing an unhedged one. One practical benefit of using SPX here: the options are European-style and cash-settled, so the short call cannot be assigned early. A day like 17 July also nudges the arithmetic – as the market falls, calls cheapen and the same put costs more, so the zero-cost balance point drifts lower and would need re-striking on the live chain.
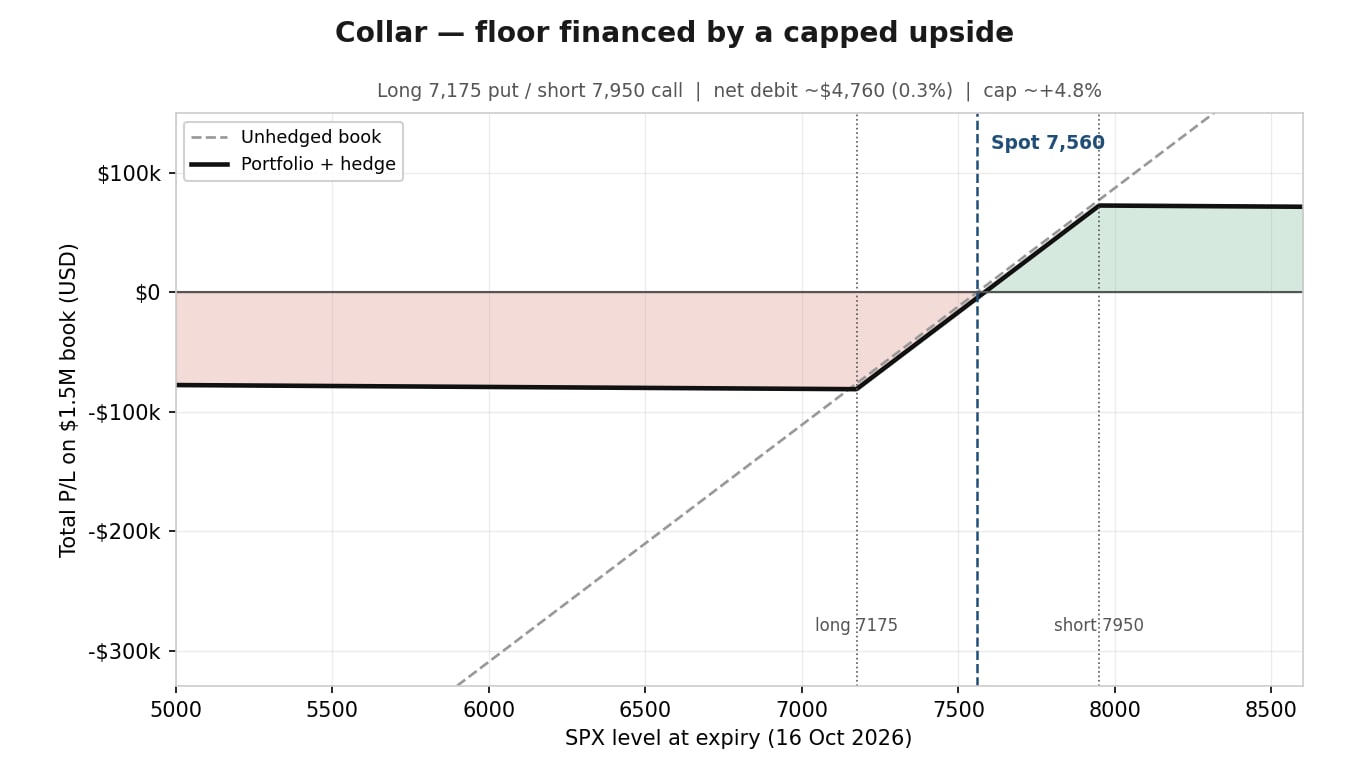 Collar – portfolio plus hedge, floor near 7,175 and cap near 7,950. This chart is illustrative and for educational purposes only. Past performance is not indicative of future results; figures are illustrative and not predictive. Source: Saxo
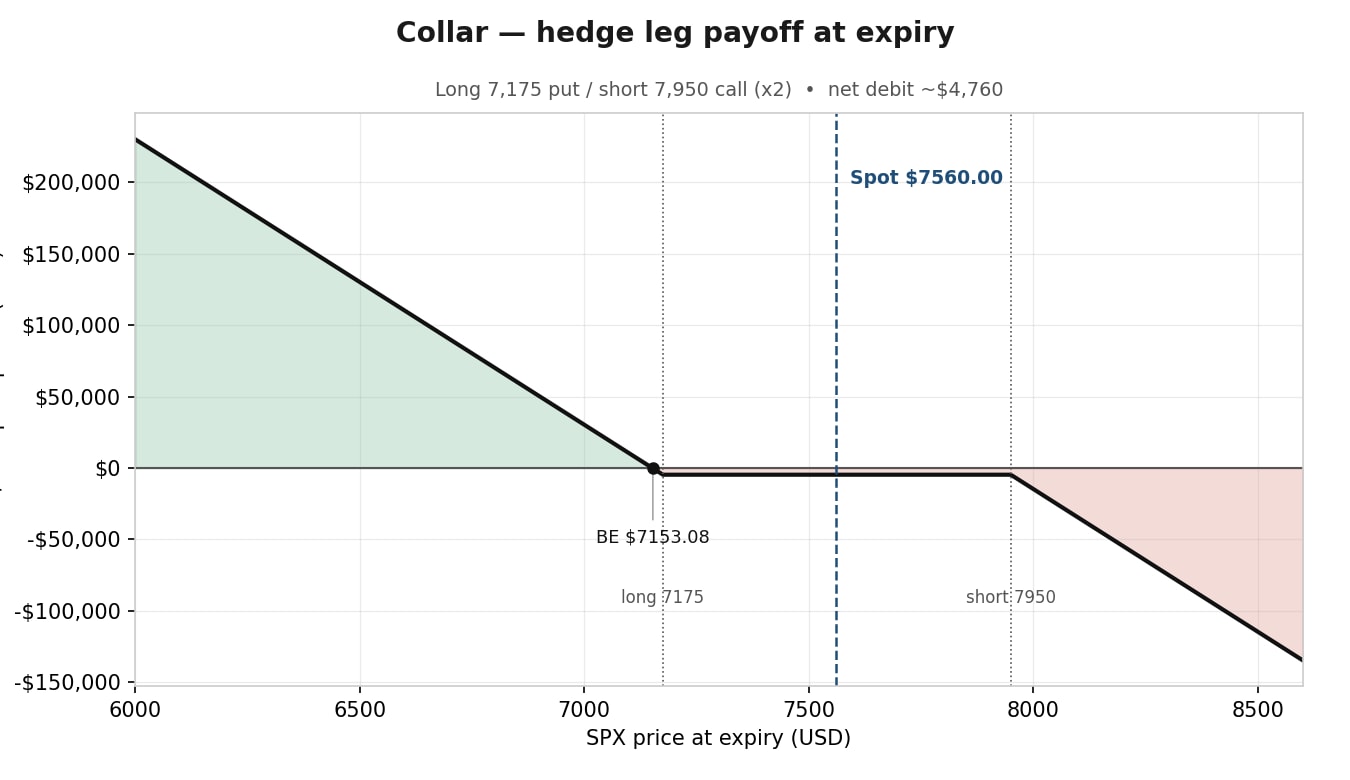 The hedge legs on their own – long put / short call payoff at expiry. Illustrative and educational only; not predictive. Source: Saxo
The put-spread collar: cheapest band, with a catch
Selling a deeper put as well cheapens the structure further – often into a net credit – but it reopens the downside below that lower strike. Protection becomes a band rather than a floor. The following example is hypothetical and for educational use only.
Example structure (illustrative only – not a trade recommendation)
- Buy 2 × 16 October 2026 7,175 put (about 99.35 points, ≈ $9,935 each)
- Sell 2 × 16 October 2026 6,425 put (about 34.90 points, ≈ $3,490 each)
- Sell 2 × 16 October 2026 7,950 call (about 75.55 points, ≈ $7,555 each)
- Net credit: approximately $2,220 = $15,110 on the calls plus $6,980 on the short puts, less $19,870 for the long puts (hypothetical, for education only)
- Protected band: 7,175 down to 6,425 (about −5% to −15%)
- Maximum gain: capped near +5% at 7,950; below 6,425 the book is exposed again, and a deep decline can produce substantial losses
- Costs and charges apply to each leg; see Saxo pricing for full details
Inside the band, this behaves like the collar but is taken on for a small credit rather than a debit. The catch sits below 6,425: the short put reintroduces full downside from there, so a crash of 20% or 30% leaves the book almost as exposed as if it were unhedged. The structure trades completeness for cost.
Strategy insight – a credit is not free protection. A put-spread collar may attract an investor who thinks a moderate pullback is the realistic risk and wants to be paid to carry the hedge; the danger is a tail event that punches through the lower strike, where the protection stops precisely when it is needed most. It defends the likely, not the catastrophic – a distinction that matters more on a day when the tape is already moving.
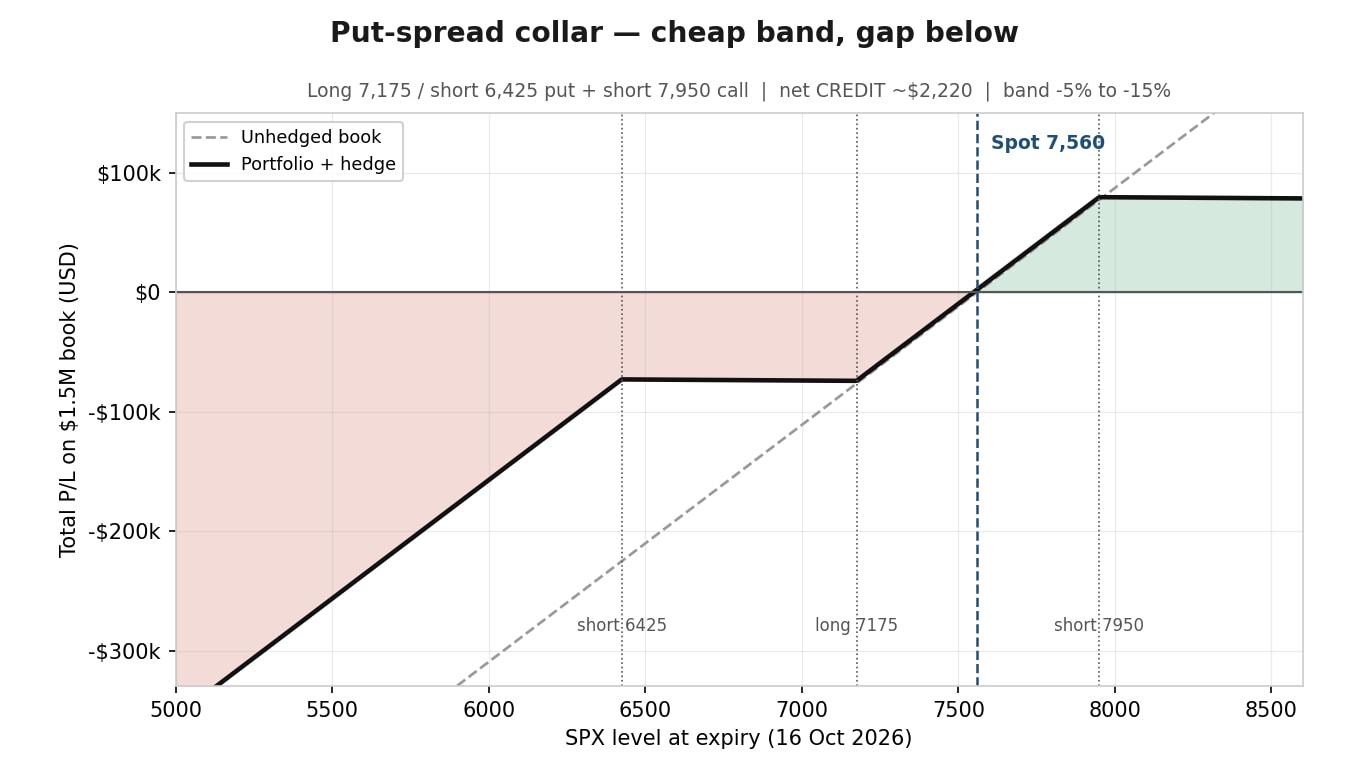 Put-spread collar – portfolio plus hedge; note the gap below 6,425. This chart is illustrative and for educational purposes only. Past performance is not indicative of future results; figures are illustrative and not predictive. Source: Saxo
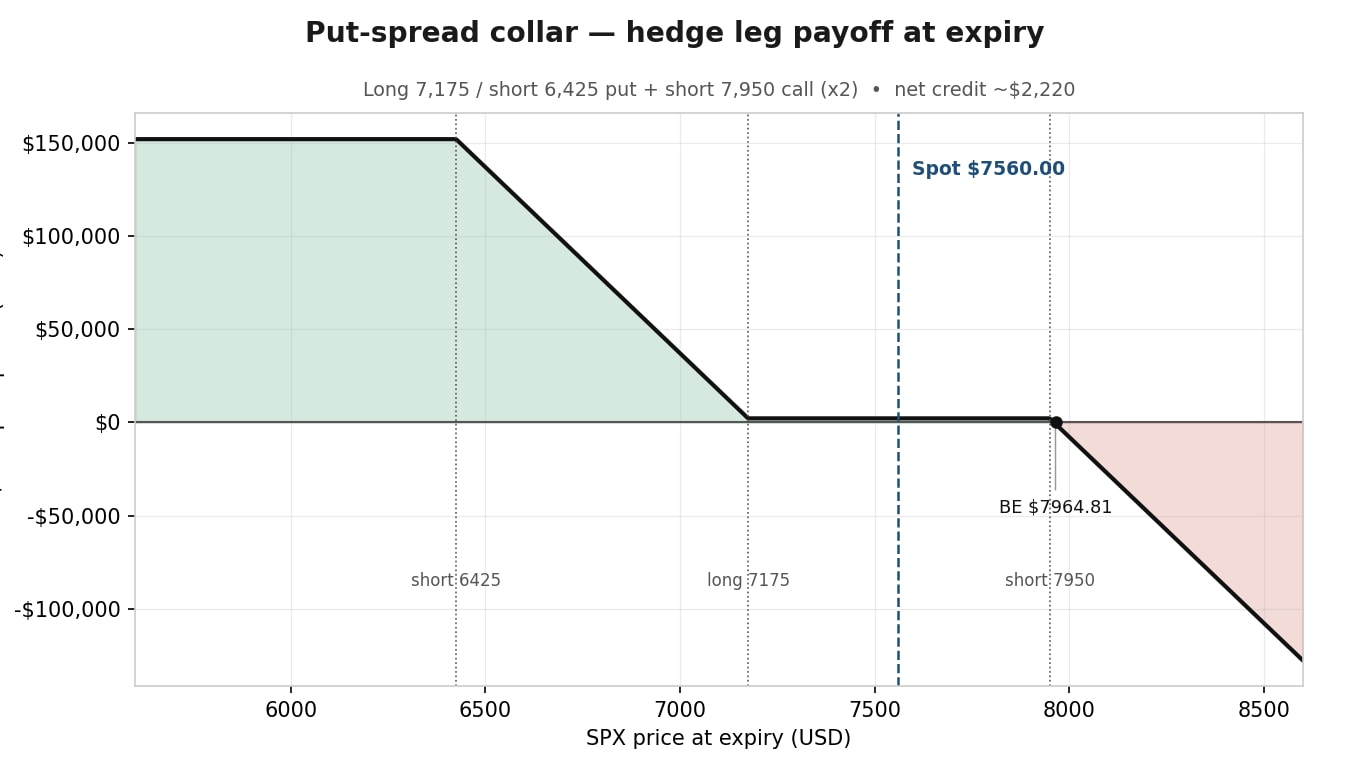 The hedge legs on their own – put spread plus short call payoff at expiry. Illustrative and educational only; not predictive. Source: Saxo
The tail overlay: cheap convexity for a crash
The last structure inverts the priority. Instead of smoothing ordinary pullbacks, it buys a deep out-of-the-money put purely for catastrophe protection, keeping full upside and spending almost nothing. The following example is hypothetical and for educational use only.
Example structure (illustrative only – not a trade recommendation)
- Buy 2 × 16 October 2026 6,050 put (about 22.35 points, ≈ $2,235 each)
- Net debit: approximately $4,470 = two puts at $2,235 each (about 0.3% of the book; hypothetical, for education only)
- Maximum risk on the hedge: the $4,470 premium
- Effective protection: only below 6,050, roughly 20% under spot
- Costs and charges apply to each leg; see Saxo pricing for full details
For an ordinary 10% pullback this put does almost nothing, which is the point – it is not meant to. Its value appears in a true dislocation: a 30% decline would turn the position into roughly $150,000 of offsetting payoff for a $4,470 outlay. Just as important, a deep put is long volatility, so its mark can rise sharply on a VIX spike well before the strike is reached, which is often when a hedger would monetise it rather than hold to expiry.
Strategy insight – insure the disaster, not the drizzle. A tail overlay may suit an investor who can tolerate normal drawdowns but wants cheap cover against a crash while keeping all upside; the risk is that in any milder decline the premium is simply lost, and the payoff is convex only far from spot. The uptick underway on 17 July is a mild illustration: a rising VIX lifts the mark on a deep put long before the index approaches the strike. This is the structure closest to how many desks actually carry standing protection – small, deep, and rolled.
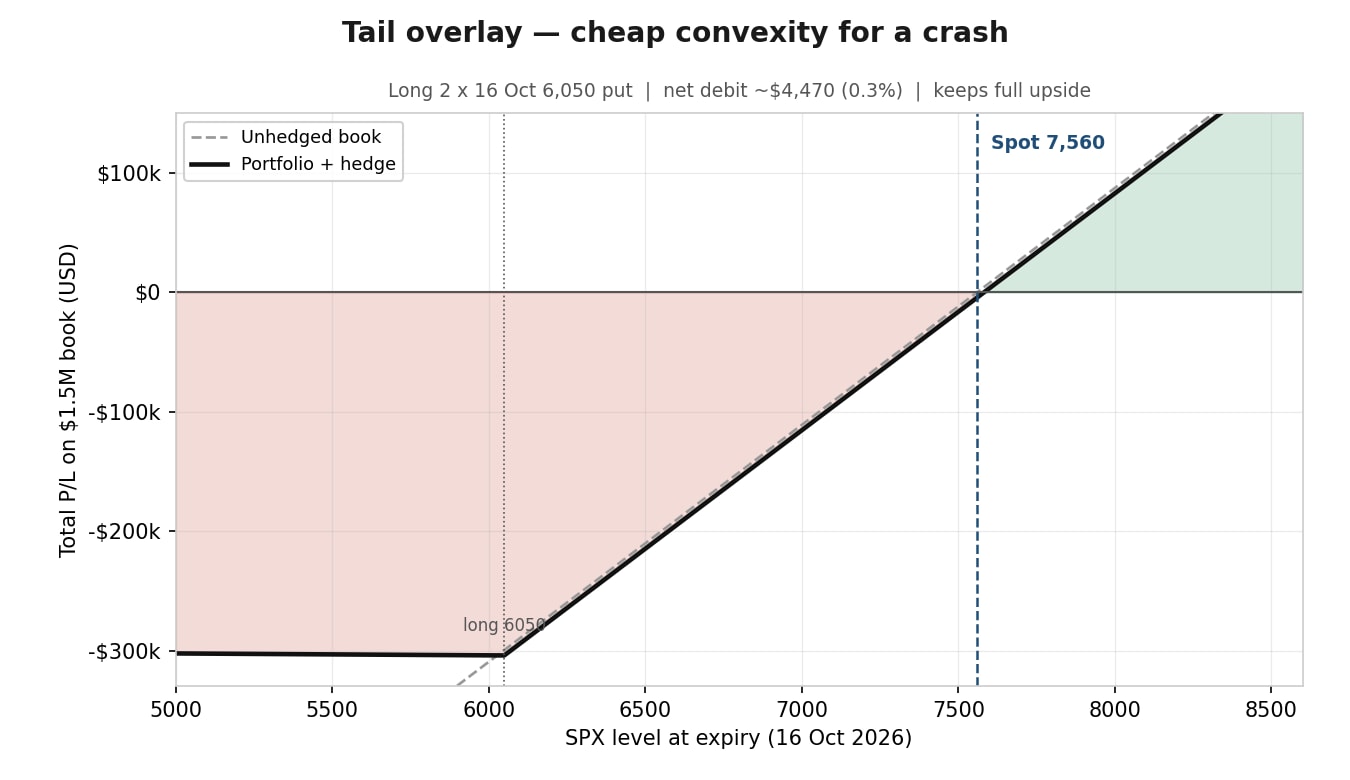 Tail overlay – portfolio plus hedge, convex below 6,050. This chart is illustrative and for educational purposes only. Past performance is not indicative of future results; figures are illustrative and not predictive. Source: Saxo
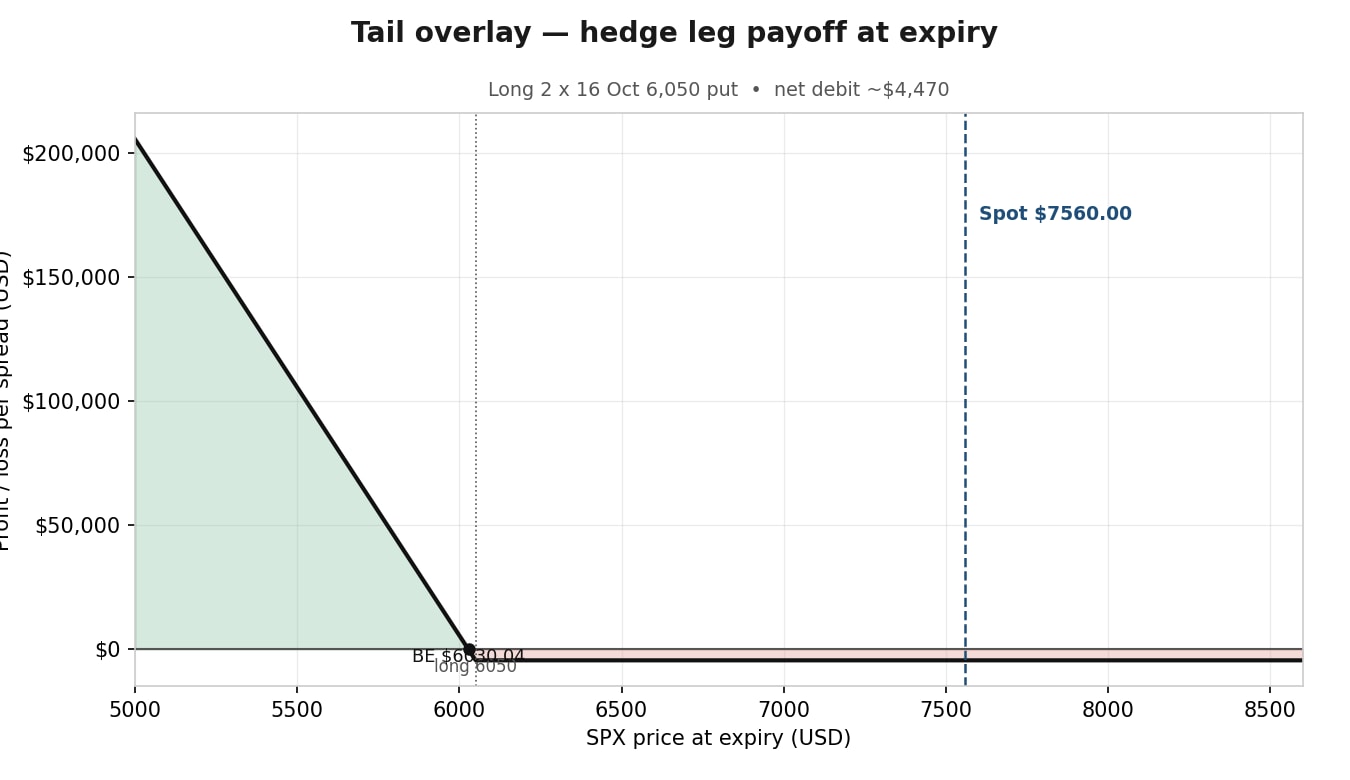 The hedge leg on its own – deep long put payoff at expiry. Illustrative and educational only; not predictive. Source: Saxo
The same book, four hedges, side by side
The figures below show the approximate outcome for the $1.5 million book at expiry under each structure, net of premium (hypothetical, for education only – not predictive; Source: SaxoTrader Pro indicative mids, 16 July 2026). Past performance is not indicative of future results. Each bullet is one SPX scenario, listing the outcome for the unhedged book and for each of the four hedges.
- SPX −30% (≈5,292): Unhedged −$450,000 · Protective put −$93,300 · Collar −$78,200 · Put-spread collar −$297,800 · Tail overlay −$302,900
- SPX −20% (≈6,048): Unhedged −$300,000 · Protective put −$94,500 · Collar −$79,400 · Put-spread collar −$147,800 · Tail overlay −$304,100
- SPX −10% (≈6,804): Unhedged −$150,000 · Protective put −$95,700 · Collar −$80,600 · Put-spread collar −$73,600 · Tail overlay −$154,500
- SPX flat (7,560): Unhedged $0 · Protective put −$19,900 · Collar −$4,800 · Put-spread collar +$2,200 · Tail overlay −$4,500
- SPX +8% (≈8,165): Unhedged +$120,000 · Protective put +$100,200 · Collar +$72,300 · Put-spread collar +$79,300 · Tail overlay +$115,600
Read across the rows and the trade-offs surface. The collar gives the best result in a normal-to-severe decline and the worst in a strong rally. The put-spread collar is the only structure that is positive when the market goes nowhere, and the best at −10%, but it collapses toward the unhedged line in a crash. The tail overlay barely moves the needle until −30%, yet it keeps almost the entire upside. No column wins everywhere – which is the whole lesson. Options carry a high risk of rapid loss and are not suitable for every investor.
Before acting, an investor would still check:
- Bid/ask spreads on each leg – wide markets erode the theoretical cost, especially on deep strikes and far-out calls, and spreads tend to widen on a volatile session like 17 July
- Open interest and liquidity at the chosen strikes
- That the hedge notional still matches the book after any change in market value or beta
- An exit or roll plan – long puts are often monetised into a volatility spike rather than held to expiry
- Settlement style: SPX and SPXW options are European-style and cash-settled, so there is no early-assignment or ex-dividend assignment risk on the short legs
- Costs and charges: see Saxo pricing for costs and applicable charges: https://www.home.saxo/rates-and-conditions/pricing-overview
Final thoughts
Hedging is less about predicting a top than about pricing insurance while it is cheap. The overnight wobble on 17 July does not forecast a fall, and a mid-16s VIX still means the market is, in our view, charging relatively little for protection – a little more than it was on 16 July, but far from expensive (Source: exchange data, Cboe, as of early 17 July 2026). Options carry a high risk of rapid loss and are not suitable for every investor.
The four structures are not ranked. They are four answers to one question – how much cash, how much upside, and how much completeness an investor is willing to trade – and the right answer depends entirely on which of those three they least want to give up. A protective put spends cash to keep a clean floor and full upside. A collar spends upside instead of cash. A put-spread collar spends completeness for a credit. A tail overlay spends almost nothing and insures only the extreme.
Options do not remove uncertainty. They let an investor choose the shape of it in advance, and pay for that shape in a currency of their choosing. A quiet market, in our view, is simply a better moment than a falling one to decide which currency that is.
This content is marketing material and should not be regarded as investment advice. Trading financial instruments carries risks and historic performance is not a guarantee of future results.
The author does not hold positions in the specific SPX/SPXW option structures illustrated in this article; the author does hold broad S&P 500-linked exposure.
The Author is permitted to wait at least 24 hours from the time of the publication before they trade the instruments themselves.
The instrument(s) referenced in this content may be issued by a partner, from whom Saxo receives promotional fees, payment or retrocessions. While Saxo may receive compensation from these partnerships, all content is created with the aim of providing clients with valuable information and options.
This content will not be changed or subject to review after publication.
This content is marketing material and should not be regarded as investment advice. Trading financial instruments carries risks and historic performance is not a guarantee of future results.
The Author is permitted to wait at least 24 hours from the time of the publication before they trade the instruments themselves.
The instrument(s) referenced in this content may be issued by a partner, from whom Saxo receives promotional fees, payment or retrocessions. While Saxo may receive compensation from these partnerships, all content is created with the aim of providing clients with valuable information and options.
This content will not be changed or subject to review after publication.
The Author is permitted to wait at least 24 hours from the time of the publication before they trade the instruments themselves.
The instrument(s) referenced in this content may be issued by a partner, from whom Saxo receives promotional fees, payment or retrocessions. While Saxo may receive compensation from these partnerships, all content is created with the aim of providing clients with valuable information and options.
This content will not be changed or subject to review after publication.
| More from the author |
|---|