
Un seul compte Saxo suffit pour accéder à nos plateformes.

Before Alphabet reports: reading the expected move and structuring three views
Options 10 minutes to read

Résumé: Alphabet reports on 22 July after the close, and the options market is pricing a move of roughly 6.7% by the following Friday. Using that number as the anchor, this article walks through how to trade an earnings event with options, mapping a bullish call broken-wing butterfly, a neutral iron condor and a bearish put spread to the expected-move range - with Alphabet as the worked example.
Earnings are a scheduled uncertainty – the date is known, the outcome is not. The craft lies in pricing the move and choosing a structure that fits the trader’s view; the actual number is almost beside the point.
Every quarter a company reports and its stock gaps. For an options trader, the interesting part is not guessing the result – the market has already priced how far the stock might move, and that price sits in the options chain before the event. Trading earnings well starts with reading that price, not with a fundamental forecast.
This piece uses Alphabet (GOOGL) – reporting after the US market close on 22 July 2026 (Source: Alphabet Investor Relations, as of 15 July 2026) – as the example. The A shares last traded near $371.80, up roughly 3.4% on the session from the prior close of $359.51 (Source: Saxo, indicative, as of 15 July 2026), lifting the stock back to its 50-day moving average near $372, with the 200-day far below near $321 (Source: SaxoTrader, as of 15 July 2026). As is typical into a report, near-dated implied volatility is elevated. For traders considering the event, the key question is whether the risk/reward justifies a position – and, if so, how to structure it with defined risk rather than an outright bet into a binary catalyst.
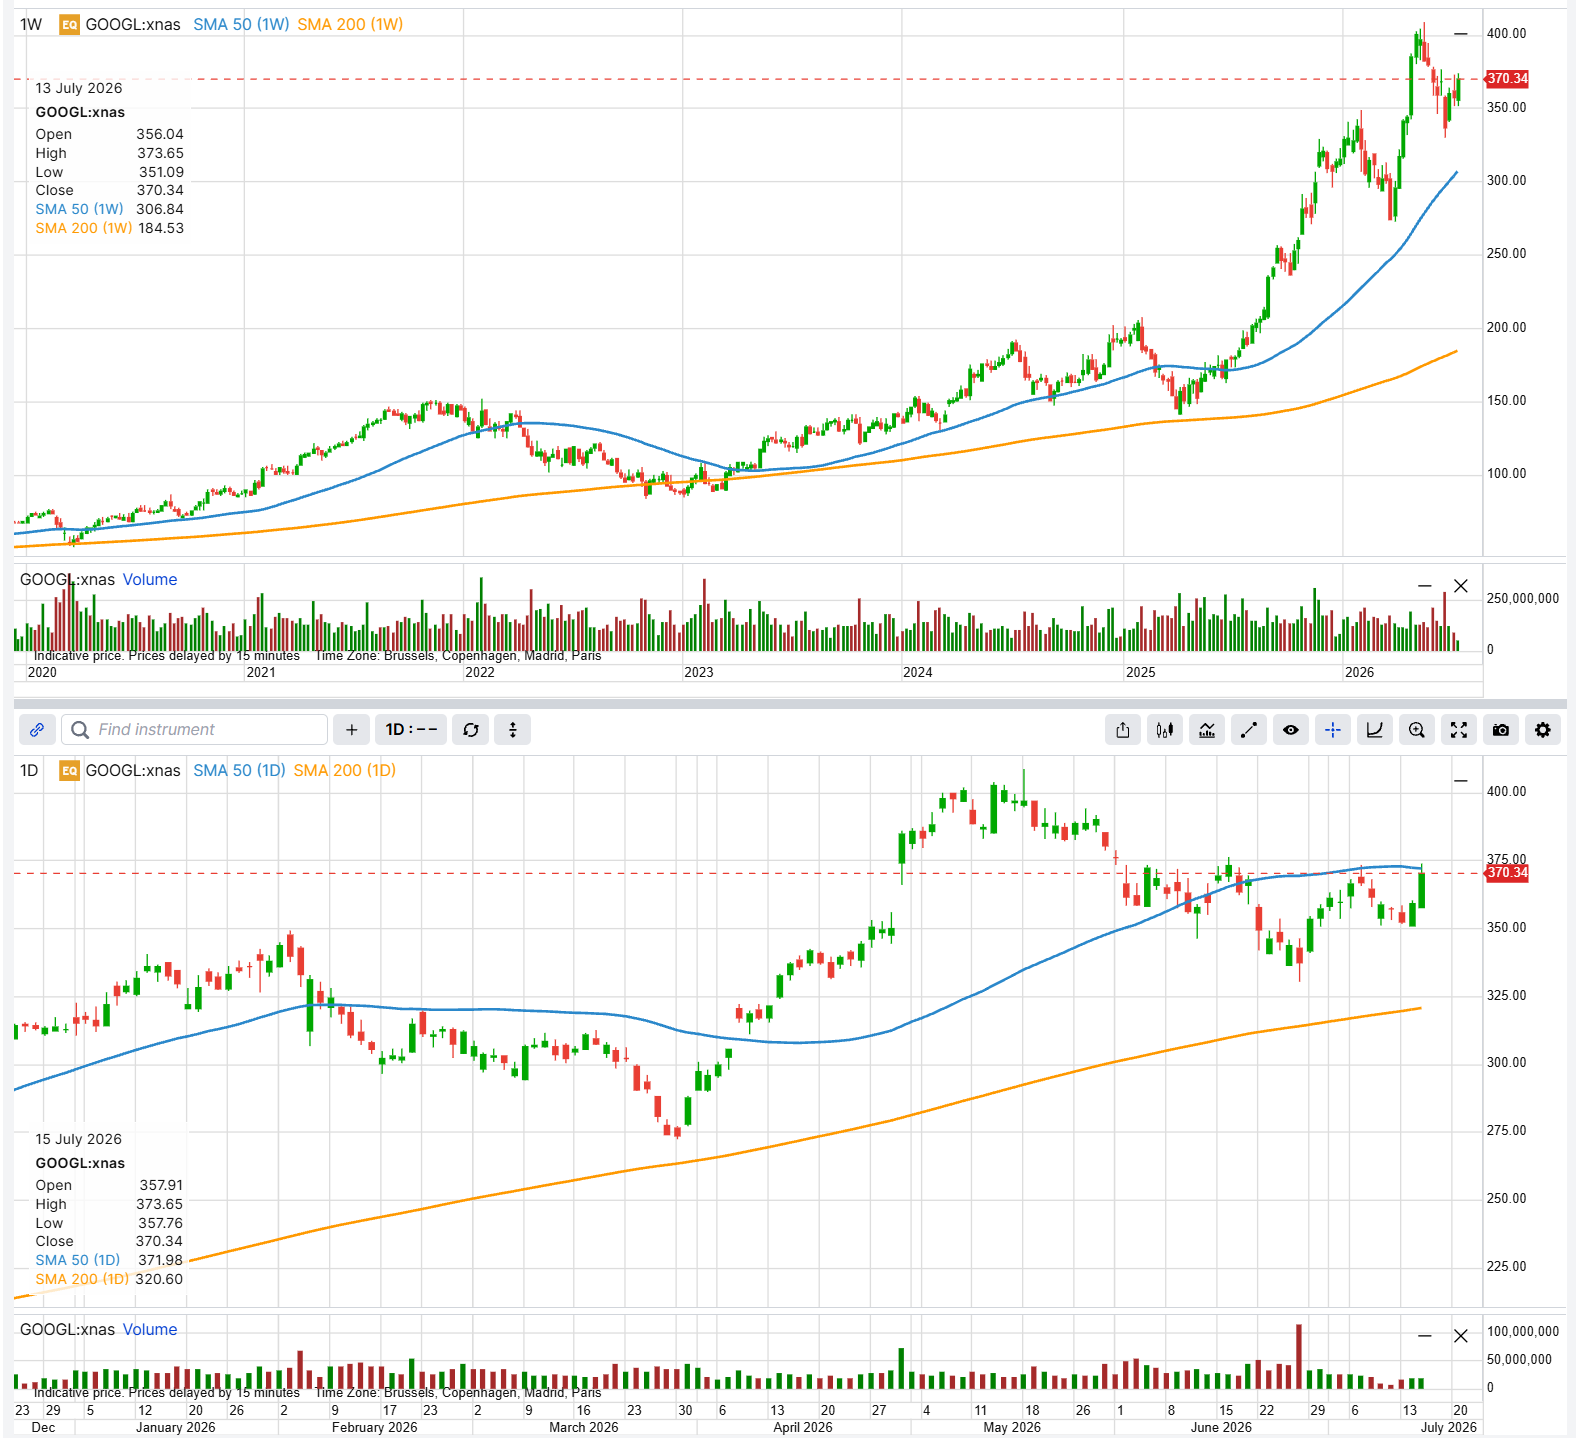 GOOGL heads into earnings sitting on its 50-day moving average, about $372 on the daily, well above the 200-day near $321. Illustrative and educational, not predictive. Source: SaxoTrader, as of 15 July 2026 around close
Past performance is not indicative of future results. This chart is illustrative and for educational purposes only; it is not predictive.
Step one: read the expected move
A common way to estimate the market-implied move is to add the at-the-money call premium and the at-the-money put premium for the expiry that captures the event. That combined straddle price is a rough proxy for how much movement option buyers are paying for.
One detail decides which expiry to use. Alphabet reports after the close on 22 July, so the options that expire on 22 July settle before the numbers land – they do not contain the event. The first expiry that does is the 24 July weekly. At the $372.5 strike the call was near $11.65 and the put near $13.30 – a straddle of about $24.95 (Source: Saxo option chain, indicative as of 15 July 2026). Against roughly $371.80, that is about a 6.7% expected move, an implied range of about $347 to $397 – the yardstick every structure below is measured against.
Step two: respect the volatility crush
Earnings options are expensive because of implied volatility. Into the event, implied volatility in the nearest event-bearing expiry is bid up; once the result is out, it collapses regardless of direction – the “IV crush.” A trader can be right on direction and still lose on a long option if the crush outweighs the move.
Alphabet shows the textbook shape. The 24 July expiry, which carries the report, prints at-the-money implied volatility around 53%; the 22 July expiry that expires just before the release sits lower near 50%; and further out the curve falls away – August near 38%, September near 36% (Source: Saxo, as of 15 July 2026). In our view a term structure this front-loaded argues against buying naked front-week premium and gives net-selling structures a tailwind – though a large enough move can still overwhelm any crush, which is why each example below is defined-risk.
Important note: The strategies and examples provided in this article are purely for educational purposes. They are intended to assist in shaping your thought process and should not be replicated or implemented without careful consideration. Every investor or trader must conduct their own due diligence and take into account their unique financial situation, risk tolerance, and investment objectives before making any decisions. Remember, investing in the stock market carries risk, and it’s crucial to make informed decisions.
Bullish view: upside to a target, financed by the crush
For a moderately bullish view that expects a grind higher rather than a moonshot, a call broken-wing butterfly is one educational example. Structured for a small net credit, it profits most if the stock drifts up to a chosen target and – because it is opened for a credit – carries no loss at all if the stock instead sits still or falls.
The following examples are hypothetical and for educational use only; they are not advice or trade recommendations. On Alphabet, the $382.5 strike carries the heaviest near-term call open interest, a natural upside magnet inside the implied move:
Example structure (illustrative only – not a trade recommendation)
- Buy 1 24 July 2026 $375 call
- Sell 2 24 July 2026 $382.5 calls
- Buy 1 24 July 2026 $395 call
- Net credit: approximately $0.60 ($60 per structure)
- Maximum profit: approximately $810 near $382.5 at expiry
- Maximum risk: approximately $440 if GOOGL closes above $395
- Downside: the $60 credit is retained if GOOGL sits below $375
- Upper break-even: approximately $390.60
Risk: the position is opened for a credit, so a flat or falling stock leaves the roughly $60 credit as the outcome – there is no downside risk below $375. The cost of that asymmetry sits on the upside: a gap well through $395 produces a defined loss of about $440, and the short calls carry early-assignment risk. Costs and charges apply to each leg; see Saxo pricing for full details.
The lower $375 call and the two short $382.5 calls build the profit tent that peaks at $382.5; the further $395 call caps the loss on a runaway rally. The wings are deliberately unequal – $7.50 on the lower side against $12.50 on the upper – and it is that skew that turns the structure into a small credit. If Alphabet climbs toward $382.5 and stalls, the position may reach its full value; if it does nothing, the credit is kept.
Strategy insight – a target, not a direction. This is a bet on where, not simply up. The structure may profit if GOOGL drifts to the $382.5 area by expiry, and it keeps its small credit if the stock falls; the trade-off is that a very large up-move above the $390.60 break-even turns it into a loss capped near $440. A broken-wing butterfly rewards a considered target and punishes a melt-up – the opposite instinct to buying a call.
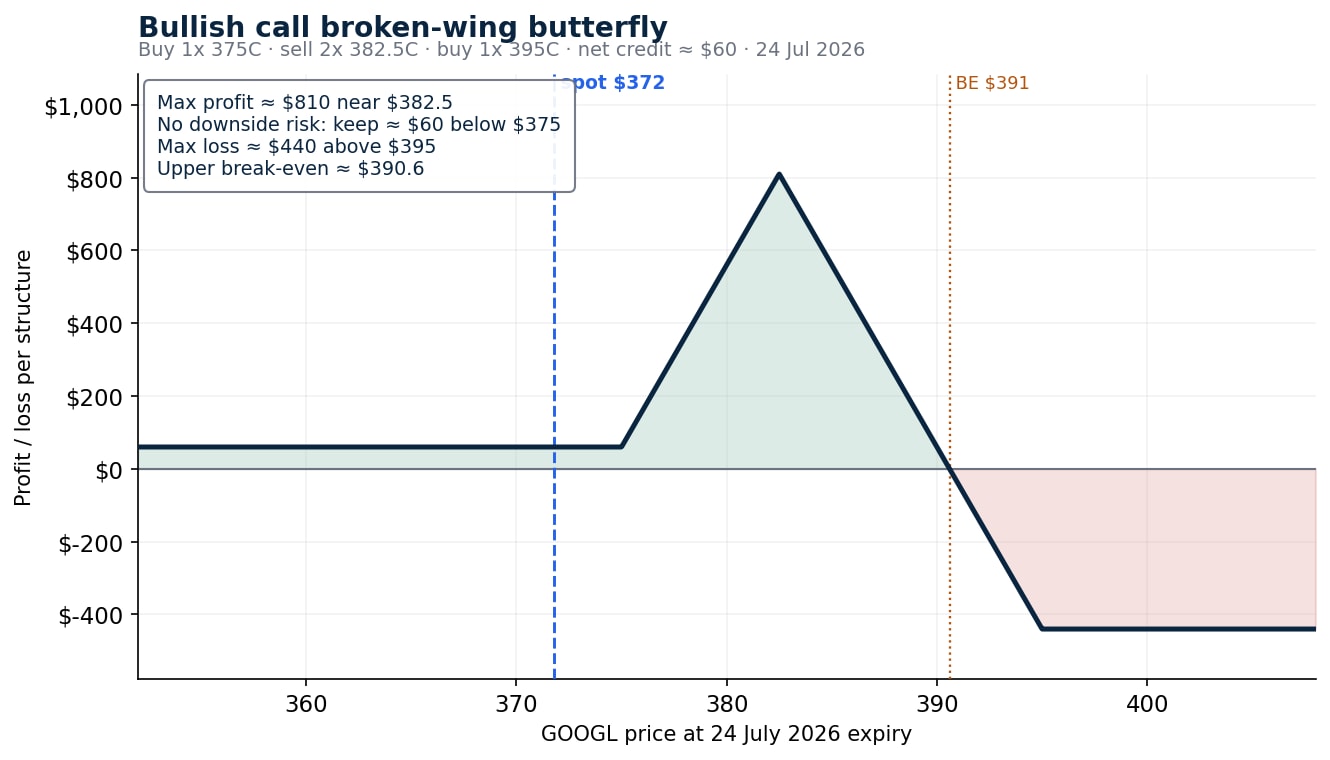 Call broken-wing butterfly, modelled at the 24 July expiry. Illustrative and educational only – not a trade recommendation, and not predictive. Source: Saxo
Neutral view: selling the expected move
For a view that the market is over-pricing the move, a short iron condor is one educational example: it collects premium and may reach its maximum profit if the stock stays inside a chosen range, in effect selling the implied move in the hope the realised move is smaller.
On Alphabet, the range is drawn in advance by the expected move and by open-interest clusters at the $350 put and the $395 call:
Example structure (illustrative only – not a trade recommendation)
- Sell 1 24 July 2026 $350 put, buy 1 24 July 2026 $340 put
- Sell 1 24 July 2026 $395 call, buy 1 24 July 2026 $405 call
- Net credit: approximately $3.75 ($375 per condor)
- Maximum risk: approximately $625 (the $10 wing width minus the net credit)
- Maximum profit: approximately $375, if GOOGL finishes between $350 and $395
- Break-evens at expiry: approximately $346.25 and $398.75
Risk: the maximum loss is the wing width minus the net credit – about $625 – if GOOGL settles beyond either long strike; the short legs carry early-assignment risk. Costs and charges apply to each leg; see Saxo pricing for full details.
The two short strikes define the range the trader wants the stock to hold; the two long strikes cap the loss if the range breaks. What makes this a clean expression of the “sell the move” idea is where the break-evens land: about $346.25 and $398.75 – almost exactly on the implied-move edges of $347 and $397. The trade may benefit from the post-earnings crush, which speeds the decay of both spreads; the risk is defined, and a settle beyond either break-even turns the credit into a loss up to the $625 maximum.
Strategy insight – selling the expected move. An iron condor into earnings is a short-volatility position: it may profit if the realised move is smaller than the implied one and loses if it is larger. Because the break-evens sit on the implied-move boundary, the trade is, quite literally, a wager that Alphabet moves less than the roughly $25 the market is charging.
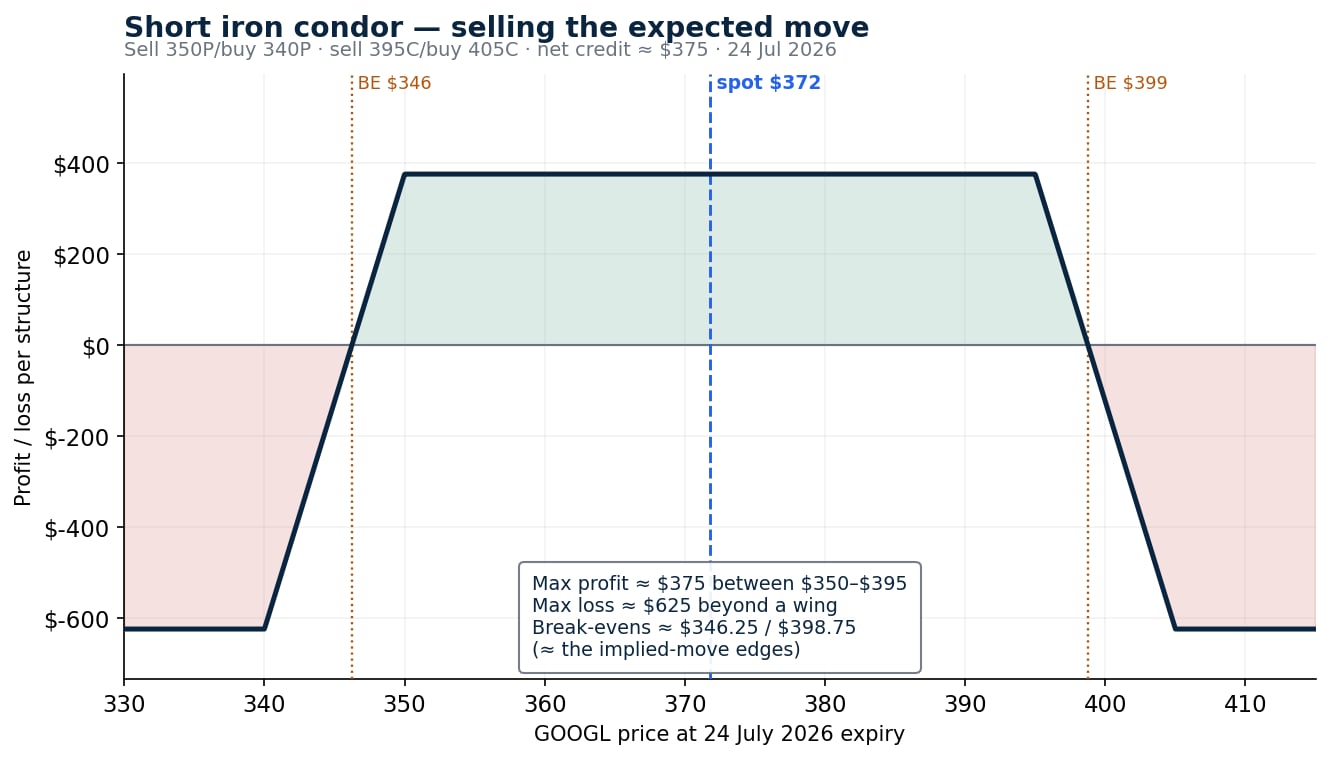 Short iron condor with break-evens on the implied-move edges. Illustrative and educational only – not a trade recommendation, and not predictive. Source: Saxo
Bearish view: targeting the downside, and how the trade is financed
For a directional-down view, a bear put spread is one educational example: a long put near the money for the downside exposure, part-financed by a short put at the target level, which caps both the cost and the reward.
On Alphabet, the long strike sits just under the 50-day moving average near $372, and the short strike anchors to the lower edge of the expected move near $350:
Example structure (illustrative only – not a trade recommendation)
- Buy 1 24 July 2026 $370 put
- Sell 1 24 July 2026 $350 put
- Net debit: approximately $7.53 ($753 per spread)
- Maximum risk: approximately $753 if GOOGL closes at or above $370
- Maximum profit: approximately $1,247 if GOOGL finishes at or below $350
- Break-even at expiry: approximately $362.47 (about 2.5% below spot)
Risk: the maximum loss is the net debit – about $753 – if GOOGL holds at or above $370; the short put carries early-assignment risk. Costs and charges apply to each leg; see Saxo pricing for full details.
The long $370 put provides the downside exposure; the short $350 put reduces the cost but caps the gain below that level. For the spread to profit, GOOGL has to fall through the $362.47 break-even – a move of about 2.5% – and it reaches full value only at or below $350, near the bottom of the implied move.
Strategy insight – the structure carries a volatility view. A bear put spread is a debit structure: its long leg sits nearer the money and carries more vega than the short leg, so the post-earnings volatility crush is a mild headwind rather than a help – the position needs a real move down to profit, and its maximum loss is the $753 paid. It is worth contrasting with a second, short-volatility way to lean bearish. A bear call credit spread – for example selling the 24 July $380 call and buying the $390 call for a net credit of roughly $3.10 – may profit if GOOGL simply fails to rally above $380, and the same crush that hinders the put spread would in that case work in its favour, in exchange for a capped profit and a defined loss if the stock climbs. The two share a broad direction but differ in their volatility exposure – a contrast a trader may prefer to reason through independently rather than take on trust.
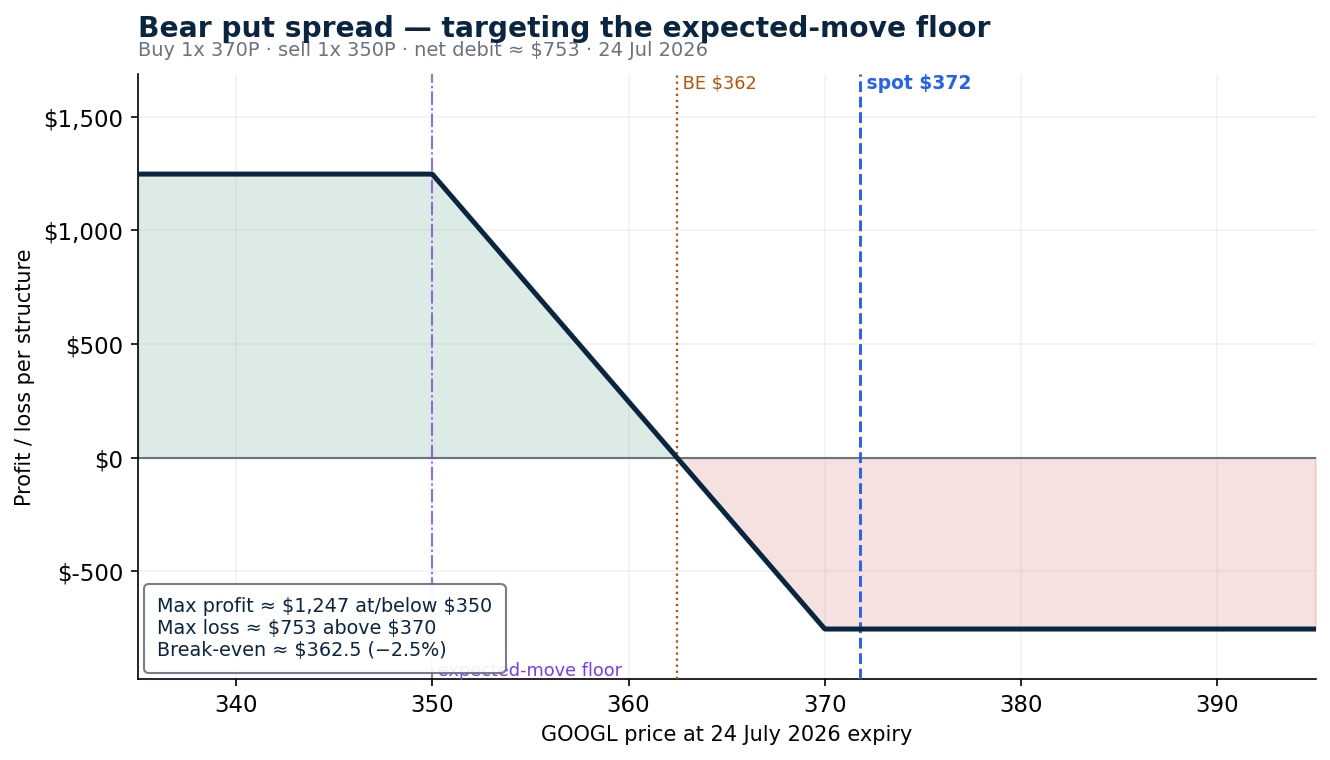 Bear put spread targeting the expected-move floor near $350. Illustrative and educational only – not a trade recommendation, and not predictive. Source: Saxo
A note on the expiry: all three structures and the expected-move calculation use the 24 July weekly, because it is the first expiry that contains the 22 July after-close report. The 22 July options, despite carrying the same date as the release, expire before the numbers are public and so do not price the event – a reminder that on an after-the-close report it is the next available expiry that captures the move.
Before placing an earnings trade, check:
- Bid/ask spreads – wide spreads can eliminate the theoretical edge at entry, especially in weekly wings
- Volume and open interest at the selected strikes
- Whether earnings are before the open or after the close – it determines which expiry captures the move
- Implied volatility relative to how much the stock typically moves on earnings
- An exit plan defined before entry, particularly for multi-leg structures
- Assignment risk on any short leg that moves in the money (see note below)
Assignment risk note: Because GOOGL options are American-style, any short leg – the butterfly’s short calls, the condor’s short strikes, the put spread’s short put – can be assigned before expiry if it moves in the money, particularly near expiration. Traders should monitor short options and understand the platform’s assignment process before entering.
See Saxo pricing for costs and applicable charges: https://www.home.saxo/rates-and-conditions/pricing-overview
Final thoughts
The method matters more than the ticker. Reading the expected move, anticipating the volatility crush, then matching a defined-risk structure to a view is a process that transfers to any earnings event; Alphabet supplied the live numbers. Notice that none of the three structures needed a forecast of the actual result. Each started from what the market was already charging for the move and asked a different question: is the move worth targeting, worth selling, or worth leaning against – and, in the bearish case, is the conviction about the move or about the volatility?
That reframing – from predicting the news to pricing the reaction – is the core of trading earnings with options. Whether the realised move lands inside or outside the implied range is unknowable in advance, which is why defined-risk structures, with the maximum loss known at entry, can be a more disciplined way to engage. Options carry a high risk of rapid loss and are not suitable for every investor. The expected move shows what the crowd is paying for the reaction; the trader’s job is to decide whether that price is worth taking, and on which side.
The author does not hold positions in any of the instruments mentioned in this article.
Sources: Alphabet Q2 2026 earnings date – Alphabet Investor Relations (abc.xyz/investor); price, option premiums, implied volatility and open interest – Saxo platform, indicative, as of 15 July 2026; moving averages – TradingView, as of 15 July 2026.
This content is marketing material and should not be regarded as investment advice. Trading financial instruments carries risks and historic performance is not a guarantee of future results.
The Author is permitted to wait at least 24 hours from the time of the publication before they trade the instruments themselves.
The instrument(s) referenced in this content may be issued by a partner, from whom Saxo receives promotional fees, payment or retrocessions. While Saxo may receive compensation from these partnerships, all content is created with the aim of providing clients with valuable information and options.
This content will not be changed or subject to review after publication.
This content is marketing material and should not be regarded as investment advice. Trading financial instruments carries risks and historic performance is not a guarantee of future results.
The Author is permitted to wait at least 24 hours from the time of the publication before they trade the instruments themselves.
The instrument(s) referenced in this content may be issued by a partner, from whom Saxo receives promotional fees, payment or retrocessions. While Saxo may receive compensation from these partnerships, all content is created with the aim of providing clients with valuable information and options.
This content will not be changed or subject to review after publication.
The Author is permitted to wait at least 24 hours from the time of the publication before they trade the instruments themselves.
The instrument(s) referenced in this content may be issued by a partner, from whom Saxo receives promotional fees, payment or retrocessions. While Saxo may receive compensation from these partnerships, all content is created with the aim of providing clients with valuable information and options.
This content will not be changed or subject to review after publication.
| More from the author |
|---|