
Un seul compte Saxo suffit pour accéder à nos plateformes.

After the sell-off: an options plan for three outcomes
Options

Résumé: The S&P 500 is about 8% below its October high and the market’s volatility gauge has spiked twice this month. This article sets out how options can be used if the decline continues, stalls or reverses.
A plan that only works if the market bounces is a forecast. The aim here is to be prepared for all three paths.
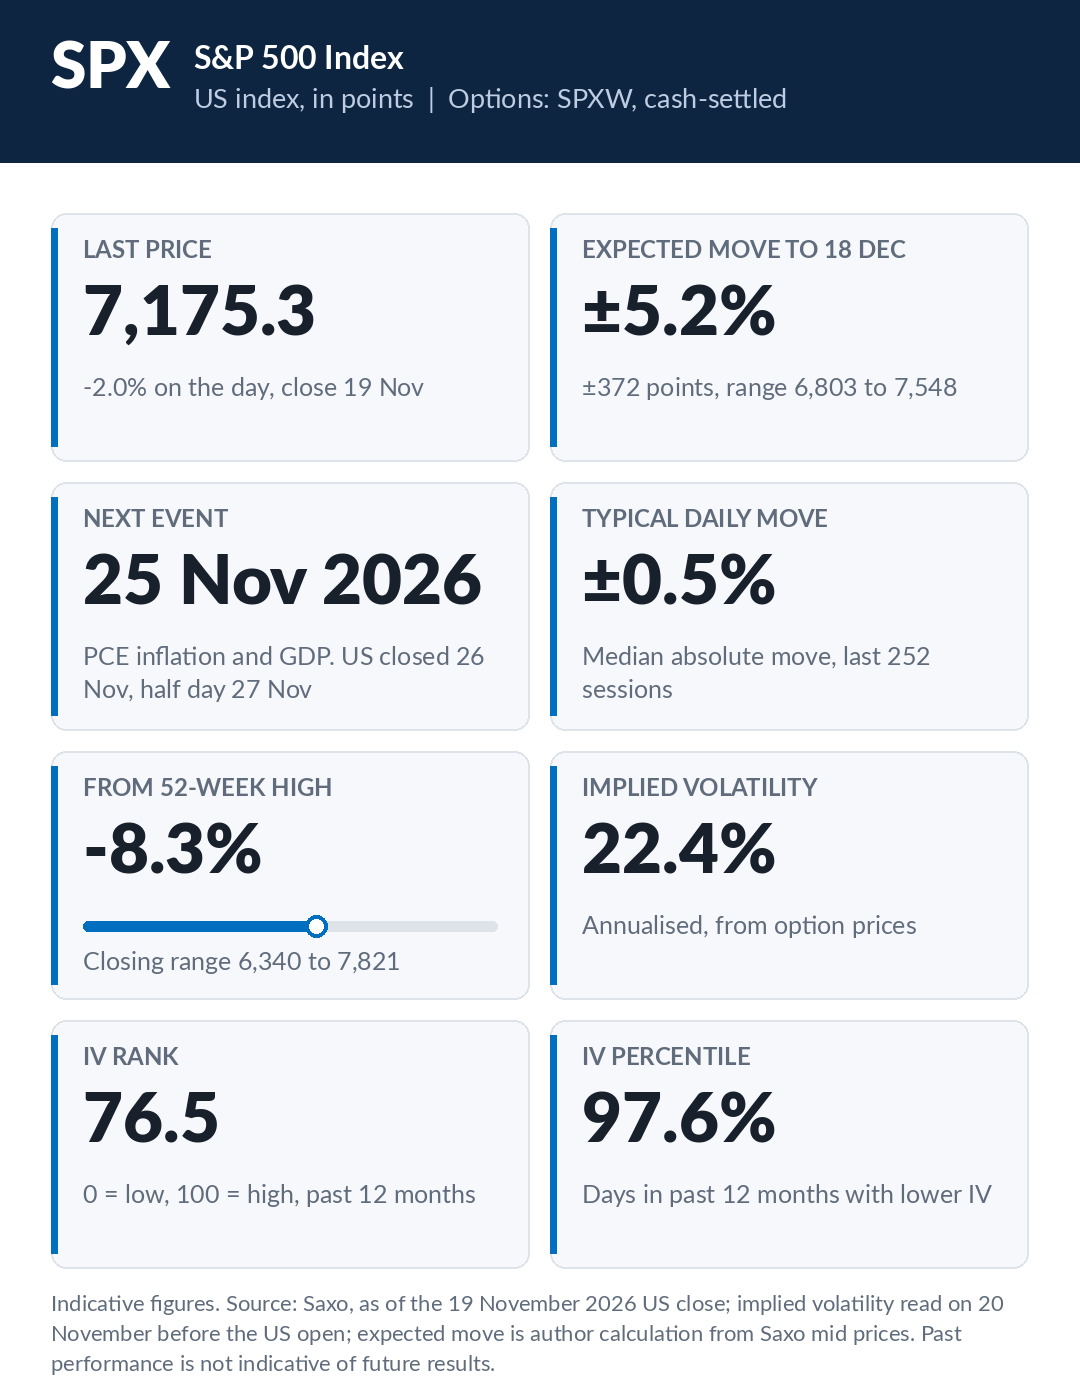 Key information on the S&P 500 index. Indicative figures. The implied volatility shown is Saxo’s measure for S&P 500 options; it is calculated differently from the VIX and reads lower. Source: Saxo, as of the 19 November 2026 US close; implied volatility read on 20 November 2026 before the US open; expected move is the author’s calculation from Saxo mid prices. Past performance is not indicative of future results.
The S&P 500 fell 2.0% on 19 November 2026, extending a decline from its October high.
That leaves the index about 8% below its high (Source: Saxo, as of the 19 November 2026 close).
The VIX shows how nervous option buyers are. It is an index that CBOE calculates from S&P 500 option prices, and it shows how much movement option buyers are paying for over the coming month. It closed above 28 (Source: CBOE), its second jump to that level in November 2026. In between, it had dropped back to readings normally seen in calm markets.
A reading like that says two things: options are expensive, and large daily swings are expected. It says nothing about direction. For investors and traders who are weighing whether to act at all, we think a more useful question than "what happens next" is "what would I do in each case".
What happened after earlier spikes
We looked at every earlier case since 1990 in which the VIX first jumped to this level while the S&P 500 was in a decline of similar size. There are 28 of them (Source: Saxo, CBOE; author calculation). These are first jumps; the second jump of 19 November 2026 has only one match, covered further down.
A week later, the index was higher in about two cases out of three, more often than in an ordinary week.
The path there was rarely smooth. In about two cases out of three, the index also closed below its spike-day level at some point during that week.
The spike day was usually not the bottom. In only about one case in three did the index close near the lowest level of the following three months.
One month on, the typical result looked much like any other month. The range was far wider, though. At the worst, in 2020, the index fell about a quarter further within that month.
Volatility itself usually eased. A month later the VIX was lower in about three cases out of four, although that did not always come with higher share prices.
The sample is small and many of the cases cluster in the same bear markets, so these figures describe the past and are not a forecast. Past performance is not indicative of future results.
Why this resembles early 2022, and where it differs
The sequence in November 2026 is a volatility spike, a few calm days, then a second spike. It has one close precedent in our data: February 2022. In both cases, the second spike arrived with the S&P 500 about 8% below its high.
In 2022 the decline did not end there. The index kept falling in stages and reached its low in October 2022, about a quarter below its January high (Source: Saxo).
The price data also show differences. The 2026 decline started more slowly, and during the calm days the index recovered closer to its high than it did in 2022. One precedent cannot support a conclusion. In our view it may be a reason to have a plan for a longer decline, alongside plans for the other two outcomes.
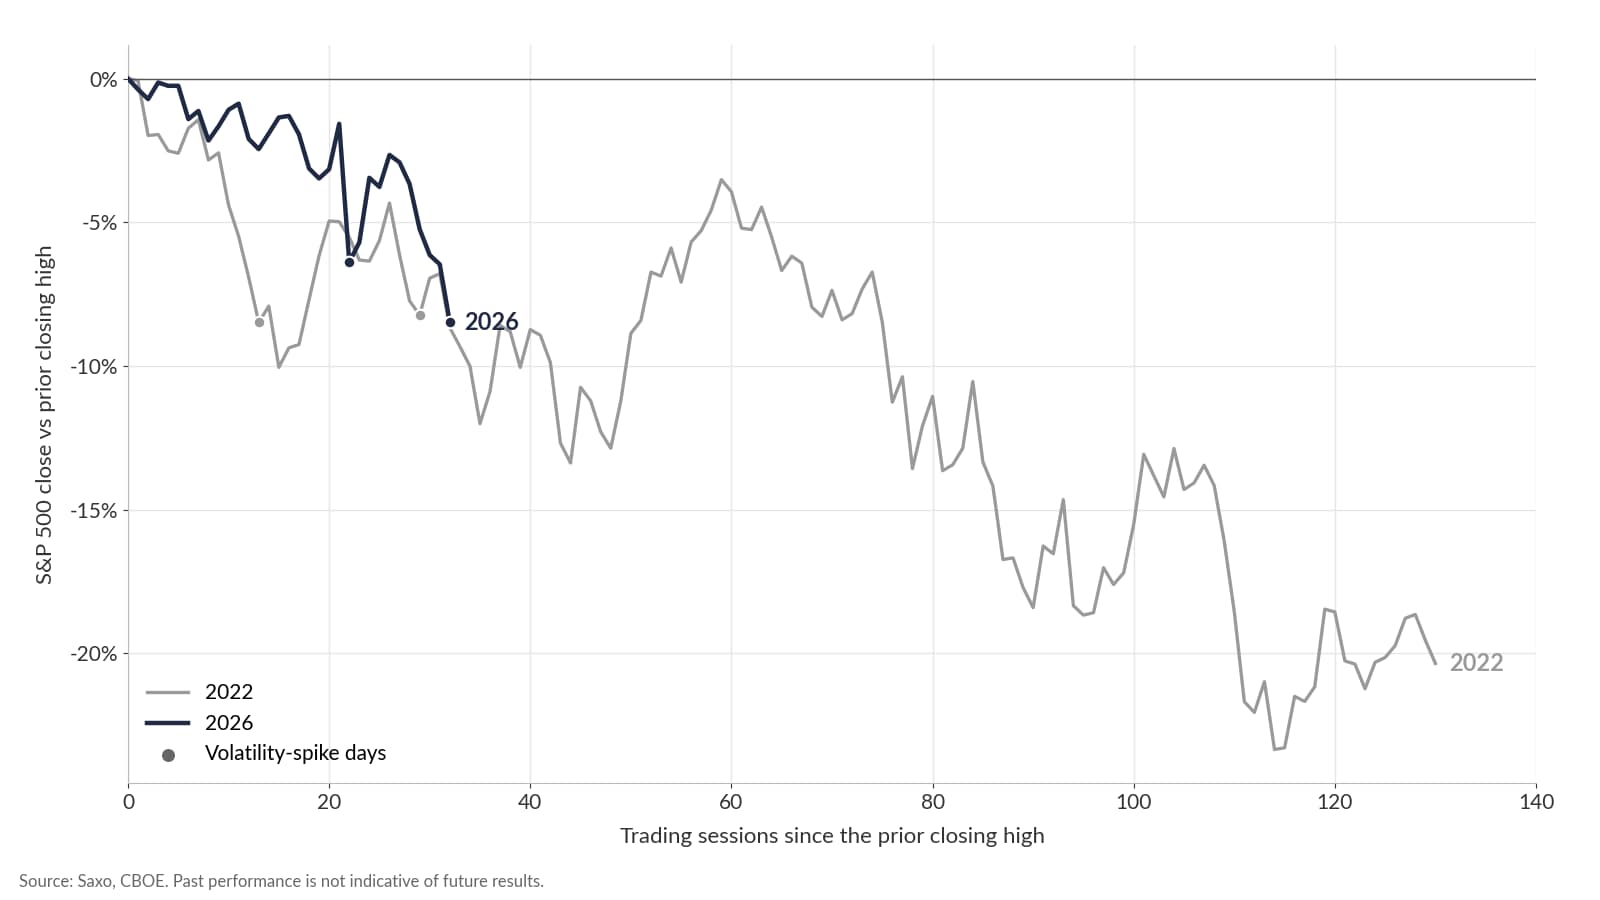 The S&P 500 measured from its prior closing high, early 2022 and autumn 2026, with volatility-spike days marked. Source: Saxo, CBOE. Past performance is not indicative of future results; figures are illustrative and not predictive.
Important note: The strategies and examples provided in this article are purely for educational purposes. They are intended to assist in shaping your thought process and should not be replicated or implemented without careful consideration. Every investor or trader must conduct their own due diligence and take into account their unique financial situation, risk tolerance, and investment objectives before making any decisions. Remember, investing in the stock market carries risk, and it’s crucial to make informed decisions.
Three checks before choosing anything
- Expiring positions. 20 November 2026 is a monthly expiry. Short options close to the market price can swing sharply before they expire and may be assigned, so it can help to decide in advance whether to close, roll or hold them.
- Margin and size. When volatility is high, margin requirements can rise and daily swings are larger. Smaller positions leave room to be wrong.
- Prices. The gap between bid and ask prices tends to widen in stressed markets. Checking the mid price and using limit orders may reduce the cost of getting in and out.
If the decline continues
The following structures are illustrative only - not trade recommendations.
In a continued fall, losses on shares and on sold puts can grow quickly, and protection bought after a spike is expensive. In our view this may favour structures that cap risk over ones that add exposure.
- Adding a bought option to an existing sold option. Buying a put below a put already sold caps a loss that would otherwise keep growing as the index falls, and turns the position into a spread. Maximum loss: the distance between the two strikes, minus the premium originally received, plus the cost of the bought put.
- Put debit spread. Buying a put and selling a lower-strike put costs less than a put alone when options are expensive, and it gains if the index falls toward the lower strike. Maximum loss: the net premium paid.
- Collar on shares already held. A bought put is paid for partly or fully by a call sold above the market. Maximum loss: the fall from the current share price to the put strike, plus any net premium paid or minus any net premium received. Gains above the call strike are given up.
Options carry a high risk of rapid loss and are not suitable for every investor. Costs and charges apply to each leg and vary by account and venue; check the applicable rates before entering any position.
If the market stalls
The following structures are illustrative only - not trade recommendations.
When prices stop trending, implied volatility often drifts lower and option sellers are paid for the passing of time. The risk is that the range breaks, and a seller’s loss can then be several times the premium received.
- Iron condor. A put spread is sold below the market and a call spread above it, often outside the move that option prices imply. Maximum loss: the width of the wider spread minus the total premium received, if the index ends beyond the bought strike of the wider spread.
- Covered call. Selling a call against shares already held brings in premium while the share moves sideways. Maximum loss: the price paid for the shares minus the premium received, if the share falls to zero. The premium offsets only a small part of a further decline, and gains above the strike are given up.
Options carry a high risk of rapid loss and are not suitable for every investor. Costs and charges apply to each leg and vary by account and venue; check the applicable rates before entering any position.
If the market recovers
The following structures are illustrative only - not trade recommendations.
A recovery after a spike usually comes with falling implied volatility. That works against bought options: a call can lose value even while the index rises, if the fall in implied volatility outweighs the gain from the rise. Structures that sell one option against another are less exposed to that effect, at the price of a capped gain.
- Call debit spread. A call is bought and a higher-strike call is sold, so the sold call offsets part of the effect of falling volatility. Maximum loss: the net premium paid.
- Put credit spread. A put is sold below the market and a lower-strike put is bought. The premium is kept if the index stays above the sold strike. Maximum loss: the distance between the strikes minus the premium received.
In the history above, the index often dipped below its spike-day close within a week, even in many of the cases that finished the week higher. Entering in parts, instead of all at once, may limit the damage if the recovery fails; it does not remove the risk of loss.
Options carry a high risk of rapid loss and are not suitable for every investor. Costs and charges apply to each leg and vary by account and venue; check the applicable rates before entering any position.
Assignment risk note: Options on shares and exchange-traded funds are American-style, so sold options can be assigned before expiry once they are in the money, particularly close to expiry or around ex-dividend dates. Options on the S&P 500 index itself are European-style and settled in cash; options on S&P 500 futures and on S&P 500 exchange-traded funds are American-style.
Final thoughts
None of the three outcomes can be ruled out. Earlier spikes were often followed by a firmer week and usually did not mark the low, and the one close precedent for the current sequence, 2022, went on to a much deeper decline.
Options do not resolve that uncertainty, but defined-risk structures can fix the maximum loss in advance, and that is easier to arrange before the next move than during it. In our view, writing down what would be done in each case, at which levels and in what size, may matter more than choosing the right scenario. Options carry a high risk of rapid loss and are not suitable for every investor.
The author holds positions related to the indices discussed in this article.
| Related articles/content |
|---|
| US midterms the market ended close to where it started after a week of sharp swings | 5 Nov 2026 Five earnings reports later what the options priced and what the shares did | 4 Nov 2026 Finding unusually expensive or cheap options in the Saxo screener | 18 Sep 2026 Implied volatility rank what it measures and what it misses | 11 Sep 2026 Nine prints later what Q2 earnings season taught us | 11 Aug 2026 What IV crush really means in practice reviewed version | 9 April 2026 Trading earnings with defined | 31 Mar 2026 |
| More from the author |
|---|