
Un seul compte Saxo suffit pour accéder à nos plateformes.

Finding unusually expensive (or cheap) options in the Saxo screener
Options

Résumé: Bayer’s options were pricing twice the movement its shares had delivered, yet sat near the bottom of their own year. Expensive or cheap? A quick screener check answers that, if the right columns are read together.
Expensive compared with what? For options, the only fair comparison is the stock’s own history.
Traders often want to know where options are expensive, because that shapes whether collecting premium or paying it looks better compensated. The obvious answer, sorting by implied volatility, mostly returns the same restless names every day. A young growth company will nearly always price more movement than a utility, and that says more about the company than about its options.
The more useful question is whether a stock’s options are expensive for that stock. That is what implied volatility rank measures, and the first part of this series, Implied volatility rank: what it measures, and what it misses, explains how it works. This piece shows how to use it on the Saxo platforms to find candidates, and how to check whether a name that looks expensive really is.
Finding unusually expensive (or cheap) options
In SaxoTrader, the options screener sits under Trading, in the Screener tab. A screen filtered on listed options returns optionable stocks and ETFs, and the columns can be reordered so that implied volatility, historical volatility, IV rank and IV percentile sit side by side, with the earnings date close by. Saving that layout as a personal screener makes the view available with one click at the start of each session.
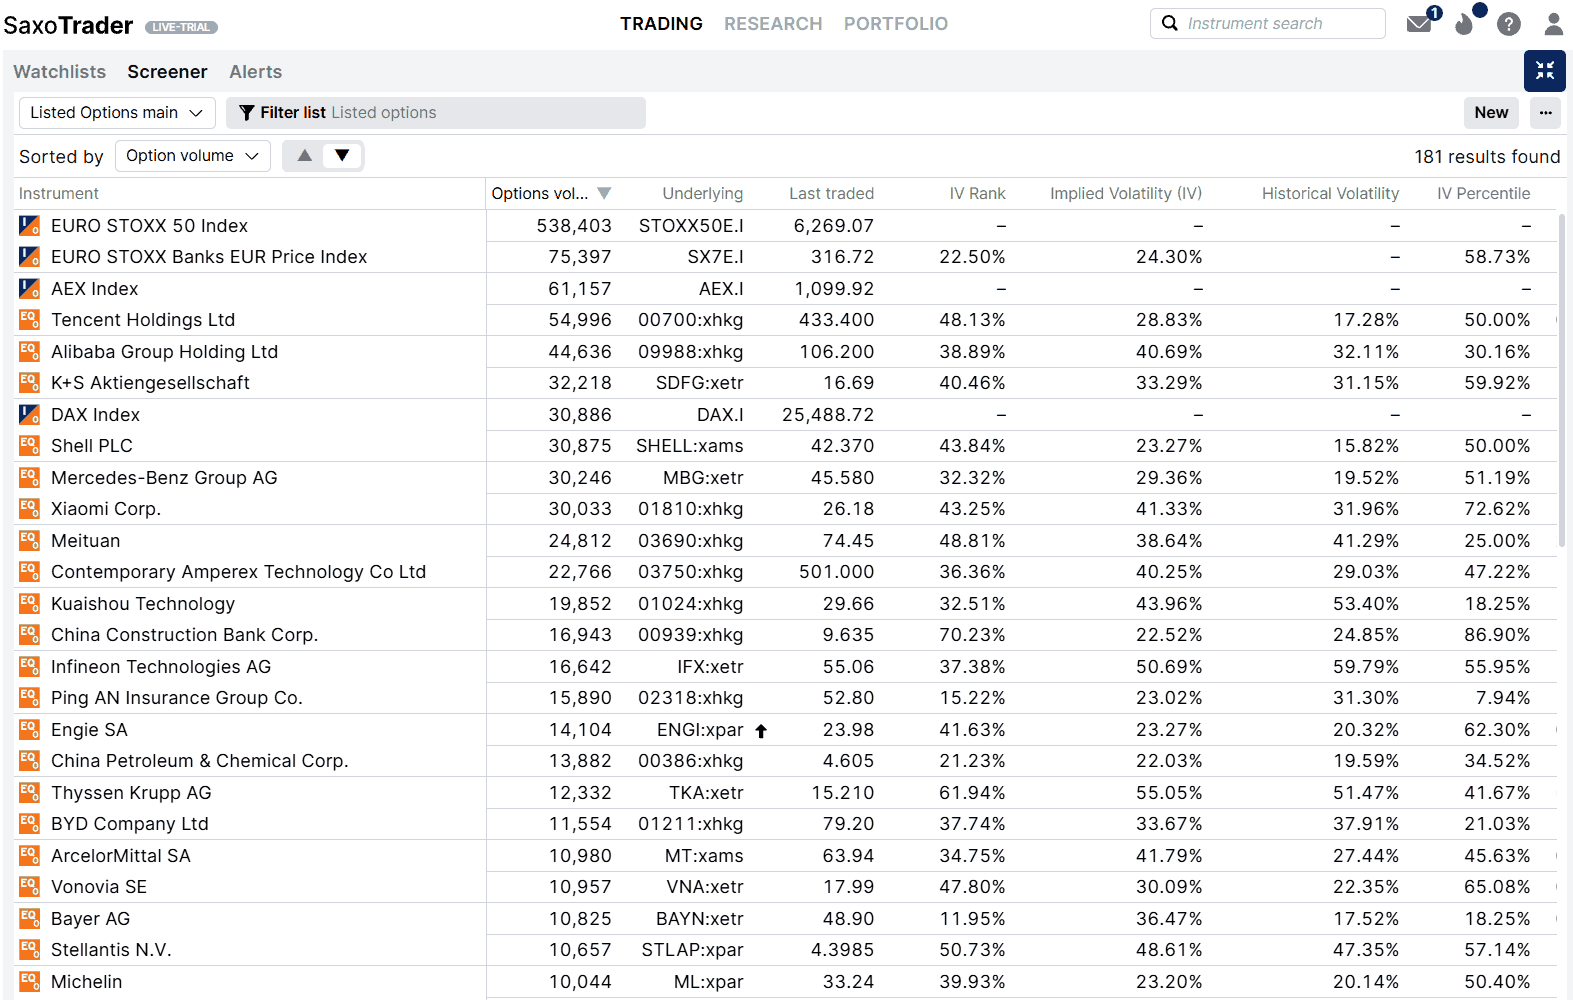 A saved options screen with a custom column layout, 16 September 2026 at 15:30 CET, shortly before the US open. This image is illustrative and for educational purposes only; it is not predictive. Source: SaxoTrader
Past performance is not indicative of future results; figures are illustrative and not predictive.
Important note: The strategies and examples provided in this article are purely for educational purposes. They are intended to assist in shaping your thought process and should not be replicated or implemented without careful consideration. Every investor or trader must conduct their own due diligence and take into account their unique financial situation, risk tolerance, and investment objectives before making any decisions. Remember, investing in the stock market carries risk, and it’s crucial to make informed decisions.
Finding the candidates
Sorting the list by IV rank does the first pass. Names near the top have option pricing close to the high end of their own 52-week range. Names near the bottom are pricing close to their own lows. Both ends can be interesting, depending on whether a trader is looking to collect premium or to pay for it.
Timing matters. Sorted by option volume before the US open, the list fills with European and Asian names, because US trading for the day has not started. Sorting by IV rank avoids that, and a second look after 15:30 CET brings the US session into view.
A high rank is a candidate, not a conclusion. Two quick checks, both on the same row, decide whether it deserves more attention.
Checking whether expensive really is expensive
Check one: is the rank telling the whole story? IV percentile uses the same year of data but counts days instead of measuring distance. When the two disagree, an unusual high or low is usually stretching the range, and percentile tends to be the better guide to how today compares with a normal day. The four combinations are summarised below.
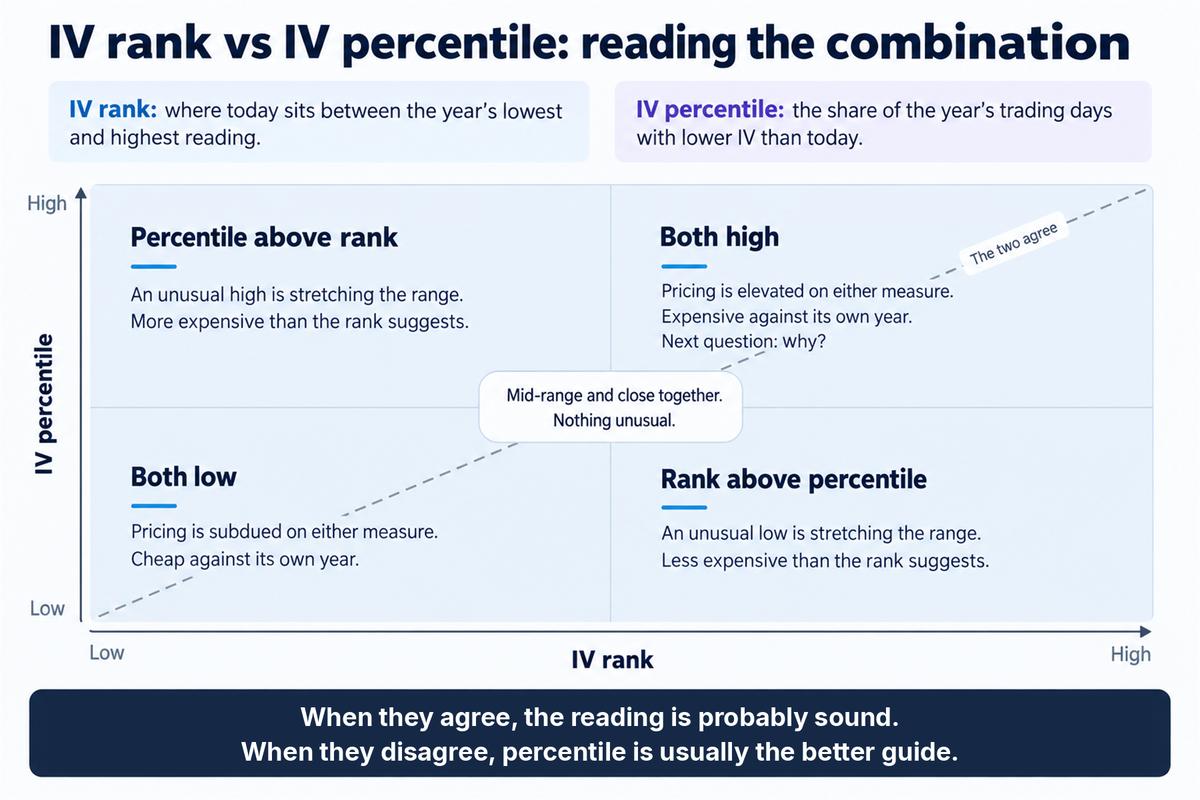 How to read IV rank and IV percentile together. Illustrative and for educational purposes only; not predictive. Source: Saxo
Check two: expensive compared with what the stock is doing? Implied volatility is what option buyers are paying for. Historical volatility is how much the stock has actually been moving. When implied sits well above historical, the market is charging for more movement than it has recently seen. That may reflect something coming, or simply rich pricing. The two columns may not cover the same time window, so in our view this works as a rough gauge rather than a precise measure.
What the row cannot answer. The screen gives one reading per underlying, so it cannot show which expiry holds the premium or why it is there. A report date inside the trader’s window often explains an elevated reading on its own. The listing matters too. HSBC appears in the screener through its Hong Kong line with a rank of 38.24, while its US-listed ADRs carried a rank of 26.05 the same afternoon (Source: Saxo platform, 16 September 2026).
Three names, three answers
Three example rows from the above screener-screenshot show how differently the question can resolve (Source: SaxoTrader screener, 16 September 2026, 15:30 CET). These readings are used for educational purposes only; they are not advice or trade recommendations.
- Bayer (BAYN): implied volatility 36.47%, historical volatility 17.52%, rank 11.95, percentile 18.25
- Thyssenkrupp (TKA): implied volatility 55.05%, historical volatility 51.47%, rank 61.94, percentile 41.67
- Lenovo (00992, Hong Kong): implied volatility 62.16%, historical volatility 26.00%, rank 52.01, percentile 78.57
Bayer: cheap by its own history, expensive against its movement. Rank and percentile both place its option pricing near the bottom of the past year. Yet the options are pricing roughly twice the movement the shares have recently delivered. In our view the answer here is “it depends on the yardstick”, which is a reason to look at the expiries before drawing a conclusion.
Thyssenkrupp: looks expensive, probably less so. A rank of 61.94 would place it among the candidates, but percentile shows pricing was higher than today on most sessions of the past year. Implied and historical volatility sit close together, so the options appear to be pricing roughly what the stock has been doing.
Lenovo: expensive on both checks, and more than the rank shows. Percentile at 78.57 says pricing has rarely been this high over the year, while a rank of 52.01 only places it mid-range, which points to an earlier spike setting the ceiling. Implied volatility is also more than double historical volatility. The screen answers “expensive” clearly; it does not say why.
Past performance is not indicative of future results; figures are illustrative and not predictive. Options carry a high risk of rapid loss and are not suitable for every investor.
Making it a habit
In our view the scan works best as a short look at the start of each session rather than a planning exercise: sorting by rank, running the two checks on anything that stands out, noting the earnings date, and taking the few remaining names to the option chain. Term structure, skew and bid/ask spreads decide whether a reading is usable, and the screener shows none of them.
The screen shows today’s readings only, and ranks can move several points within days, so yesterday’s candidate may not be today’s. Major index rows, such as the DAX, show no readings; an ETF tracking the index can serve as the proxy. A flagged row is a prompt for analysis, not a signal, and options carry a high risk of rapid loss.
Building a custom view
The same implied volatility, rank and percentile figures are available through Saxo’s OpenAPI, for traders who want to pull them into their own tools, for instance to keep a daily record of how a rank has moved. We will cover that route in the webinar Using AI and OpenAPI to elevate your Saxo platform experience on 4 November 2026 at 13:00 CET.
Final thoughts
Whether options are expensive has no absolute answer. A 36% implied volatility was near the floor of Bayer’s year on 16 September and would count as high for many large, steady companies. Sorting by rank and checking each candidate against its percentile and its recent movement gives a first answer that is relative, quick and consistent from one day to the next.
It remains a first answer. The screener can say that a stock’s options are unusually expensive or cheap. It cannot say whether that is justified, which expiry carries it, or what a trader should do about it. Those questions still belong to the chain, the calendar and the trader’s own view.
Options carry a high risk of rapid loss and are not suitable for every investor.
Past performance and historic volatility readings are not a reliable indicator of future results.
The author does not hold positions in any of the instruments named in this article.
| Related articles/content |
|---|
| Defined risk is not small risk what the contract multiplier decides | 12 Aug 2026 DRAM the memory boom now has an option chain Here is how to read it | 4 Aug 2026 What IV crush really means in practice reviewed version | 9 April 2026 Trading earnings with defined | 31 Mar 2026 Disney high rank cheap event | 3 Aug 2026 Selling the expected move a Novo Nordisk earnings case study | 3 Aug 2026 Rheinmetall how to use options on a share that costs EUR 1139 | 31 July 2026 SpaceX earnings pricing a first print with no history | 30 July 2026 -- Rate vol clears equity vol doesnt - Options Brief - 17 September 2026 |
| More from the author |
|---|