
Un seul compte Saxo suffit pour accéder à nos plateformes.

US midterms: the market ended close to where it started, after a week of sharp swings
Options

Résumé: On the day after the US midterms the S&P 500 rose more than options had priced, yet it ended the week close to where it started. A scorecard of last week’s examples shows why the exit plan may have mattered more than the vote.
Options priced a calm election week, and the index did end it close to flat, but only after some large swings on the way.
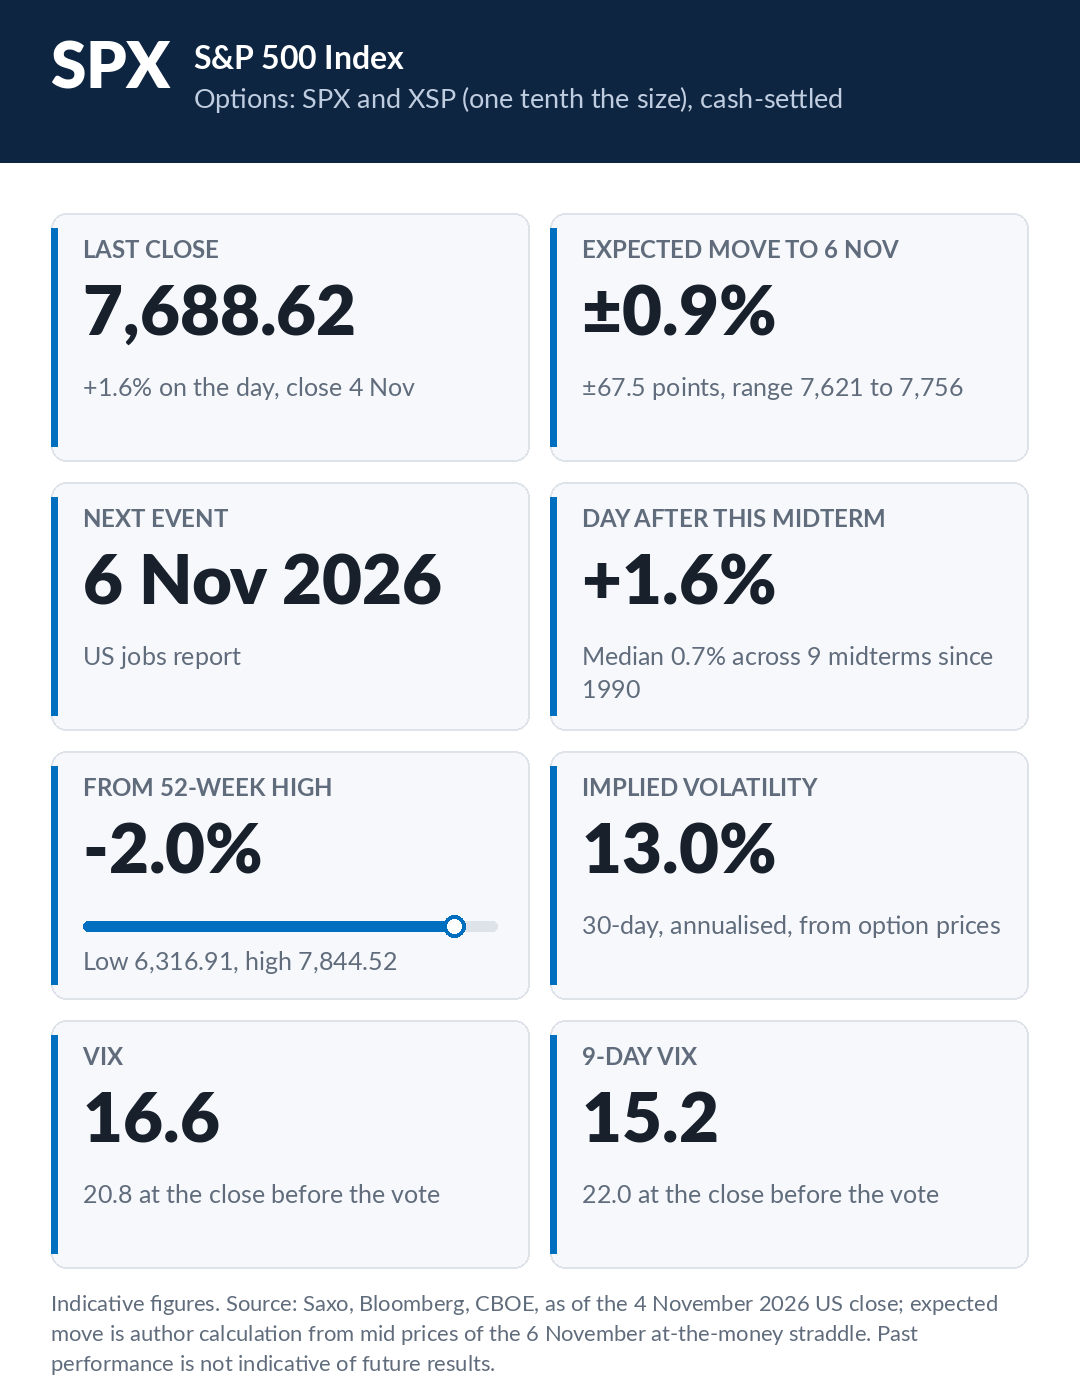 Key information on the S&P 500. Indicative figures. Source: Saxo, Bloomberg, CBOE, as of 4 November 2026. Past performance is not indicative of future results.
Last week’s article asked whether options were right to price the US midterms as a quiet event. Most votes are now counted, and the answer is mixed.
The Associated Press projected the result most had expected: Democratic control of both the House and the Senate. The market’s first reaction on Wednesday was bigger than an ordinary day, yet over the full week the index ended close to its starting point. In between, it swung hard. In our view, that gap between the finish and the journey is the most useful lesson for an options trader.
Important note: The strategies and examples provided in this article are purely for educational purposes. They are intended to assist in shaping your thought process and should not be replicated or implemented without careful consideration. Every investor or trader must conduct their own due diligence and take into account their unique financial situation, risk tolerance, and investment objectives before making any decisions. Remember, investing in the stock market carries risk, and it’s crucial to make informed decisions.
What the vote delivered
The Associated Press projected Democratic control of the Senate late on election night and of the House early on Wednesday. Two Senate races, Alaska and Mississippi, were still being counted on Wednesday. This was the outcome prediction markets had seen as most likely, so in our reading much of it was already in prices.
How the index reacted
On Wednesday the S&P 500 rose about 1.6%, more than options had priced for election day and more than double the typical day after a midterm. It was still smaller than the moves after the previous two midterms. Earnings, lower oil prices and lower bond yields were part of the day as well, so not all of it can be put down to the election. Source: Saxo, Bloomberg, CBOE. Past performance is not indicative of future results.
Over the whole stretch from last Thursday’s close to Wednesday’s close, the index slipped only slightly, well inside the range the options had priced. Looking only at the start and the finish, the week would seem quiet.
The path through the week
The index fell sharply on the day last week’s article was published, slipped again on Monday and recovered only a little on election day. Volatility rose with it: the VIX climbed into the low twenties before election day, then dropped back below where it had started once results were known (Source: Saxo, Bloomberg, CBOE).
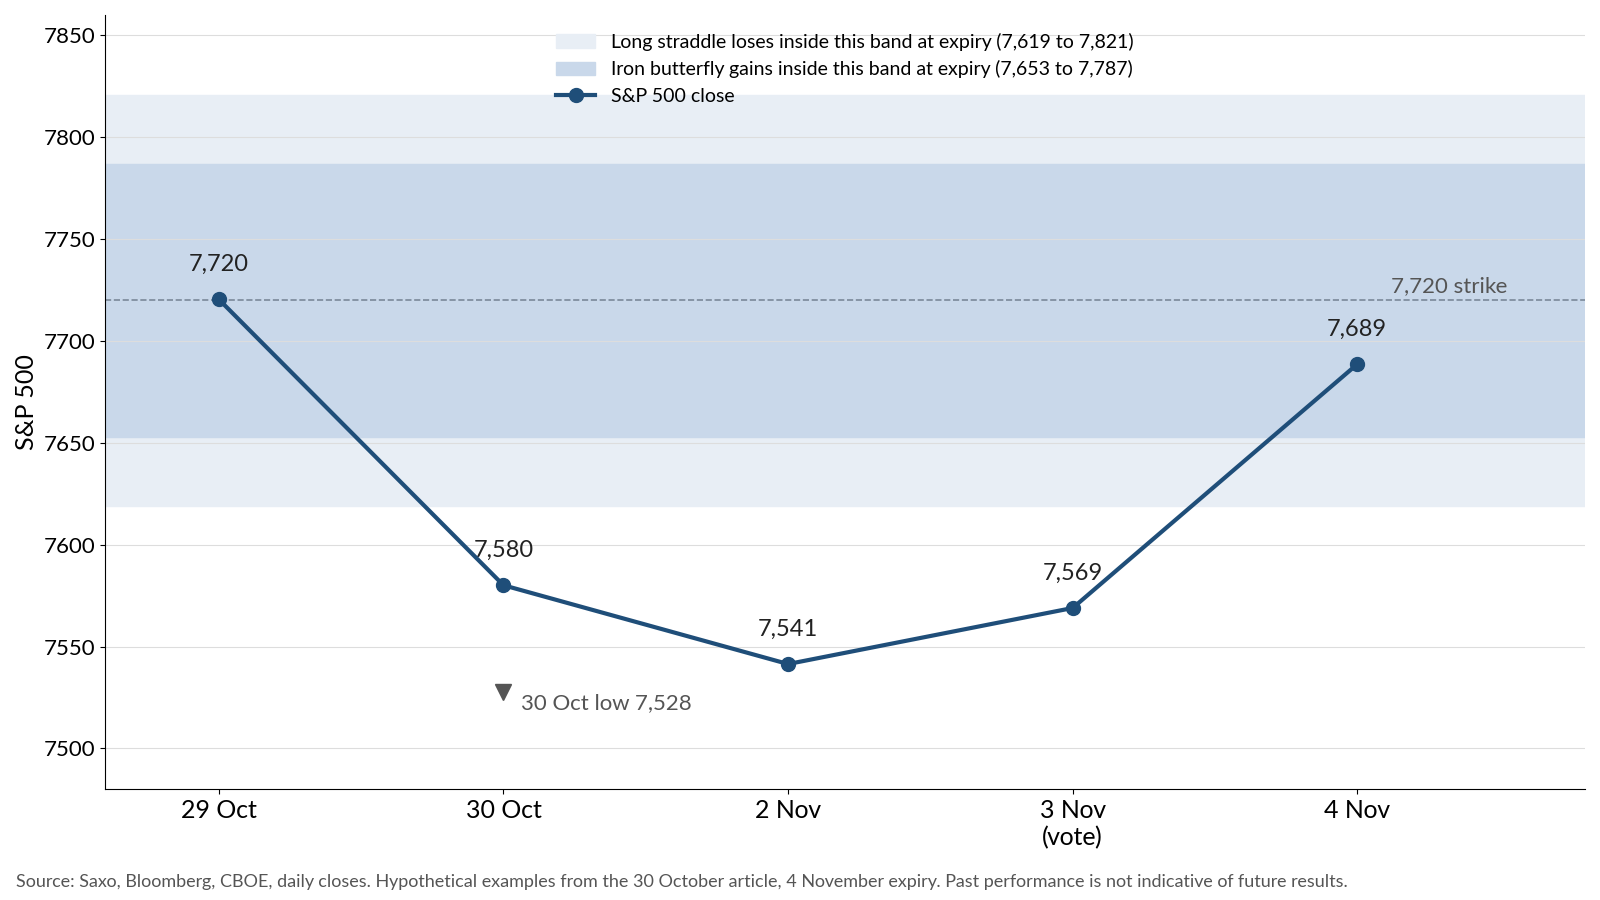 S&P 500 daily closes from 29 October to 4 November 2026, with the intraday low on 30 October and the expiry ranges of the two hypothetical 4 November examples marked. Past performance is not indicative of future results; figures are illustrative and not predictive. Source: Saxo, Bloomberg, CBOE.
In our view, the options were broadly right about the destination and wrong about the trip, and that gap appears to be where last week’s examples parted ways.
Scorecard: last week’s hypothetical examples at Wednesday’s close
The following examples are illustrative only - not trade recommendations.
The two 4 November examples expired at Wednesday’s close, with the index at 7,688.62; the put spread runs to Friday. These figures are hypothetical: they are not actual trades and not a track record. They use the indicative quotes from last week’s article, before costs, and actual fills would have differed.
Iron butterfly, 7,620 / 7,720 / 7,820 (credit 67.00 points)
- At expiry only the 7,720 put had value, about 31.38 points
- Result: a gain of about USD 3,562 per contract (hypothetical, before costs, for education only)
- Maximum possible gain: USD 6,700 (hypothetical, for education only)
- Maximum possible loss: USD 3,300 (hypothetical, for education only)
- Along the way: at Tuesday’s close, before results were known, it was worth about 83 points against the 67.00 collected, an open loss of about USD 1,600 (hypothetical, for education only)
Long straddle, 7,720 call and put (debit 100.90 points)
- At expiry the straddle was worth the same 31.38 points as the put
- Result: a loss of about USD 6,952 per contract (hypothetical, before costs, for education only)
- Maximum possible loss: USD 10,090 (hypothetical, for education only)
- Maximum possible gain: not capped (hypothetical, for education only)
- Along the way it showed a large open gain, covered in the next section
Put spread, 6 November, 7,625 / 7,525 (debit 20.15 points)
- Still open until Friday; at Wednesday’s close it was worth about 9.30 points at mid, an open loss of about USD 1,085 per contract (hypothetical, for education only)
- At Tuesday’s close, before results were known, it was worth about 46 points, more than double its cost, an open gain of about USD 2,600 (hypothetical, for education only)
- Maximum loss: USD 2,015 until Friday’s expiry (hypothetical, for education only)
- Maximum payout: USD 7,985 until Friday’s expiry (hypothetical, for education only)
Source: Saxo, Bloomberg, CBOE, closing prices and settlement on 4 November 2026; author calculation. Past performance is not indicative of future results. Options carry a high risk of rapid loss and are not suitable for every investor. Costs and charges apply to each leg and vary by account and venue; check the applicable rates before entering any position.
Where the profit targets made the difference
Last week’s article illustrated a profit target for each example: the straddle once it was worth about 50% more than it cost, and the butterfly once about a quarter of its maximum profit was in hand. In hindsight, and in our view, those targets may have mattered more than the outcome of the vote.
The straddle reached its target on the afternoon the article was published, when the index fell sharply, and it was still above it at Tuesday’s close, before results were known. On these hypothetical figures, a position closed at the target would have shown a gain of about USD 5,045 per contract before costs instead of the loss at expiry, while the full USD 10,090 debit remained at risk until it was closed (hypothetical, for education only). No actual trade was placed, and real fills, spreads and costs would have reduced that figure. A position held to expiry needed the move to still be there at Wednesday’s close, and it was not.
The butterfly’s target came only on Wednesday, as the election premium drained out of the options. Before that it spent most of the week showing a loss. Holding a short-premium position through that stretch requires the risk to be sized so the open loss can be carried, since the full maximum loss of USD 3,300 per contract applied right up to expiry (hypothetical, for education only).
One week is a single example, not evidence, and the same targets could have cost money in a different week. Past performance is not indicative of future results. Options carry a high risk of rapid loss and are not suitable for every investor. Costs and charges apply to each leg and vary by account and venue; check the applicable rates before entering any position.
What the options price now
At Wednesday’s close, the options expiring on Friday priced a move of about 0.9% either way, and that window includes the US jobs report on Friday. Thirty-day implied volatility was back to about where it stood before the election premium built up (Source: Saxo, Bloomberg, CBOE). In our view, the market appears to be treating the election as settled business, with the focus moving back to data and earnings. Options carry a high risk of rapid loss and are not suitable for every investor.
Final thoughts
On AP projections the midterms went the way most expected, and the index finished close to where it began. In our view, the options priced that finish reasonably well. They did not appear to price the swings along the way, and those swings decided whether last week’s hypothetical examples showed a gain or a loss.
For a trader, the takeaway may be to plan the exit before the event. Whether any structure fits depends on the reader’s view, risk tolerance and live prices. Options carry a high risk of rapid loss and are not suitable for every investor.
The author does not hold positions in any of the instruments mentioned in this article. The Author is permitted to wait at least 24 hours from the time of the publication before they trade the instruments themselves.
| Related articles/content |
|---|
| Five earnings reports later what the options priced and what the shares did | 4 Nov 2026 US midterms the options market expects a quiet Wednesday What if it is wrong | 30 Oct 2026 Finding unusually expensive or cheap options in the Saxo screener | 18 Sep 2026 Implied volatility rank what it measures and what it misses | 11 Sep 2026 Nine prints later what Q2 earnings season taught us | 11 Aug 2026 What IV crush really means in practice reviewed version | 9 April 2026 Trading earnings with defined | 31 Mar 2026 |
| More from the author |
|---|