
Un seul compte Saxo suffit pour accéder à nos plateformes.

Amazon into earnings: choosing a structure when the move is already priced
Options 10 minutes to read

Résumé: Amazon reports on 30 July, and the options market has already named its price for the move. The question is which structure survives if that estimate turns out to be wrong.
The hard part of an earnings trade is rarely the direction. It is working out what a view actually commits the trader to.
Amazon.com (AMZN) reports second-quarter results after the US close on Thursday 30 July 2026. Cloud growth at Amazon Web Services, margin progress across retail and advertising, and the scale of AI capital spending all land in the same print, and each can surprise on its own.
Ahead of an event like this, implied volatility on the expiries that capture the report sits well above the levels priced for later ones. That gap is the event premium, the market’s charge for carrying uncertainty through a known date, and it collapses once the result is public whichever way the stock goes.
This article argues for no direction and deliberately avoids specific strikes and prices. The aim is the reasoning that comes first.
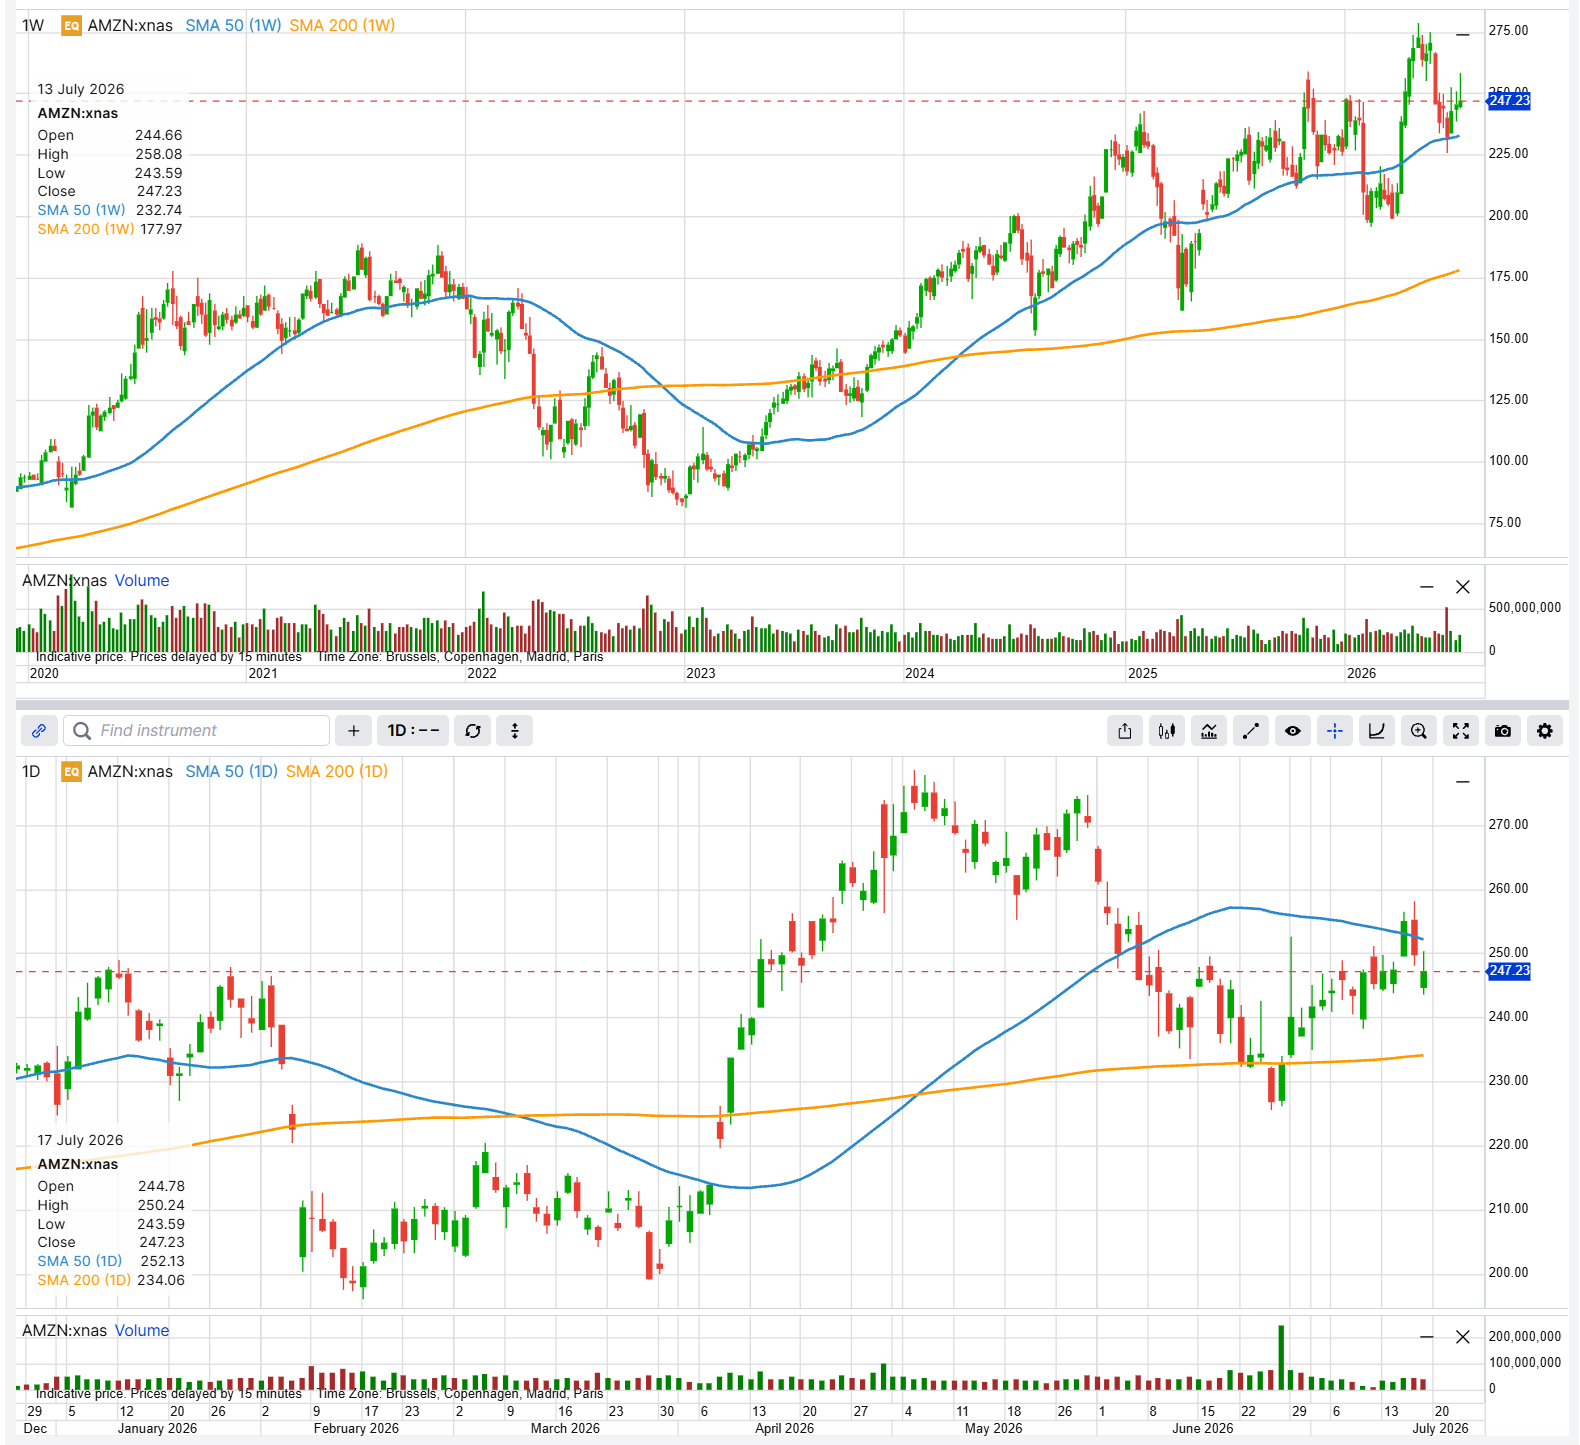 Amazon.com (AMZN) weekly (top) and daily (bottom) charts with 50-period and 200-period moving averages, as of the 17 July 2026 close. Source: SaxoTrader. This chart is illustrative and for educational purposes only; it is not predictive. Past performance is not indicative of future results; figures are illustrative and not predictive.
Four questions before choosing a structure
Is implied volatility rich or cheap relative to how this stock actually moves? The comparison that matters is not whether implied volatility looks high on its own, but whether the priced move is larger than what the stock has typically delivered on past reports. On large, widely held names it frequently is, though this varies by name and by volatility regime.
Direction, or only magnitude? A directional view supports structures that lean one way. A view only on magnitude, whether the move will be unusually large or unusually contained, points to structures built around a range.
Which side of the volatility collapse am I on? Long premium fights the post-event drop in implied volatility. Short premium is paid by it. In our view this may often separate a trader who reads direction correctly from one who also makes money.
Is my risk defined, and what am I giving up to define it? A protective wing costs premium and narrows the profit. Leaving risk undefined is cheaper at entry and, in our view, rarely worth it through a binary event.
Past performance is not indicative of future results. Future outcomes are uncertain and may result in losses.
Important note: The strategies and examples provided in this article are purely for educational purposes. They are intended to assist in shaping your thought process and should not be replicated or implemented without careful consideration. Every investor or trader must conduct their own due diligence and take into account their unique financial situation, risk tolerance, and investment objectives before making any decisions. Remember, investing in the stock market carries risk, and it’s crucial to make informed decisions.
Bullish view: the quarter is rewarded
The question is not which bullish structure exists, but which suits an environment where premium is expensive and about to get cheaper.
The following examples are hypothetical and for educational use only; they are not advice or trade recommendations.
- Bull call spread. Buys a call and sells a higher-strike call to cut the cost, so both legs lose value in the volatility collapse and partly offset one another. Best case: the stock closes at or above the higher strike, and the gain is the gap between the two strikes less the premium paid. Worst case: the entire premium paid is lost, and nothing beyond it.
- Bull put spread. Sells a put and buys a lower-strike put beneath it, so the position takes money in at the start rather than paying it out, and it may profit if the stock rises or simply goes nowhere. Best case: the stock stays above the higher put strike and the full credit is kept, which is all this structure can make. Worst case: it falls through both strikes and the loss is the gap between them less that credit, usually several times the amount taken in.
- Call broken-wing butterfly. Combines a narrow long call spread with a wider short spread above it, and can often be opened for a credit, which removes any loss if the stock falls. Best case: the stock drifts up to around the middle strikes, paying the credit plus the width of the narrow spread. Worst case: a strong rally past the top strike, where the loss is capped at the difference between the two wing widths less the credit.
- Risk reversal. Sells a put to finance buying a call, giving close to outright upside exposure at little or no net cost. Best case: the stock rallies and the position captures close to what owning the shares would have paid, without much cash tied up. Worst case: the loss can be very large. The short put obliges the holder to buy the stock if it falls, so the downside behaves much like owning the shares outright and is effectively open-ended rather than capped. This is a structure for high conviction only.
Costs and charges apply to each leg; see Saxo pricing for full details.
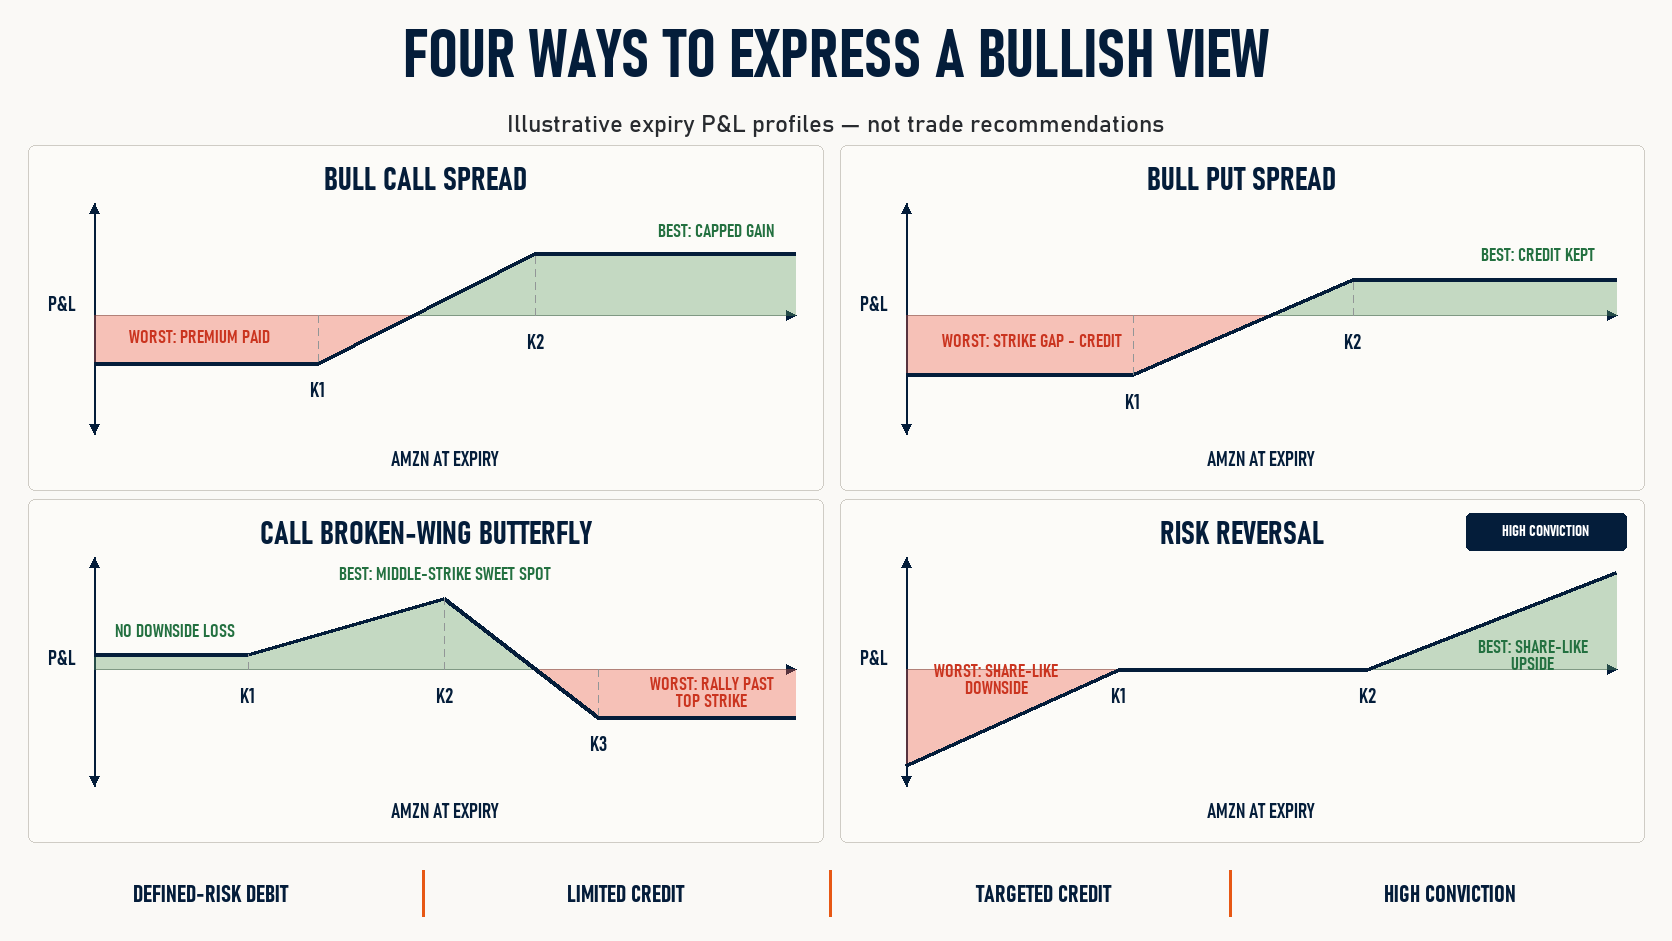 Illustrative expiry P&L profiles for four ways to express a bullish view, using generic strikes K1 to K3 rather than live levels. Illustrative only, not trade recommendations. This chart is illustrative and for educational purposes only; it is not predictive. Past performance is not indicative of future results; figures are illustrative and not predictive.
Choosing between them comes back to the third question. The call spread pays premium into an inflated market; the put spread and the butterfly collect it. When implied volatility is elevated into a print, in our view the credit structures may express the same view more efficiently, though they cap the upside sooner and the loss arrives faster when the view is wrong. Options carry a high risk of rapid loss and are not suitable for every investor. See Saxo pricing for costs and applicable charges.
Bearish view: the spending bill weighs
If guidance disappoints, the same logic applies in reverse. Buying protection at the point of maximum premium carries the same headwind as buying upside.
The following examples are hypothetical and for educational use only; they are not advice or trade recommendations.
- Bear put spread. Buys a put and sells a lower-strike put to reduce the outlay. Best case: the stock closes at or below the lower strike, and the gain is the gap between the two strikes less the premium paid. Worst case: the premium paid is lost, and nothing beyond it.
- Bear call spread. Sells a call and buys a higher-strike call above it for protection, taking money in at the start, and it may profit if the stock falls or simply stalls. Best case: the stock stays below the lower call strike and the full credit is kept, which is the ceiling on this trade. Worst case: it rallies through both strikes and the loss is the gap between them less the credit, typically a multiple of the amount taken in.
- Put broken-wing butterfly. The mirror of the bullish version, targeting a zone of downside and often opened for a credit, so a rally costs nothing beyond the opportunity. Best case: the stock falls to around the middle strikes, paying the credit plus the width of the narrow spread. Worst case: a collapse well below the lowest strike, where the loss is capped at the difference between the wing widths less the credit.
- Protective put or collar. A different job, for someone who already owns the shares and wants to carry them through the print. Best case: the stock rises, the gain is kept, and the premium spent on protection that proved unnecessary is the only cost. Worst case: it falls, but the loss stops at the put strike, so what is given up is the drop from the current price down to that strike plus the premium. A collar pays for that protection by selling an upside call, which caps the gain if the stock runs.
Costs and charges apply to each leg; see Saxo pricing for full details.
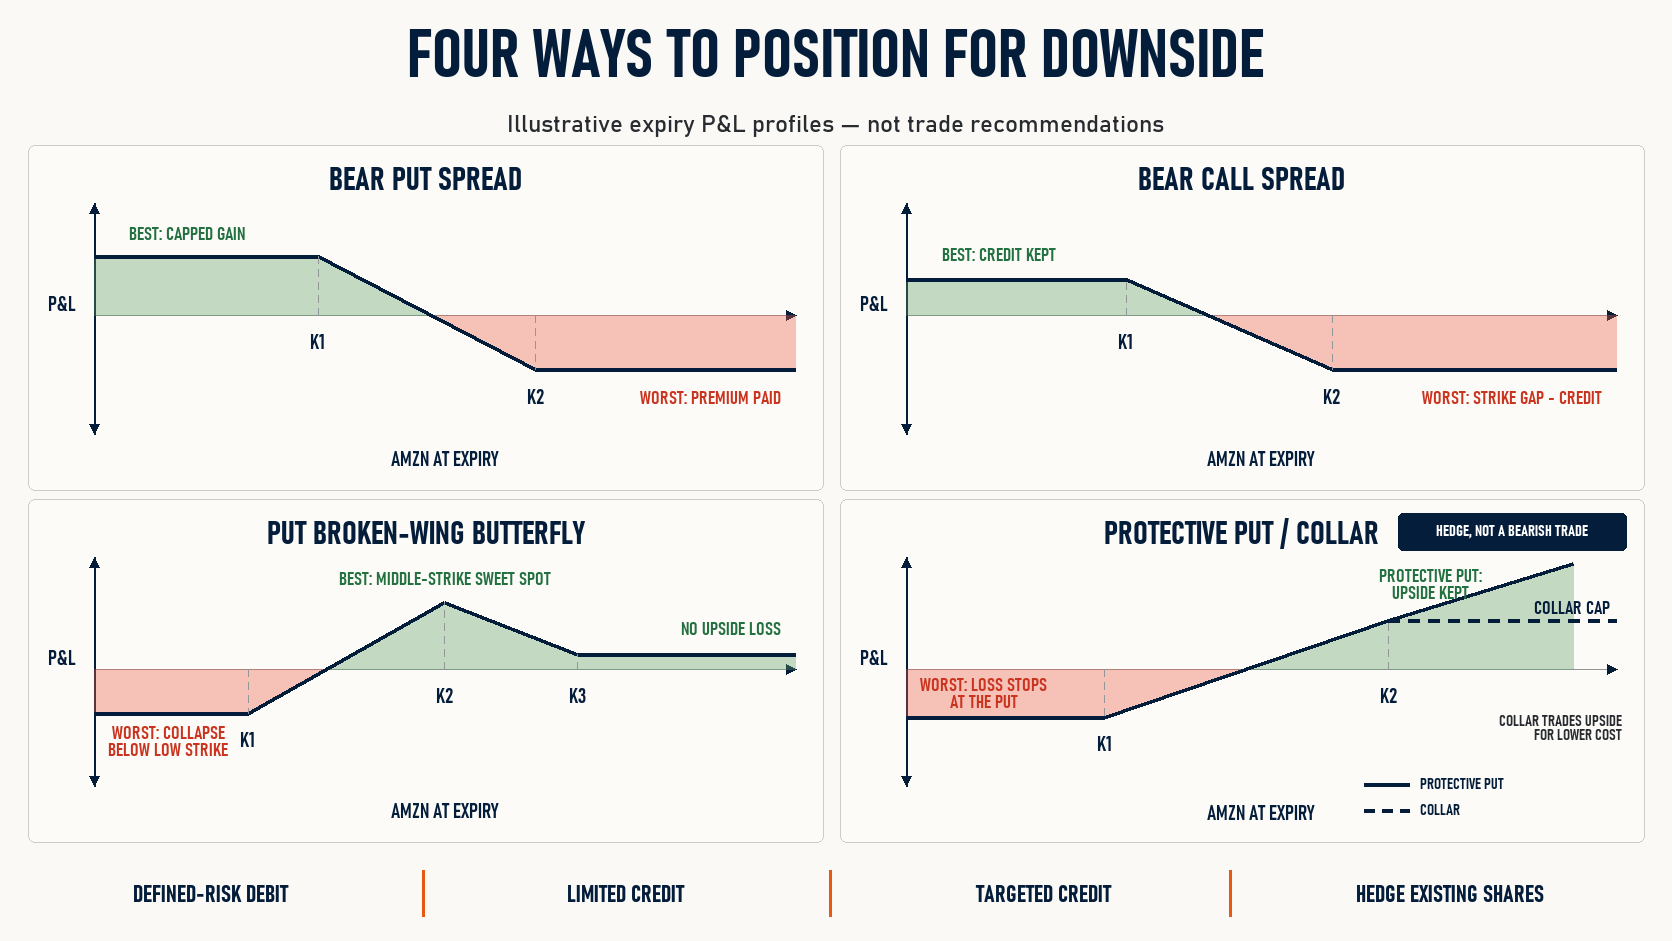 Illustrative expiry P&L profiles for four ways to position for downside. The protective put and collar are shown as hedges for an existing shareholding rather than as bearish trades. Illustrative only, not trade recommendations. This chart is illustrative and for educational purposes only; it is not predictive. Past performance is not indicative of future results; figures are illustrative and not predictive.
The first three express a bearish opinion. The fourth expresses a wish to keep a holding through the print, which is a materially different decision. In our view a bearish view held with no underlying position and one held against stock may deserve different structures, and conflating them is a common way to end up with a position that does neither job well. Options carry a high risk of rapid loss and are not suitable for every investor. See Saxo pricing for costs and applicable charges.
Direction-neutral view: the move matters more than the direction
The instinctive choice without a directional view is to buy a straddle or strangle and let the stock go where it likes. On a large-cap name that is, in our view, usually the hardest way to make money. The premium is at its most expensive precisely because the event is imminent, the position needs a move larger than the stock has typically delivered just to reach break-even, and the volatility collapse starts the moment the result is public. Being right on direction is not enough when the move also has to be big enough.
For many traders that points to the other side of the same question.
The following examples are hypothetical and for educational use only; they are not advice or trade recommendations.
- Short iron butterfly. Sells a call and a put at the same near-the-money strike and buys a wider call and put around them, collecting the largest credit of the range-based structures. Best case: the stock finishes close to the short strike and the full credit is kept, which is the most it can make. Worst case: it runs past either wing and the loss is the distance from the short strike out to that wing less the credit, usually a multiple of the amount taken in.
- Short iron condor. Sells an out-of-the-money call spread and an out-of-the-money put spread, giving a wider zone in which it may profit in exchange for a smaller credit than the butterfly. Best case: the stock stays between the two short strikes and the full credit is kept. Worst case: it closes beyond either long strike and the loss is the width of the wider spread less the credit.
- Calendar spread. Sells a shorter-dated option and buys a longer-dated one at the same strike, monetising the gap between elevated near-term implied volatility and the calmer levels priced further out. It is typically net long vega, so a broad fall in implied volatility across the whole curve can work against it even while time decay helps. Best case: the stock sits near the strike when the short-dated leg expires and the longer-dated one holds enough value to leave a profit, though that profit is model-dependent, not fixed at entry, and depends on where implied volatility settles. Worst case: the net amount paid to open it is lost.
- Long straddle. Buys a call and a put at the same strike, and may profit if the stock moves far enough either way. Best case: a very large move in either direction, where the gain has no fixed ceiling. Worst case: the stock finishes near the strike and the entire premium is lost, which ahead of an event like this is a substantial amount to put at risk. It earns its place when a trader expects a move well beyond the name’s usual reaction, or on a stock with a history of overshooting what the market prices.
Costs and charges apply to each leg; see Saxo pricing for full details.
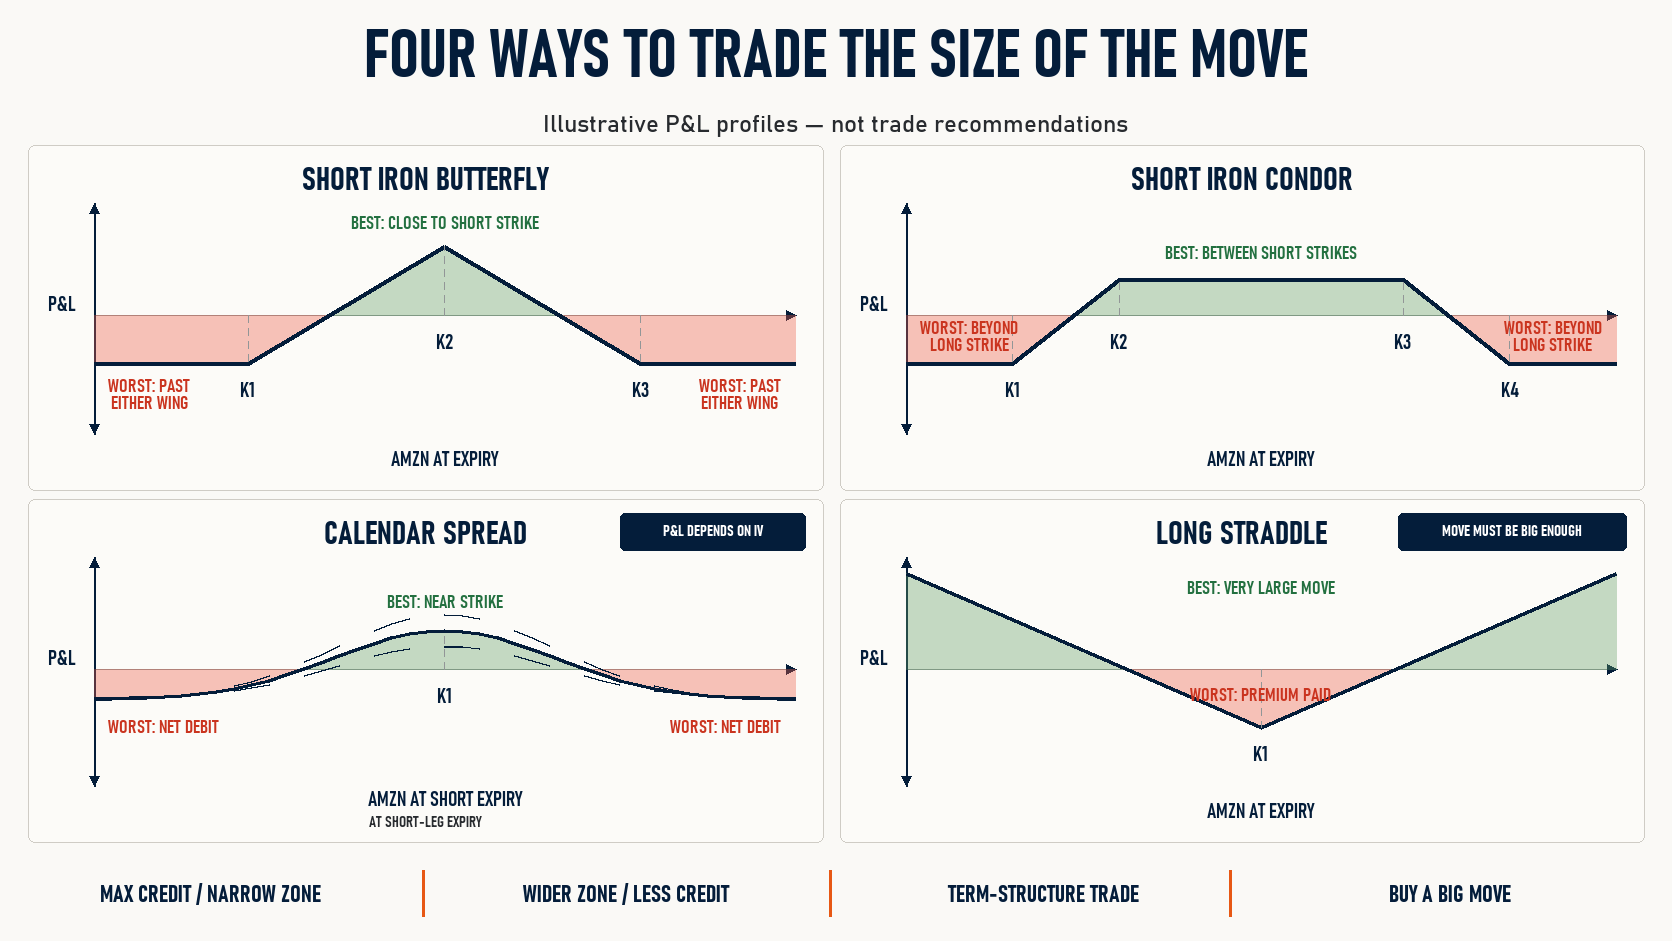 Illustrative P&L profiles for four ways to trade the size of the move. The calendar spread profile is model-dependent and is shown at the short-leg expiry rather than as a fixed expiry payoff. Illustrative only, not trade recommendations. This chart is illustrative and for educational purposes only; it is not predictive. Past performance is not indicative of future results; figures are illustrative and not predictive.
The first two take the other side of the straddle. Rather than paying for a move, they sell the move already priced and use the long wings to define the risk. Both may lose if the stock travels further than the market priced, and that risk is exactly what the credit compensates. The butterfly asks for more precision and pays more for it; the condor is more forgiving and pays less. Options carry a high risk of rapid loss and are not suitable for every investor. See Saxo pricing for costs and applicable charges.
Before placing any trade, check
- Bid and ask spreads widen as legs are added, and a multi-leg structure can lose its theoretical edge at entry
- Volume and open interest at the strikes under consideration
- Whether the position is opened before or after the report on 30 July 2026
- Assignment risk, since AMZN options are American-style and short legs can be assigned before expiry if they move into the money
- An exit plan defined before entry, including the level at which the view is wrong
Final thoughts
Twelve structures across three views sounds like a lot of choice. In practice the four questions remove most of them quickly, because a trader who knows whether they hold a directional or a magnitude view, and which side of the volatility collapse they want to sit on, has already narrowed the list to two or three.
What remains is a trade-off rather than a right answer. Every structure that caps the loss also caps the gain, and every structure that leaves the gain open leaves something else open too. Selling an expensive move is comfortable until the move arrives, and buying a cheap one is comfortable until it does not.
The options market publishes its estimate of the move well before the print. The useful work is not predicting whether that estimate is wrong, but knowing which structure survives if it is. Options carry a high risk of rapid loss and are not suitable for every investor. Future outcomes are uncertain and may result in losses.
Past performance is not indicative of future results. Market data: Saxo, Bloomberg, CBOE.
The author holds no position in Amazon.com (AMZN) at the time of writing.
This content is marketing material and should not be regarded as investment advice. Trading financial instruments carries risks and historic performance is not a guarantee of future results.
The Author is permitted to wait at least 24 hours from the time of the publication before they trade the instruments themselves.
The instrument(s) referenced in this content may be issued by a partner, from whom Saxo receives promotional fees, payment or retrocessions. While Saxo may receive compensation from these partnerships, all content is created with the aim of providing clients with valuable information and options.
This content will not be changed or subject to review after publication.