Key points:
- A study of two distinct portfolios: We built two portfolios to study how different strategies hold up in volatile markets. Portfolio A was a concentrated growth play with exposures to US tech stocks. Meanwhile, Portfolio B reflected a globally diversified strategy with risks spread across regions, sectors and asset classes.
- Concentration amplified downside risk: The concentrated portfolio lagged with sharp drawdowns, while the diversified one delivered steadier, positive returns through a turbulent first half. Betting on a few tech names led to sharp losses and high volatility, resulting in emotional and financial strain when chasing conviction alone.
- Diversification helped manage risk and stay invested: Balanced exposure across asset classes and regions led to better risk-adjusted returns — proving that resilience is just as important as performance.
Note: This content is marketing material.
The first half of 2025 has been a stress test for investors.
Between Trump’s tariff threats, escalating geopolitical tensions, and conflicting signals from the Fed, markets have been anything but calm.
To understand how portfolio construction affects outcomes in such an environment, we built two sample portfolios — each starting with $10,000 on December 31, 2024 — but with vastly different strategies.
Portfolio A – The concentrated growth play
Portfolio A mirrored a common high-conviction strategy seen in recent years:
- 8 shares each of Meta, Nvidia, and Tesla bought on December 31, 2024
- ~$1,000 in cash reserves
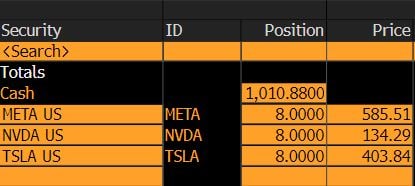
This allocation was tilted toward megacap growth stocks, all of which had benefited from the AI boom and tech momentum of 2023–2024. But in 2025, the narrative shifted. Tariff risks, valuation pressures, and sector rotations made this concentrated bet vulnerable — and painful.
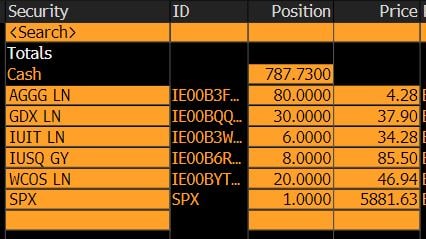
Portfolio B – The diversified core
In contrast, Portfolio B reflected a globally diversified strategy built for all-weather conditions — one that doesn't rely on a single sector or region to perform.
Here’s what it included:
- US equities – SPDR S&P 500 UCITS ETF (SPX):
- Broad exposure to large U.S. companies across sectors — the foundation of many long-term portfolios.
- International equities – iShares MSCI World UCITS ETF (IUSQ):
- Provides exposure to large and mid-cap companies across 23 developed markets. This global diversification reduces reliance on any single country’s economy or stock market.
- Broad technology exposure – iShares S&P 500 Information Technology Sector UCITS ETF (IUIT):
- Offers focused exposure to the U.S. technology sector — but across a broader set of companies beyond just megacaps. It includes software, semiconductors, and services, helping balance tech exposure without being overly concentrated in just a few stocks.
- Fixed Income: iShares Core Global Aggregate Bond UCITS ETF (AGGG):
- A globally diversified bond ETF that includes government and corporate bonds across currencies and geographies. It adds income and stability, especially during equity market selloffs.
- Gold Miners: VanEck Gold Miners UCITS ETF (GDX):
- Invests in global gold mining companies. It tends to benefit from rising gold prices, which often happen when inflation rises or geopolitical tensions increase — making it a useful hedge in uncertain times.
- Consumer Staples: iShares MSCI World Consumer Staples Sector UCITS ETF (WCOS):
- Includes companies that produce everyday essentials — like food, drinks, and household goods. These stocks tend to be more resilient in economic downturns due to stable demand.
- Cash (~$800):
- A small reserve to stay flexible. Having "dry powder" allows investors to add to positions during dips or meet short-term needs without selling at the wrong time.
This portfolio spread risk across regions (U.S. and global), sectors (growth, defensive, inflation-sensitive), and asset classes (stocks, bonds, gold, cash) — giving it the balance that helps absorb shocks and reduce emotional decision-making through volatility.
What happened next: January to May 2025
From January to May, macro conditions turned increasingly fragile. Markets were whipsawed by:
- Tariffs went on and off, with Trump’s Liberation Day announcement followed by a pause — spurring volatility in trade-sensitive sectors.
- Trump’s new tax bill raised concerns over U.S. fiscal sustainability.
- Policy uncertainty in the U.S. resulting in fading of the American exceptionalism.
- Uncertainty over Fed rate cuts, as inflation data proved stickier than expected.
- Escalating tensions in the Middle East, pushing up energy and gold prices.
- Fed independence came under question, adding another layer of policy risk.
In this climate, Portfolio A suffered significantly sharper drawdowns, while Portfolio B weathered the storm with far greater stability.
Performance comparison (Dec 31, 2024 – June 16, 2025)
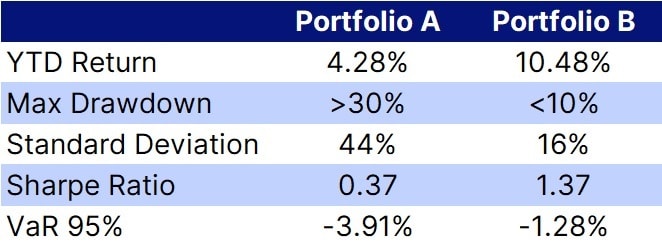
Source: Bloomberg Portfolio Analytics (PRTU)
Let us understand what these metrics tells us:
- Total return: This is how much your portfolio grew or shrank over the period. The diversified portfolio ended up with gains, and outperformed the concentrated one — reminding us that consistency can beat occasional big wins.
- Max drawdown: This shows the biggest temporary dip your portfolio experienced. While both recovered, the concentrated portfolio had a much deeper fall — which can test an investor’s confidence.
- Standard deviation: A measure of how much your portfolio value moves up and down. High volatility means bigger swings, which can be stressful. The diversified portfolio offered a calmer ride.
- VaR (95%): This estimates how much you could lose on a really bad day. It doesn’t mean it will happen — but it helps compare how much risk each portfolio carries.
- Sharpe ratio: This tells you how well the portfolio rewarded you for the risk taken. A higher number means more efficient growth — and the diversified portfolio delivered just that.
Key lessons
Diversification protects against tail risks
Portfolio A delivered big upside during short rallies but couldn’t protect against volatility. Portfolio B’s broader exposure to defensives, bonds, and gold insulated it from the brunt of equity drawdowns — even as risk assets wobbled on macro news.
Volatility is more than just a number
While Portfolio A saw strong upside in brief tech rallies, the day-to-day swings were larger — emotionally and mathematically. Higher standard deviation and VaR translated into a bumpier journey that made staying invested more difficult.
Risk-adjusted returns matter more than raw returns
While headlines often focus on performance, return alone doesn’t reflect portfolio quality. Portfolio B delivered a higher Sharpe ratio, meaning investors got more return for every unit of risk taken.
Strategy takeaway: Build for what you can’t see coming
Volatility is no longer an outlier event — it’s the base case.
Tariffs, geopolitics, elections, inflation, AI regulation — all are part of a more fractured, fast-moving macro backdrop. And in this world, the old playbook of concentrated tech bets is less reliable.
Instead, investors need strategies that diversify across geographies, sectors, and risk factors. That means:
- Blending growth with income
- Hedging with commodities or bonds
- Including exposure to international markets
- Keeping some dry powder in cash
When markets get messy, the portfolio that holds up is the one that’s built to last.