
Access all our platforms from a single account.

Front day drains, Friday fills - Options Brief - 9 September 2026

Summary: The market took almost all the premium out of Wednesday and stacked it onto Friday’s inflation print. Underneath a quiet index, single names moved double digits in both directions.
MARKET REGIME: LOW VOL BULL | VIX 15.72 | TERM STRUCTURE: CONTANGO | SKEW: ELEVATED (148.86) | FRONT-MONTH VIX FUTURES: 18.45
- The front day emptied while the event window filled. VIX1D fell 13.30% to 10.43 as VIX9D rose 23.73% to 14.81, a window that now covers both Friday’s inflation print and next week’s Federal Reserve decision.
- Friday costs more than the clock alone would leave. The 11 September expiry prices 74 points, or 0.96%, against 79 points quoted yesterday for the same expiry, where time decay on its own would have left about 68.
- The index held together on offsetting parts rather than on calm. The S&P 500 fell 0.58% while its equal-weighted version lost 1.08%, with three-month implied correlation down at 9.86 and dispersion up at 34.51.
Vol surface data: Saxo, Bloomberg, CBOE, as of 9 September 2026, approx. 06:27 CET. Past performance is not indicative of future results.
Headline driver
US forces struck five Iranian crude tankers near the Kharg Island export hub, and Tehran answered with missiles fired toward Jordan and warnings to shipping near Kuwait and Bahrain. Houthi militants hit Saudi energy infrastructure the same day. Brent now trades near USD 100 a barrel, with diesel near USD 200.
The equity read was narrower than the headline. Health care carried the losses after Novartis lost 10.9%, its worst session on record, when a late-stage trial failed and dragged Amgen down 10.1% on doubts about the same drug class. Higher energy costs hardened rate-hike expectations into Friday. More in Saxo’s macro coverage and today’s Market Quick Take.
Market snapshot, Tuesday 8 September 2026 close
- US (Tuesday 8 September close): S&P 500 7,673.52, down 0.58%. Dow 52,791.29, down 1.18%. Nasdaq 100 29,507.70, down 0.12%. The equal-weighted S&P 500 lost 1.08%, so the damage sat well below the index line. Qualcomm rose 3.2% on an AI-chip partnership with Amazon, while Corning gained 7.6% and Lumentum 11.0% on a large Verizon fibre order.
- Europe (Tuesday 8 September close): Stoxx 600 649.61, down 0.05%. DAX 26,007.63, unchanged. Euro Stoxx 50 6,413.18, up 0.14%, and the CAC 40 8,317.98, up 0.14%. The SMI lost 1.55% on the Novartis fall. Antofagasta rose 4.7% with record copper and Kion 6.8% on a broker upgrade.
- Asia (Wednesday 9 September session): the Kospi is 7,046.91, up 1.33%, with SK Hynix up 2.7% as the chip rally extended. Japan’s Nikkei is little changed. The Hang Seng sits at 25,316.87, flat, and the CSI 300 at 4,564.42, up 0.12%.
- Commodities and rates: Brent USD 99.27, up 1.38%, and WTI USD 94.04, up 1.09%. Gold futures USD 4,421.60, with spot touching a one-week low near USD 4,341 before recovering toward USD 4,390. Copper eased 1.12% after its record run. The US 2-year yield is 4.400%, less than two basis points below the cycle high, the 10-year 4.796% and the 30-year 5.250%. EURUSD 1.1633, USDJPY 153.33.
- Market regime (rules based read): Low Vol Bull, VIX 15.72, S&P 500 0.99% above its 50-day moving average, with 20-day realised volatility at 8.3% and falling.
Source: Saxo, Bloomberg, CBOE, 9 September 2026, approx. 06:27 CET. Past performance is not indicative of future results.
Options flow sentiment
Based on end-of-day 8 September, yesterday’s positioning and not today’s price action.
- Single-name flow: confirmed-opening premium reached USD 1.19bn and split almost exactly in half, 50.2% puts against 49.8% calls. That balance is structural rather than indecisive: the largest lines were long-dated semiconductor combinations opened on matching timestamps, which carry a put and a call at the same strike and express no direction. Where the side was readable, customers were sellers of premium expiring Friday, and the single clean defensive block was a stack of deep in-the-money puts in one large-cap technology name expiring the day after the Federal Reserve decision.
- Sector and ETF flow: the energy complex tells the sharper story. Headline premium leaned 58% to calls, yet every line with clean side evidence was a bought put across the crude and exploration funds, which reads as protection being paid for after the move rather than a fresh view. In our view the complex may be long a crude spike it does not entirely trust. Defensive sector funds carried size in health care but printed at mid, so no direction is claimable. Named funds are market context only. Costs and charges apply to exchange-traded fund trades; see Saxo pricing for costs and applicable charges.
Volatility surface – 9 September 2026, approx. 06:27 CET
VIX term structure
- VIX spot 15.72 (up 2.75%)
- VIX1D 10.43 (down 13.30%) · VIX9D 14.81 (up 23.73%), the largest move anywhere on the surface
- VIX3M 18.39 (up 4.43%) · VIX6M 20.34 (up 2.26%) · VIX1Y 21.78 (up 1.35%), an upward-sloping cash curve throughout
VIX futures
- Front-month VIX futures 18.45. The contract has rolled, so neither the session change nor the premium to spot compares cleanly with the previous edition and no comparison is drawn here
- Second-month VIX futures 19.20 (up 4.34%), front-to-second ratio at 0.960, so the curve stays in contango
Skew and correlation
- CBOE SKEW 148.86 (down 1.79%), still well above the 100 to 120 neutral zone
- COR3M 9.86 (up 3.46%), close to the low of this cycle
- DSPX 34.51 (up 5.44%), the S&P 500 dispersion index
Other vol measures
- VVIX 88.69 (up 5.06%) · MOVE 76.14 (up 4.16%)
- VXN 21.71 (up 8.33%), at 1.38 times the equity gauge
- GVZ 27.26 (up 2.37%)
Source: Saxo, Bloomberg, CBOE, 9 September 2026, approx. 06:27 CET. Past performance is not indicative of future results.
What the market is pricing
- Session implied move. Today’s expiry prices 36 points, or 0.46%, the same figure the previous session’s same-day expiry carried. The figure is derived from at-the-money option pricing rather than a forecast. Nothing scheduled lands before the close, and the pricing says so.
- Event implied range. The 11 September expiry prices 74 points, or 0.96%, against 79 points quoted yesterday for the same expiry. One trading session has been consumed since, so flat-volatility decay alone would have left roughly 68 points. The market therefore added about six points of premium to the inflation print rather than letting the clock take it out, and it did so on a day when spot volatility barely moved. See Saxo pricing for costs and applicable charges.
- Tail risk signal. SKEW eased to 148.86 while dispersion rose to 34.51 and three-month implied correlation fell to 9.86, close to the low of this cycle. That combination prices a market where individual names may move a great deal and cancel each other out, which is what Tuesday delivered: a 0.58% index loss covering a 10.1% fall in one large pharmaceutical name and an 11.0% gain in an optical components maker.
- Correlation read. Oil volatility at 48.59 is 3.1 times the equity gauge, with gold volatility at 27.26 and bond volatility at 76.14, the latter up 4.16% as yields sit near cycle highs. In our view equity options may be pricing a contained index while the macro complex around it prices something considerably less settled, and Friday is the first scheduled test of which reading is right. Options carry a high risk of rapid loss and are not suitable for every investor.
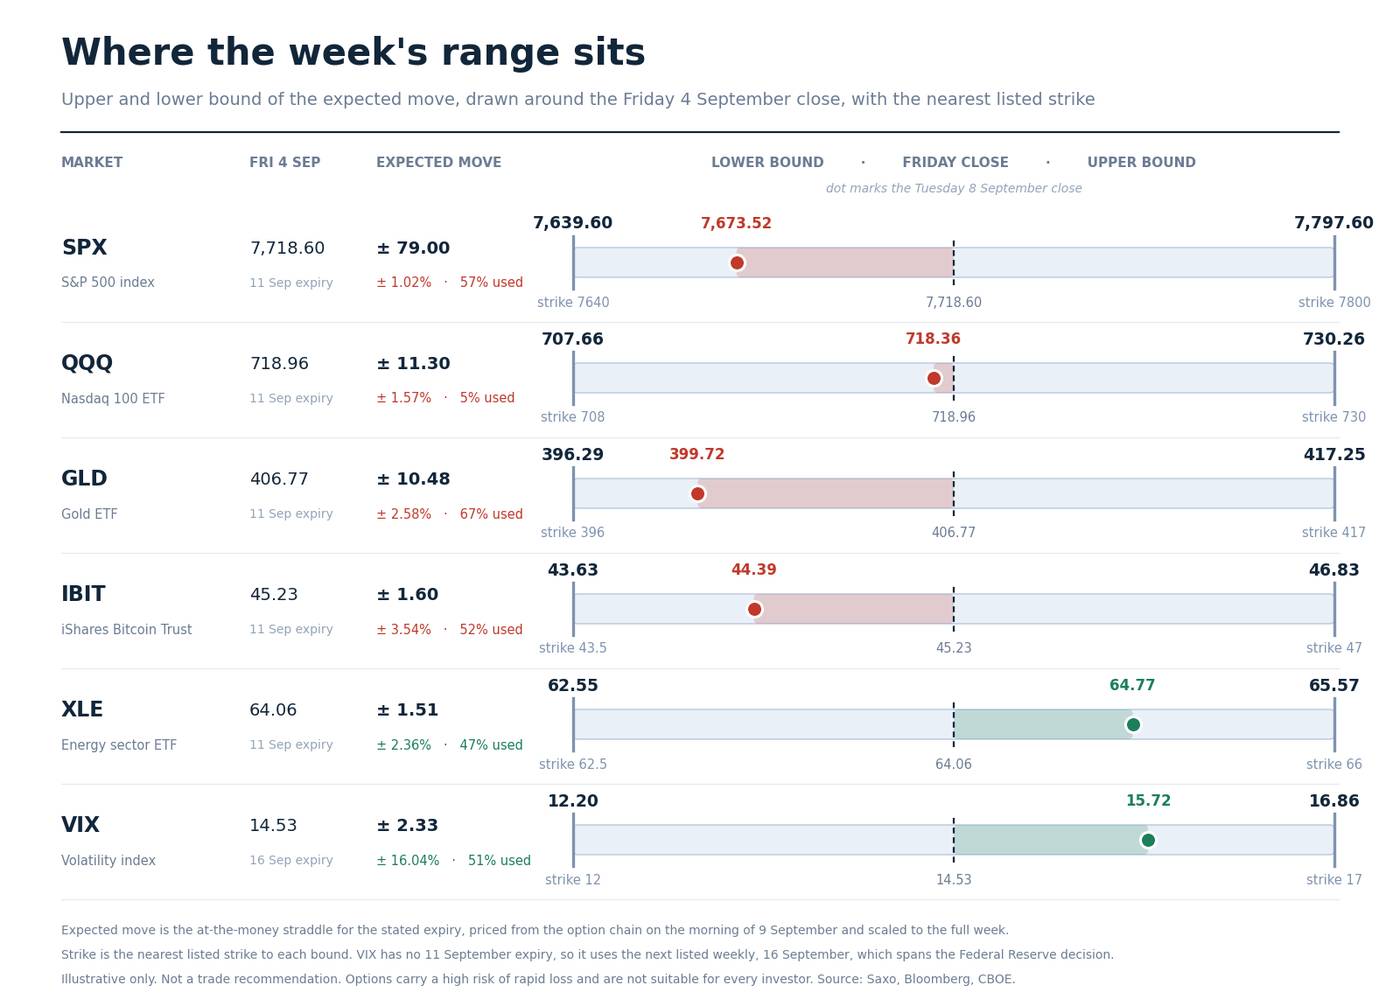
Where the week’s range sits
Expected move is derived from at-the-money option pricing for the stated expiry, not a forecast.
- The index has spent more of its weekly budget than the tape suggests. The S&P 500 has covered 57% of the range priced around Friday’s close and gold 67%, against 5% for the Nasdaq 100 fund. In our view that gap may say more about where the damage landed than about the index level.
- Volatility has travelled furthest against its own range. VIX sits 51% through a band running to the 16 September expiry, the next listed weekly, which spans the Federal Reserve decision and is therefore wider than the rows above it. Options carry a high risk of rapid loss and are not suitable for every investor. Costs and charges apply to exchange-traded fund trades; see Saxo pricing for costs and applicable charges.
Today’s catalysts
US MBA mortgage applications land at 13:00 CET, the EIA short-term energy outlook at 18:00 CET and a US Treasury sale of USD 39 billion of 10-year notes at 19:00 CET, with the UK RICS house price balance at 01:01 CET tomorrow.
Inditex reports today. Later this week US producer prices land on Thursday alongside the European Central Bank decision and results from Oracle and Adobe, then US August consumer prices arrive on Friday 11 September.
Beyond that, the FOMC meets on 15 and 16 September, where a 25 basis point increase is roughly 62% priced, and the Bank of Japan on 17 and 18 September.
Conclusion
In our view the clearest thing the option market did on Tuesday was move its money forward. The gauge covering today fell by more than a tenth while the gauge covering the next two weeks rose by nearly a quarter, and the Friday expiry ended the session more expensive than it had been despite a session having been taken off the clock.
Underneath that, the index itself is doing less work than it appears. A 0.58% decline that contains a double-digit fall in health care and a double-digit gain in optical components is not a calm market, it is a market whose parts are cancelling. Correlation near the cycle low and dispersion at 34.51 say the same thing from the derivative side.
In our assessment those two readings could resolve together. Low correlation holds while the shocks stay idiosyncratic, and an inflation print that moves the whole rate curve is not idiosyncratic. Options carry a high risk of rapid loss and are not suitable for every investor. Past performance is not indicative of future results.
Important note: The strategies and examples provided in this article are purely for educational purposes. They are intended to assist in shaping your thought process and should not be replicated or implemented without careful consideration. Every investor or trader must conduct their own due diligence and take into account their unique financial situation, risk tolerance, and investment objectives before making any decisions. Remember, investing in the stock market carries risk, and it’s crucial to make informed decisions.
| More from the author |
|---|