
Access both platforms from your single Saxo account.

The spike settles, the curve stays inverted - Options Brief - 9 November 2026

Summary: Friday took more than a fifth off one-day volatility, yet short-dated protection still costs more than long-dated. With US inflation data due Tuesday, is the front of the curve settling, or only catching its breath?
One-day volatility fell by more than a fifth on Friday, yet protection for the next few days still costs more than protection for the next few months.
MARKET REGIME: HIGH VOL BEAR | VIX 25.64 | TERM STRUCTURE: BACKWARDATION | SKEW: ELEVATED (153.55) | FRONT-MONTH VIX FUTURES: 22.250
Today in brief
Friday took back part of Thursday’s jump in the price of protection, and the fall was largest where the jump had been biggest. The one-day volatility gauge, which measures what options charge for protection over the next session, fell 21.93% to 28.73. The VIX, the same measure over a month, fell 9.01% to 25.64, and the one-year gauge only 1.22%. Even so, short-dated protection still costs more than long-dated protection, which is the reverse of the usual order. In our view that may suggest the market sees the risk as easing, but still sitting in the next few sessions rather than further out.
Options price about 92 points, 1.25%, for today’s S&P 500 expiry, and about 2.54% to Friday, a window that holds Tuesday’s US inflation report. Taken together, those two figures leave roughly 1.1% a session for Tuesday to Friday, so today is priced a little above the average of the four days that follow, inflation day included.
One reading cuts the other way. SKEW, which tracks the price of protection against a very sharp fall, rose 2.80% to 153.55 while the VIX fell. In our view that may suggest buyers let go of near-term protection but kept paying for the far tail.
In our view the bounce may have been narrow. The S&P 500 closed 0.31% higher at 7,376.86 and the Nasdaq 100 1.35% higher, but the equal-weighted S&P 500 fell 0.41% and the Stoxx 600 1.00%. The typical single stock’s volatility rank eased to 41.7 from 44.0, and flow among the largest index-fund trades still leaned to puts, mostly as protection carried forward rather than closed. Past performance is not indicative of future results.
That is the whole brief in one read. The sections below hold the detail behind each paragraph, with the charts, the full set of readings and the sources, for when you want to go deeper on one part.
Headline driver
US stocks recovered part of Thursday’s chip selloff on Friday. The Saxo Market Quick Take puts the semiconductor rebound at 4.2%, with AMD up 11.0% and Nvidia 2.8%. Payrolls rose 165,000 in October against forecasts near 60,000, unemployment fell to 4.1%, and the Quick Take reports futures moving toward a Fed rate rise at the 8 to 9 December meeting.
Over the weekend Nvidia’s board opened an internal investigation into its chief executive, which the Quick Take flags as a governance concern for one of the heaviest index weights. On Iran, President Trump said fresh strikes were highly unlikely if talks advance. Asian chipmakers rebounded this morning.
Market snapshot
- US (Friday 6 November close): S&P 500 7,376.86, up 0.31%. Nasdaq 100 26,989.99, up 1.35%. Dow Jones Industrial Average 51,285.73, down 0.46%. The equal-weighted S&P 500 fell 0.41%. The semiconductor fund rose 3.62% and the technology fund 1.45%, while financials fell 0.59%.
- Europe: the Stoxx 600 fell 1.00% to 648.34, the DAX 1.92% to 25,820.36 and the CAC 40 0.81% to 8,139.00. Euro Stoxx 50 futures traded 0.15% above their settlement at 05:00 CET.
- Asia (Monday morning): the Kospi rose 1.11% to 5,115.66 by 05:00 CET, the Hang Seng 0.20% to 24,531.15 and the CSI 300 0.24%. The Quick Take has the Taiex up about 5%.
- Commodities and rates: Brent traded at 98.13 and WTI at 91.24 at 05:00 CET. Gold futures traded at 4,124.50, up 1.22%, and silver at 52.98. The two-year Treasury yield closed Friday near 4.51% and the ten-year near 4.86%. Bitcoin traded near 75,000. S&P 500 futures sat 0.55% above their settlement.
- Market regime: high volatility bear, the VIX at 25.64, the curve in backwardation and SKEW elevated at 153.55.
Index levels and volatility readings from the watchlist export taken at 05:00 CET on 9 November 2026, which carries Friday’s US closes and overnight futures; the Dow close, Treasury closes, Taiex, single-stock moves and policy context from the same-morning Saxo Market Quick Take. Past performance is not indicative of future results. Source: Saxo, Bloomberg, CBOE.
Volatility surface
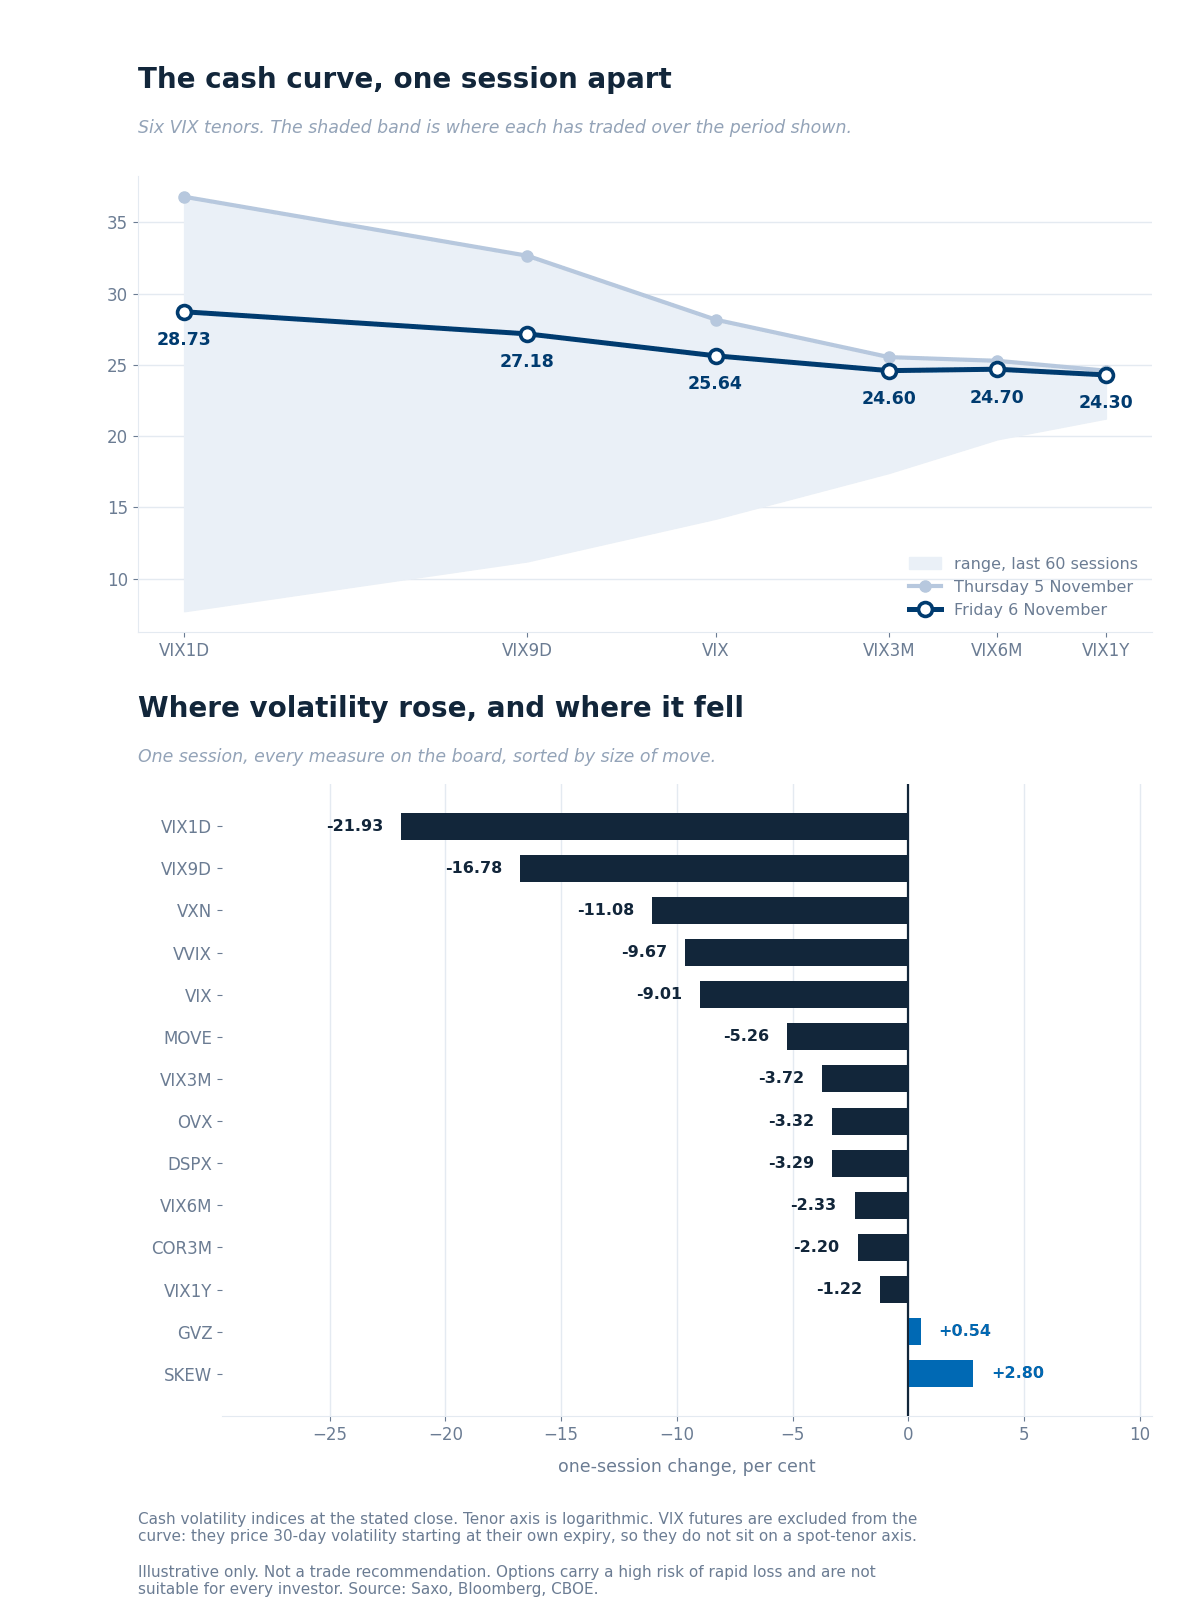
The cash curve at Friday’s close against Thursday’s, over each tenor’s 60-session range, with the one-session change across every measure. Illustrative only. Past performance is not indicative of future results. Source: Saxo, Bloomberg, CBOE.
The curve came down from the front. The one-day gauge fell 21.93% to 28.73, the nine-day 16.78% to 27.18 and the VIX 9.01% to 25.64, while the three-month fell 3.72% to 24.60 and the one-year 1.22% to 24.30. Every tenor still sits at its second-highest reading in our 105-session store, behind Thursday. VIX futures stay off the chart, since each prices a month from its own expiry.
Ratios. The one-day gauge sits at 1.12 times the VIX, from 1.31. VIX3M/VIX rose to 0.96 from 0.91, still below one, and VXN/VIX eased to 1.33 from 1.36.
VIX futures. November trades at 22.25, 13.2% below spot, and December at 21.10. A parity check on the 18 November options read 23.77 on thin early quotes, so we draw no session comparison on the futures.
Tails and correlation. SKEW rose 2.80% to 153.55, above its 146.04 median. Implied correlation, a gauge of how closely stocks are expected to move together, eased 2.20% to 20.47, still about twice its 10.48 median.
Single-name volatility
Single-name volatility eased, though the typical name moved less than the index funds. On a common set of 520 underlyings the median implied-volatility rank fell to 41.7 from 44.0, and the mean to 43.9 from 46.4, with 326 names down and 186 up. Names at a rank of 80 or more fell to 42 from 55.
The index measures above gave back most. The Nasdaq 100 fund’s rank fell to 82.0 from 100, the technology fund’s to 84.9 from 98.0 and the S&P 500 fund’s to 54.2 from 63.6. Nvidia eased to 83.2 from 97.8 yet still sits at the 99.6th percentile of its year, and Tesla fell to 59.2 from 82.0. Gold’s fund rose, to 22.0 from 20.9.
The US median fell to 51.8 from 57.1, the euro-zone median to 35.5 from 36.8.
Implied-volatility rank and percentile from the Saxo screener, read early on 7 November 2026, carrying Friday’s close. Source: Saxo.
Options flow sentiment
Based on end-of-day Friday 6 November, yesterday’s positioning, not today’s price action.
- Single-name flow had no clean direction: most of the largest premium crossed mid-market, and the modest call buying in the largest technology names was largely paired with put sales.
- Sector and ETF flow leaned to puts among the largest index-fund trades, but mostly as protection carried forward to later expiries rather than closed. In our view the rebound may not have come with an all-clear in positioning.
Where the week's range sits
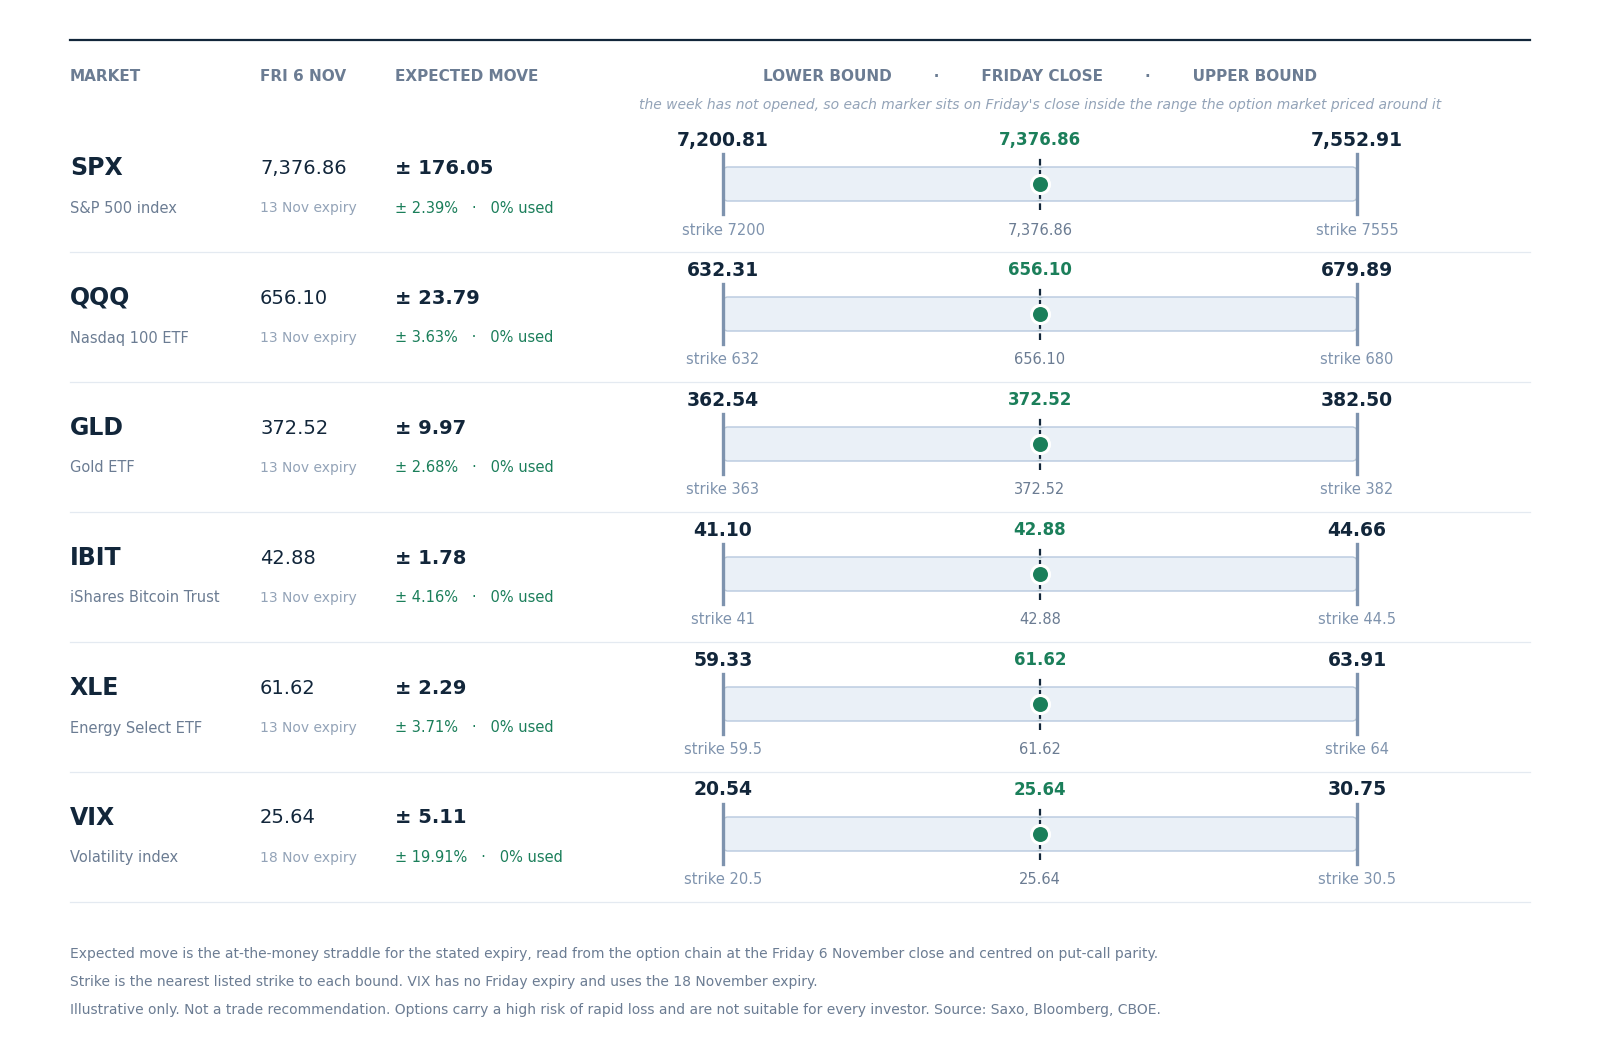
The range the option market priced for this week around Friday 6 November’s close. The week has not opened, so each marker sits on Friday’s close. Illustrative only, not a trade recommendation. Past performance is not indicative of future results. Source: Saxo, Bloomberg, CBOE.
The S&P 500 starts the week with 176.05 points priced around Friday’s 7,376.86 close, 2.39%, from 7,200.81 to 7,552.91. Last week’s band, read the same way, was 1.84%, so the market prices a wider week, one that holds Tuesday’s inflation report.
The Nasdaq 100 fund carries 3.63%, the energy fund 3.71%, the gold fund 2.68% and the bitcoin fund 4.16%. The volatility row uses the 18 November expiry, so it measures a little over a week rather than this week alone, and carries about 19.9%.
Options carry a high risk of rapid loss and are not suitable for every investor. Costs and charges apply and vary by account and venue; check the rates applicable to you.
Today's catalysts
- 16:00 CET Fed’s Goolsbee speaks; 18:00 CET US three-year note auction; 18:15 CET Fed’s Barkin speaks.
- Earnings today: KKR and Constellation Energy.
- This week: US October inflation and CoreWeave on Tuesday; the US bond market is closed on Wednesday for Veterans Day; Cisco, Applied Materials and UK third-quarter GDP on Thursday; US producer prices on Friday.
Earnings scorecard
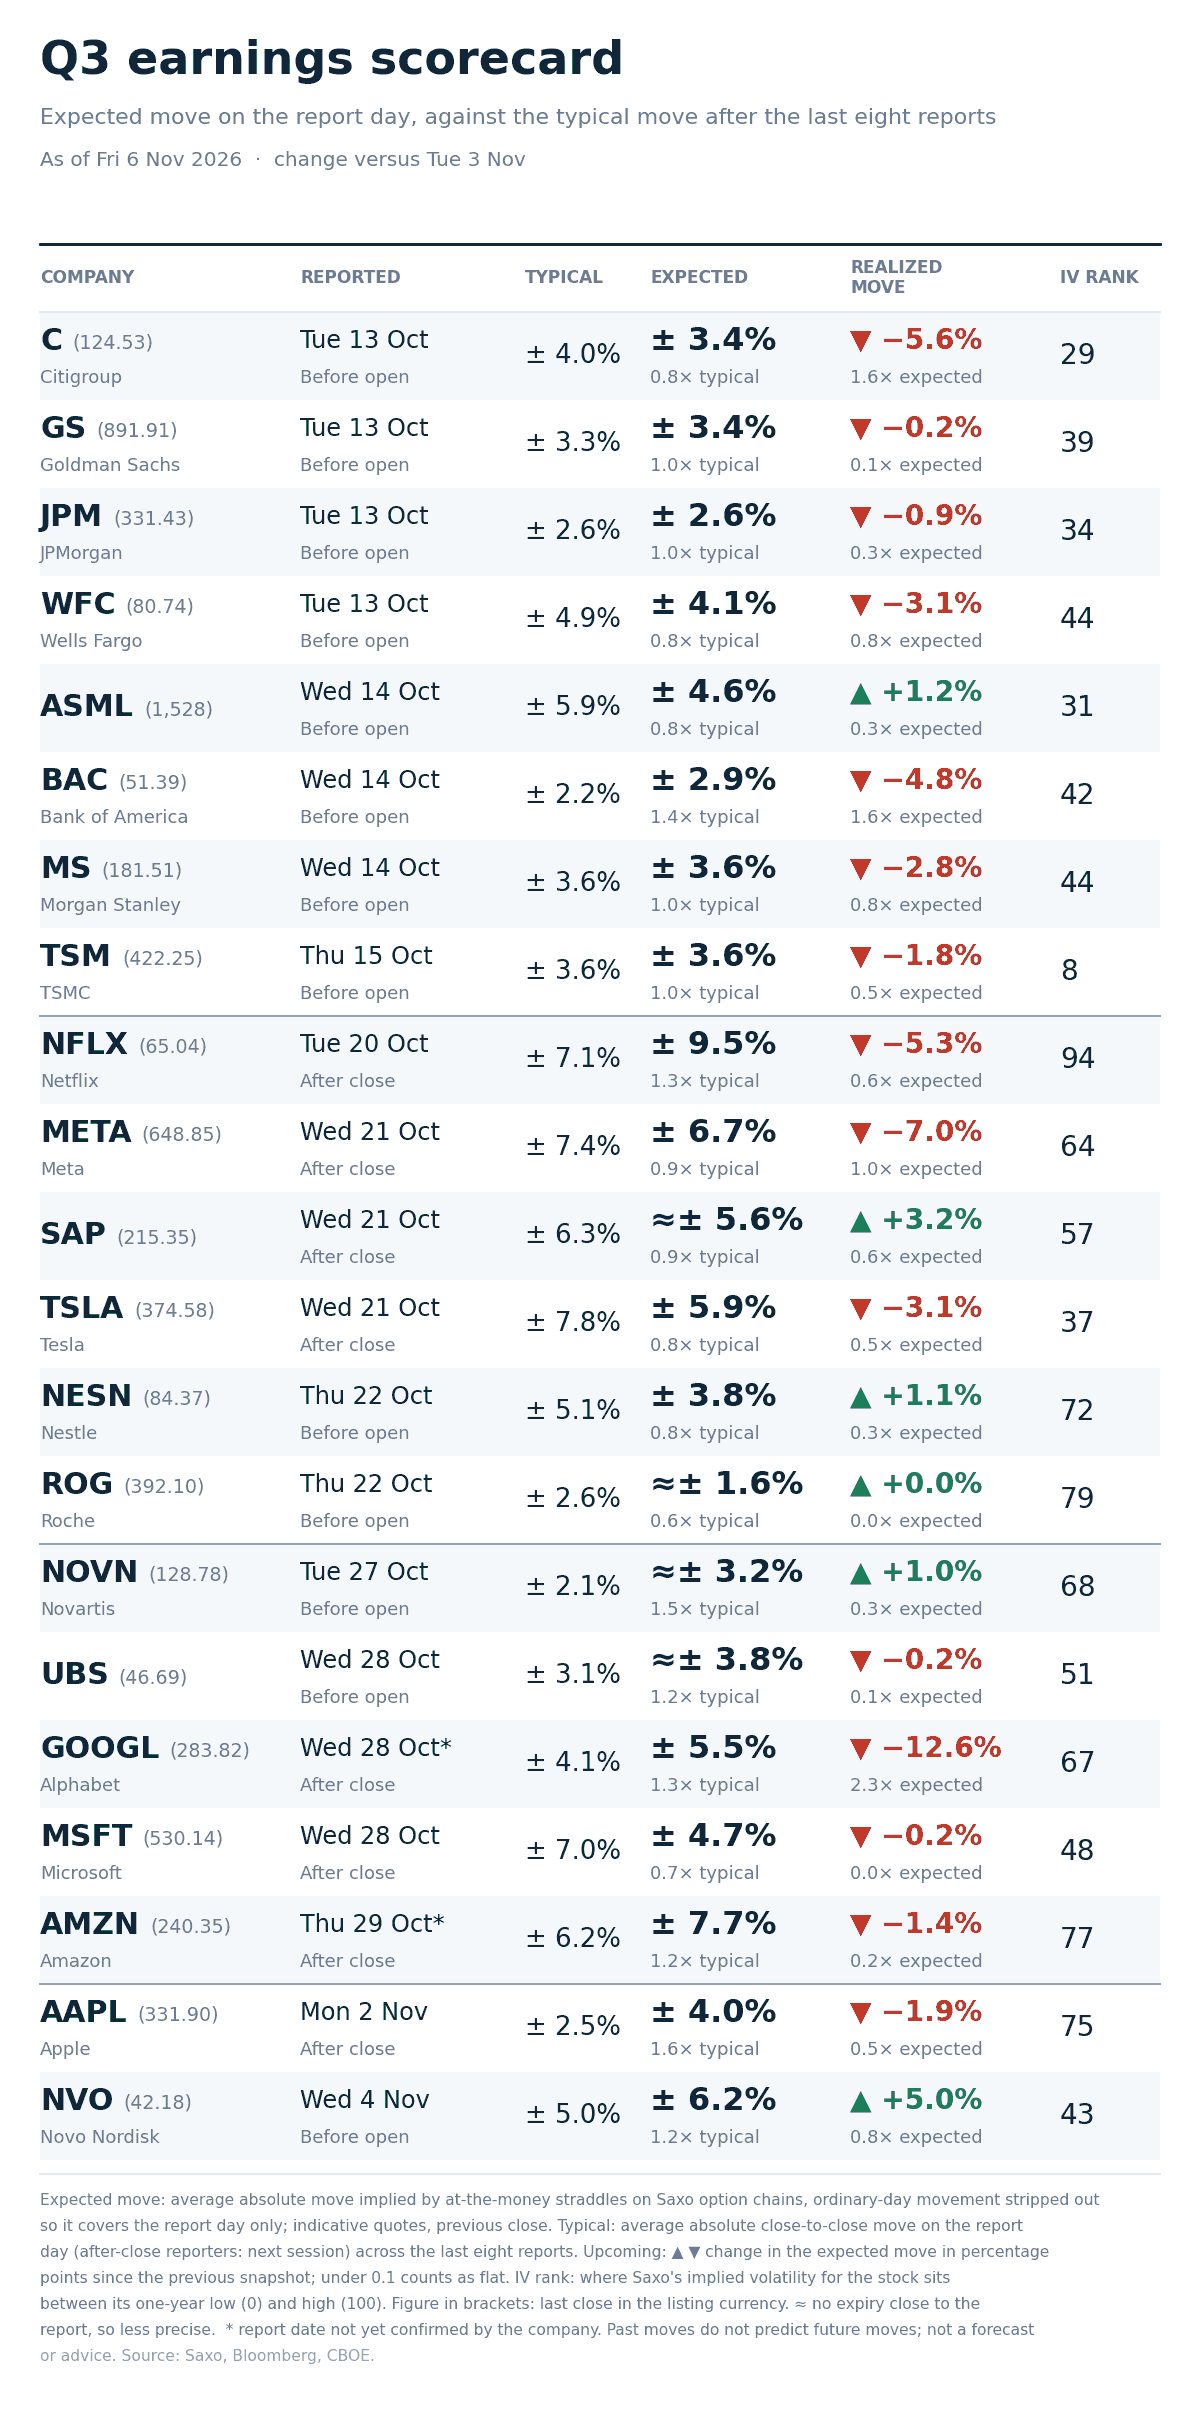
Option-implied expected move for each report day against the stock’s average move after its last eight reports, across the twenty-one names tracked this season. Past performance is not indicative of future results. Source: Saxo, Bloomberg, CBOE.
All twenty-one names have reported, so the board is final and unchanged since Friday. Across the set the median moved about 0.5 times what was priced, and four moved at least as much as priced: Citigroup, Bank of America, Meta and Alphabet.
Options carry a high risk of rapid loss and are not suitable for every investor. Costs and charges apply and vary by account and venue; check the rates applicable to you. Past performance is not indicative of future results.
What the market is pricing
- Session implied range: S&P 500 options price about 92 points, 1.25%, for today’s expiry. The quotes are indicative before the open, with S&P 500 futures 0.55% above their settlement. The one-day gauge at 28.73 implies about 1.81%, a one-sigma figure rather than an expected move.
- Week ahead: the 13 November expiry prices about 2.54%. Netting out today leaves about 2.21% for the four sessions that follow, roughly 1.1% a session, below today’s 1.25% even with inflation data on Tuesday. No earlier edition quoted this expiry on a comparable basis, so we skip the time-decay comparison.
- Curve read: the one-day gauge now sits 12% above the VIX, from 31% on Thursday, and the three-month 4% below it. In our view that leans toward a market that still sees more risk in the next few sessions than further out, but less than on Thursday.
- Tail read: SKEW rose while the VIX fell, and implied correlation stayed about twice its median. In our view that may suggest a market easing out of short-dated protection while keeping its tail hedges.
In our view the next test may be Tuesday’s inflation report, which arrives with the curve still inverted and a weekly range wider than last week’s. Options carry a high risk of rapid loss and are not suitable for every investor. Costs and charges apply and vary by account and venue; check the rates applicable to you. Past performance is not indicative of future results.
| More from the author |
|---|