
Access both platforms from your single Saxo account.

Front end reprices, long end holds - Options Brief - 15 October 2026

Summary: One-day volatility rose a third while the one-year measure barely moved, and five of six markets have already spent the range priced for the whole week. The question is which end of the curve has it wrong.
One-day volatility rose a third, the one-year measure one percent.
MARKET REGIME: TRANSITIONING | VIX 16.87 | TERM STRUCTURE: CONTANGO | SKEW: ELEVATED (157.30) | FRONT-MONTH VIX FUTURES: 17.68
Key findings
- The repricing happened at the front and almost nowhere else. VIX1D rose 31.62% to 14.11 while the one-year measure added 1.29% to 21.94.
- Far downside protection has not been dearer in our records. SKEW closed at 157.30, above all 60 previous sessions in the store.
- The week’s priced range is already spent. Five of six markets have travelled more than 100% of it with one session left; the Nasdaq 100 fund 180%.
- Widest earnings premium against own history: Novartis at 1.4x, Meta at 0.5x.
Headline driver
September consumer prices reaccelerated. Headline inflation rose to 3.7% from 3.4%, above the 3.6% expected, energy-led, with core at 2.6%. Pricing for a 28 October Federal Reserve increase spiked above 50% intraday, then eased below 30% to finish lower than the day before.
Two markets read it differently. Equities sold the print and kept selling, the S&P 500 taking its worst session since late July, ending its longest run without a one percent decline in over six years. Overnight Korea’s Kospi fell 8.02% and trading was halted. Treasuries took it back in full: the 2-year yield rose as much as 16 basis points and the 10-year 12 before both reversed, ending at a three-week low.
In our view that disagreement, not the print, is what the measures below are pricing. Options carry a high risk of rapid loss and are not suitable for every investor.
Market snapshot
Levels are as of the 06:00 CET snapshot on 15 October 2026. US and European figures are the Wednesday 14 October close; Asian figures are Thursday’s session.
- US (Wednesday 14 October close): S&P 500 7,718.94, down 1.11%. Nasdaq 100 29,950.82, down 2.02%. Dow 51,626.17, down 0.09%. Russell 2000 down 1.93%, over 10% below its August peak. The equal-weighted S&P fell 0.59%, a third of the headline index, so the weight sat in the large names. Semiconductors fell 3.98%, software 3.00%, technology 2.98%; healthcare rose 2.53%.
- Europe (Wednesday 14 October close): Stoxx Europe 600 up 0.43% to 637.76, Euro Stoxx 50 up 0.38%, DAX up 0.15% and the Swiss market 1.45% higher. Europe sat it out.
- Asia (Thursday session): Kospi down 8.02% to 5,527.12 with trading halted, Nikkei 225 down 5.13%, Hang Seng 1.47% and its technology sub-index 2.94%, CSI 300 2.00%.
- Commodities and rates: Brent eased to 104.29 and WTI to 94.09. Gold futures are 1.45% higher at 4,167.3, recovering most of Wednesday’s post-print fall; the gold fund closed 1.49% lower and silver’s 6.11%. Treasury yields spiked then fully reversed: the 10-year sits at 5.098%, 9.6 basis points below Wednesday’s close and a three-week low, the 2-year at 4.711% and the 30-year 5.450%.
- Market regime: Transitioning. VIX 16.87, 20-day realised volatility 10.04%, stable, the index within 0.15% of its 50-day average.
Past performance is not indicative of future results. Source: Saxo, Bloomberg, CBOE.
Volatility surface
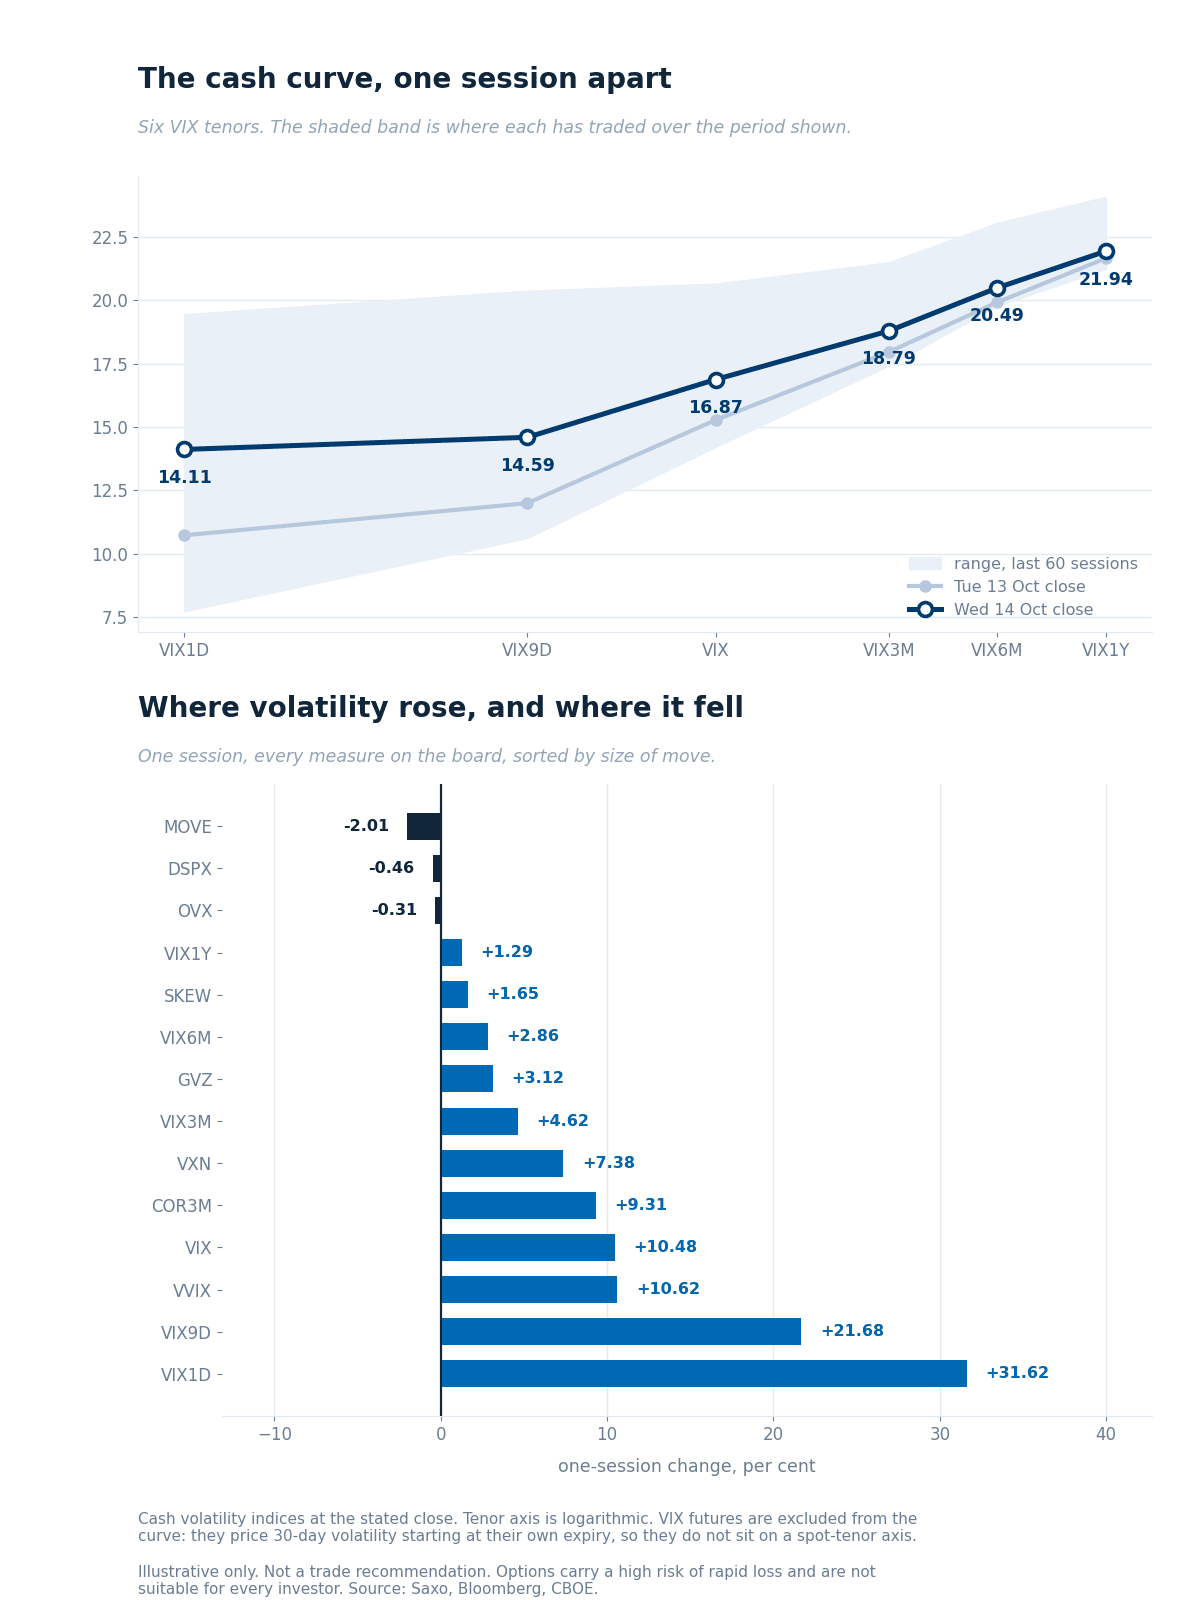
The cash curve against the previous session, over each tenor’s 60-session range, with the one-session change across every measure on the board. Source: Saxo, Bloomberg, CBOE.
The curve rotated around its back end. VIX1D rose 3.39 points to 14.11 and the nine-day measure 2.60 to 14.59, the 30-day 1.60 to 16.87, the three-month 0.83, the six-month 0.57 and the one-year 0.28. A board that moves by a third at one day and one percent at one year has repriced a window, not a view. In proportion though: both front tenors are still below spot, so the front is catching up rather than inverting.
Ratios. VIX3M/VIX fell to 1.11 from 1.18, flatter but still contango. VXN/VIX eased to 1.35 from 1.38: the Nasdaq premium narrowed even though the Nasdaq fell twice as far as the index, because broad index volatility caught up rather than because technology calmed.
VIX futures. The 21 October option expiry gives a parity forward of 17.68, consistent to 0.05 across the five nearest strikes, a premium to spot of 0.81 points. The feed’s continuous series reads 18.55 and does not reconcile against its stored prior, so it has rolled and no comparison is drawn from it.
Rates. The bond volatility measure eased 2.01% to 99.07, the one part of the board that fell on an inflation day. A yield move that round-trips inside a session leaves the forward price of volatility lower, which is what it did.
Single-name volatility
Saxo’s one-year implied-volatility ranks, read at Wednesday’s close across 187 US names, show the quiet tail emptying rather than the top extending.
- The move was in the floor, not the ceiling. The median rank rose to 44.6 from 42.7 on exactly the same 187 names, so the comparison needs no caveat. Underneath it, names below rank 20 fell from 19.3% to 12.8% of the set while names above 70 grew from 11.8% to 13.9%. A session that lifts the bottom third is a broad repricing.
- Europe did not participate. Across 337 euro-zone names, also an identical set, the median rank was 47.0 against 47.4, and the share below rank 20 rose slightly. The single-name readings match what the cash indices did on each side of the Atlantic.
- The semiconductor move was mostly not semiconductor-specific. Rank rose 7.1 points for the broad market fund, 7.1 for the semiconductor fund and 7.4 for its peer, all in line. Only Nvidia stands apart at 16.5 points, and part of that is its front expiry rolling from 14 to 16 October rather than demand.
Past performance is not indicative of future results. Source: Saxo.
Options flow sentiment
Based on end-of-day 14 October - yesterday’s positioning, not today’s price action.
- Single-name flow leaned to calls on headline premium, but the largest lines were calendar rolls, straddle legs and deep in-the-money rolls whose net cash was close to zero.
- Sector and ETF flow was horizon extension: protection rolled further out at similar moneyness, with near-dated premium sold rather than bought.
Worth stating plainly: the flow does not evidence the front-end shock the screen shows. Desks lengthened horizon and sold the front on the session the front repriced. Treat it as neutral.
Where the week's range sits
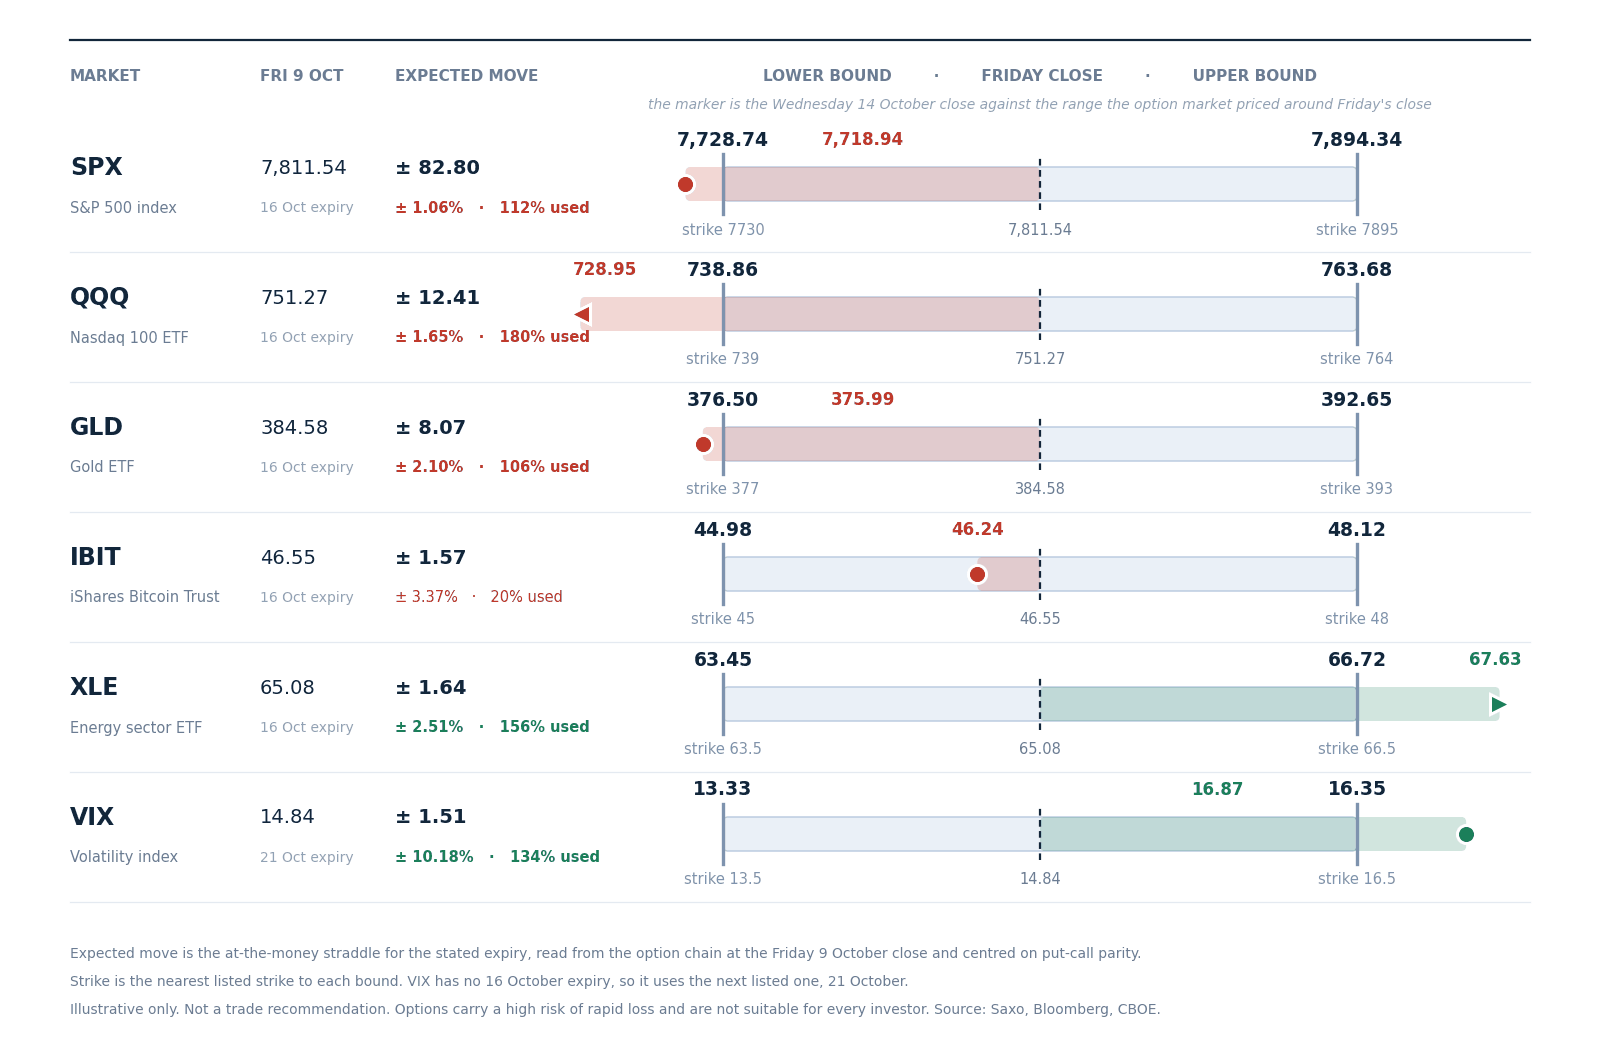
The range the option market priced for this week around Friday 9 October’s close, with the nearest listed strike at each bound and the Wednesday 14 October close as the marker. Figures are at-the-money straddles read from the Saxo chain at Friday’s close and centred on put-call parity. Illustrative only, not a trade recommendation. Source: Saxo, Bloomberg, CBOE.
Three sessions in, five of the six rows sit outside the range priced for the whole week. The Nasdaq 100 fund has travelled 180% of its 12.42-point range, energy 156%, the VIX 134%, the S&P 500 112% and gold 106%. Only bitcoin’s fund is still inside, at 20%.
Tuesday’s edition described a market whose parts were moving against each other while the index stood still. One session later the index has gone with them. A week whose budget is spent by Wednesday leaves Friday’s expiry pricing a range the market has already shown it can cover in an afternoon.
Options carry a high risk of rapid loss and are not suitable for every investor. Costs and charges apply and vary by account and venue; check the rates applicable to you before entering any position.
Today's catalysts
- September producer prices, retail sales and weekly jobless claims at 14:30 CET, the session’s event and the next read on whether the inflation reacceleration is broad or energy-led.
- TSMC reports before the US open, the first large semiconductor result since the selloff began, with Charles Schwab, Interactive Brokers and Prologis alongside it.
- Also today: the delayed US crude inventory report, after an industry estimate showed a draw of 11.1 million barrels.
- Fed speakers at 16:00 and 22:30 CET, ahead of the 28 October decision that intraday pricing briefly put above 50% for an increase before settling below 30%.
Earnings scorecard
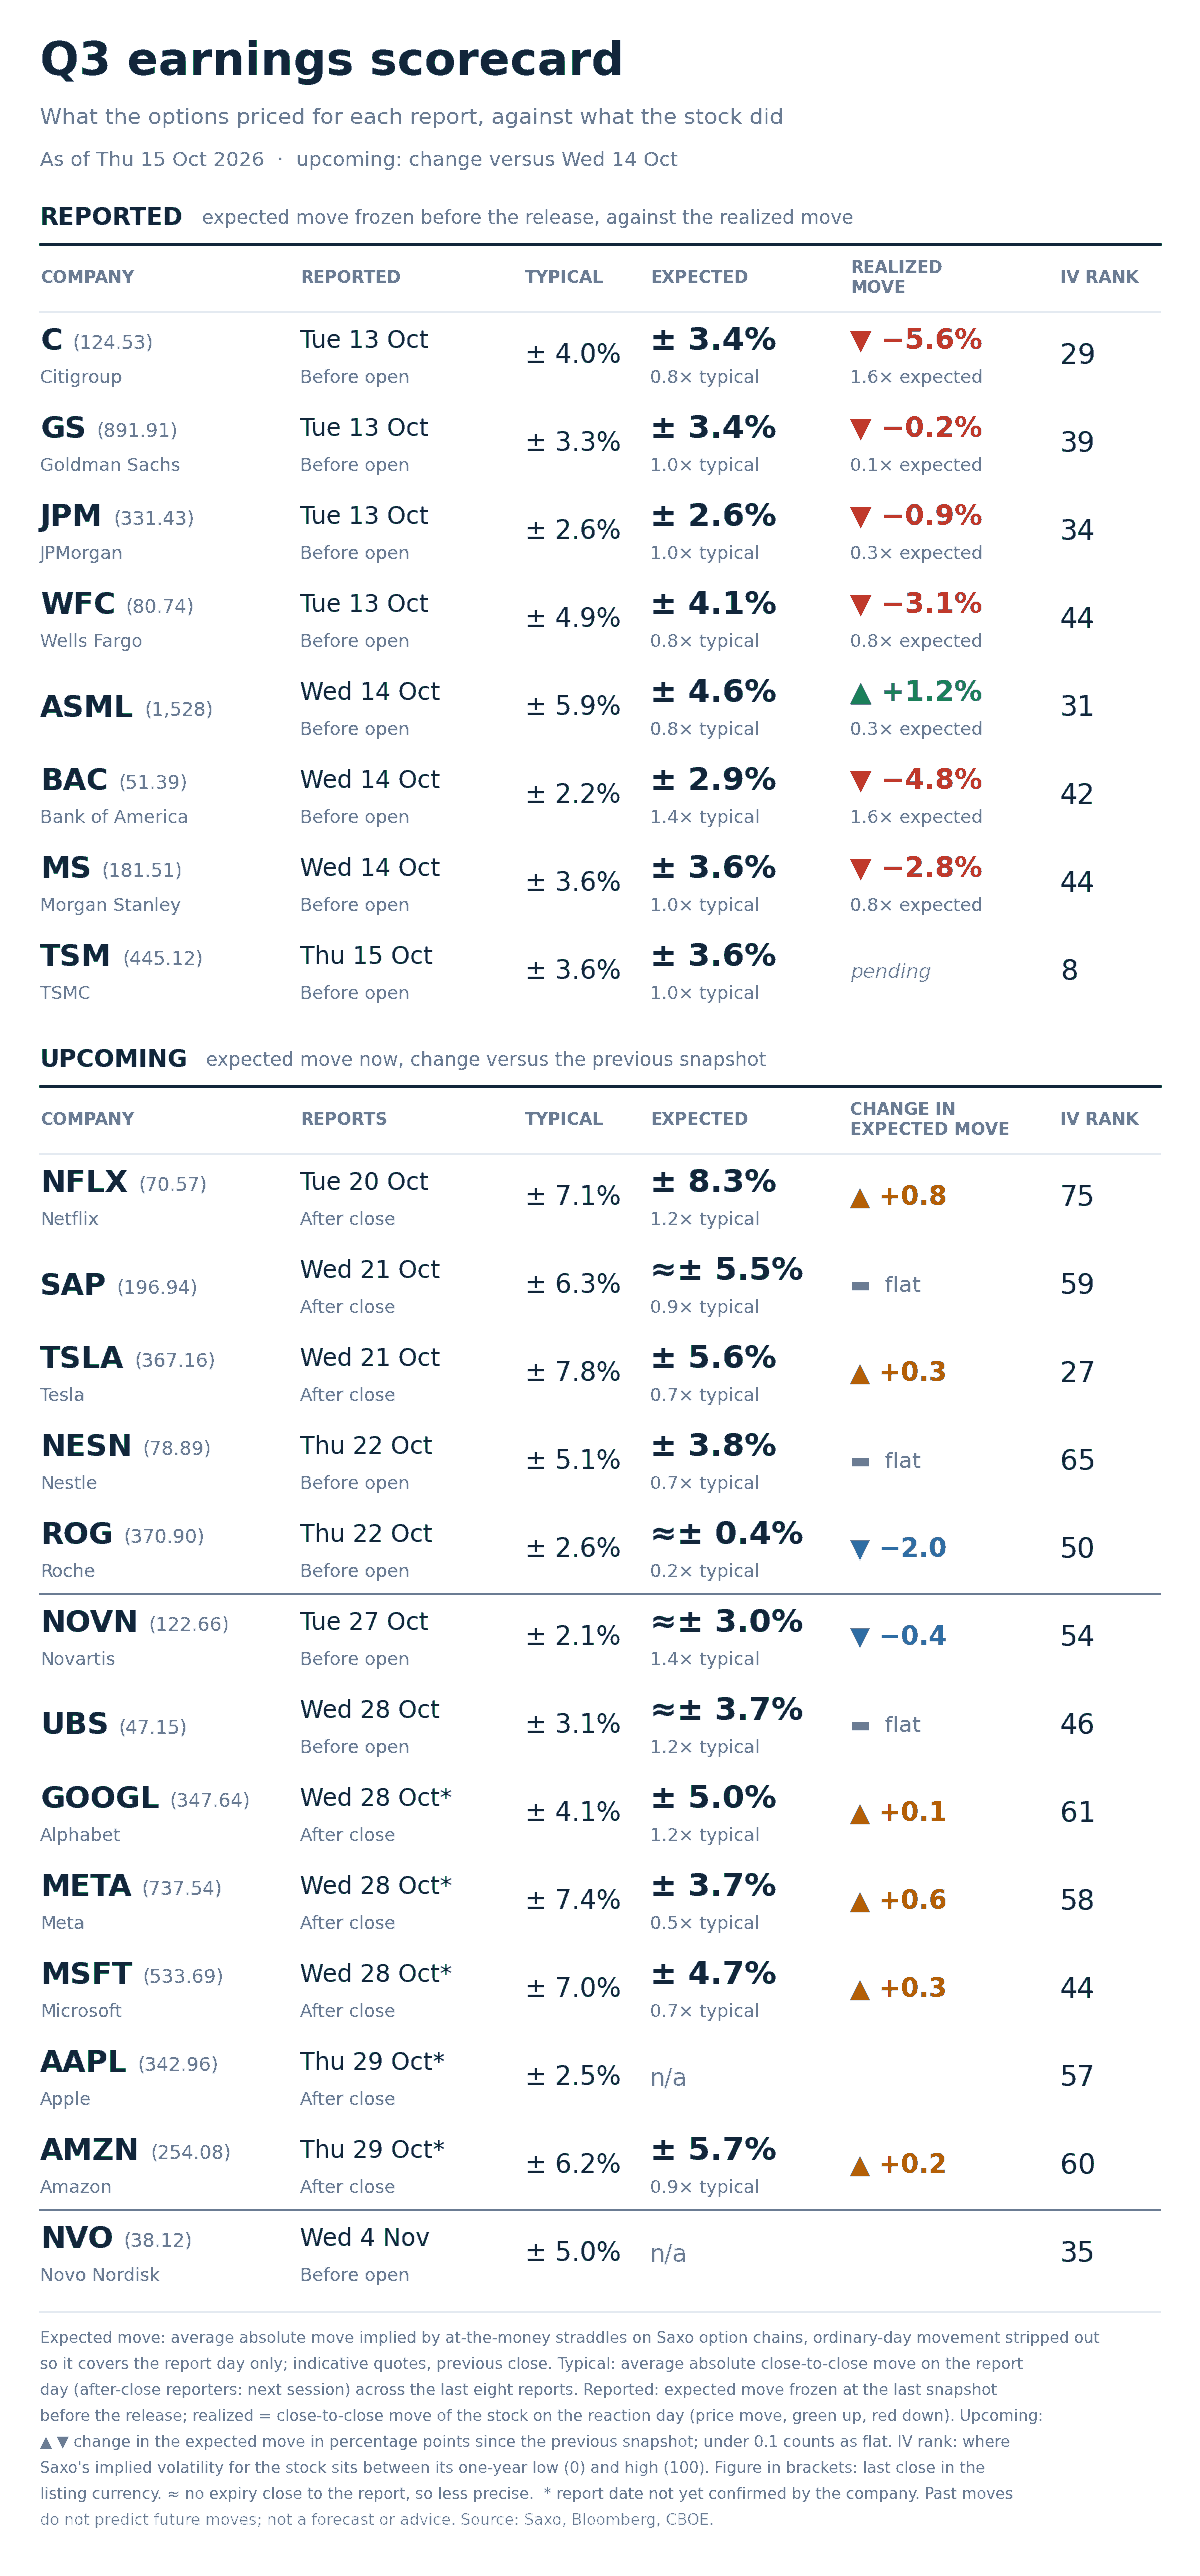
Option-implied expected move for each report day against the average move after the last eight reports, with implied-volatility rank and last close, as of 15 October 2026. Illustrative only, not a trade recommendation. Source: Saxo, Bloomberg, CBOE.
- Two of seven exceeded what was priced. Citigroup fell 5.6% against 3.4% and Bank of America 4.8% against 2.9%, both 1.6x. Goldman Sachs, JPMorgan, Wells Fargo, ASML and Morgan Stanley all moved inside.
- The widest premiums against own history are in European healthcare and banking. Novartis prices 3.0% against a 2.1% average, 1.4x, and UBS 3.7% against 3.1% at 1.2x. At the other end Roche prices 0.4% against 2.6% and Meta 3.7% against 7.4%.
- Rank and event premium answer different questions. TSMC reports this morning with an implied-volatility rank of 8, near the bottom of its year, pricing 3.6%, exactly its eight-report average. Netflix carries a rank of 75 and prices 8.3% against a 7.1% average. Rank measures the level against the name’s own past; the expected move, what one day costs.
- Next up: Netflix on 20 October, SAP and Tesla on 21, Nestle and Roche on 22.
Options carry a high risk of rapid loss and are not suitable for every investor. Costs and charges apply and vary by account and venue; check the rates applicable to you before entering any position.
What the market is pricing
- Session implied range: today’s expiry prices 47.65 index points, or 0.62%, centred on a parity forward of 7,717.25. Yesterday’s was 39.7 points, or 0.51%.
- Event implied range: Friday’s expiry prices 65.05 points, or 0.84%. A session earlier it priced 65.3 points with one more session to run, where decay alone leaves about 53.3. Roughly 11.7 points went in beyond what the clock explains, so implied volatility rose through the print rather than bleeding out after it.
- Tail risk signal: SKEW at 157.30 is the highest in our stored series, above all 60 previous sessions: far downside protection got dearer on a day the 30-day measure added only 1.60 points.
- Correlation read: three-month implied correlation rose 9.31% to 12.80, near the top of its three-month range, still low outright, while dispersion was flat at 36.60. Correlation up with dispersion flat is a common shock, not a rotation.
In our view the open question is which end of the curve is wrong. The front has paid for one number; the back has barely moved, and SKEW says the protection bought is far out of the money. Today’s producer price data is the next test.
Options carry a high risk of rapid loss and are not suitable for every investor. Costs and charges apply and vary by account and venue; check the rates applicable to you before entering any position. Past performance is not indicative of future results.
This material is produced for informational and educational purposes only and does not constitute investment advice or a recommendation to buy or sell any instrument. Options involve significant risk and are not suitable for all investors. Figures quoted are derived from option-implied pricing at the stated snapshot times and may change rapidly.
| More from the author |
|---|