
You can access both of our platforms from a single Saxo account.

Two banks, one morning: what options price for Goldman Sachs and Wells Fargo earnings

Summary: Six US banks report within 24 hours, and options price a similar move for each. Against their own history, Goldman Sachs and Wells Fargo sit at opposite ends. What does that comparison show?
The same priced move can mean a lot for one bank and very little for another.
The third-quarter reporting season for the large US banks is packed into two mornings. JPMorgan Chase, Citigroup, Wells Fargo and Goldman Sachs report before the US open on 13 October 2026, and Bank of America and Morgan Stanley follow on 14 October 2026 (Source: company announcements, as of 7 October 2026). Six reports in roughly 24 hours make for a useful case study in how the options market prices an earnings event. This article looks at all six briefly, then takes a closer look at two banks at opposite ends of the comparison: Goldman Sachs and Wells Fargo, which both report on the morning of 13 October 2026.
This is the third piece in a series. The first explained why the direction of a single earnings move is close to a coin flip, and why the shape of the payoff tends to matter more than the call on direction. The second matched option structures to a read on the priced move. This one applies that toolkit to two banks. For each it shows two structures built for opposite views, because the point is to show how a view can be expressed, not which view to hold.
How to read the priced move
Before a company reports, the options market puts a price on how far the shares might move. A simple way to read that price is to add up what the at-the-money call and the at-the-money put cost on the first expiry after the report. That combined price, the straddle, is roughly what the market charges for movement in either direction. Divided by the share price, it gives the priced move as a percentage.
On its own, that percentage says little. A priced move of 5% is large for a bank that usually moves 2% after its results, and modest for one that usually moves 5%. So the more useful comparison is between the priced move and the bank’s own history, here the median move from the previous close to the close on report day, over its last eight reports. The median is used rather than the average so that one unusual quarter does not dominate. None of this says anything about the direction of the move.
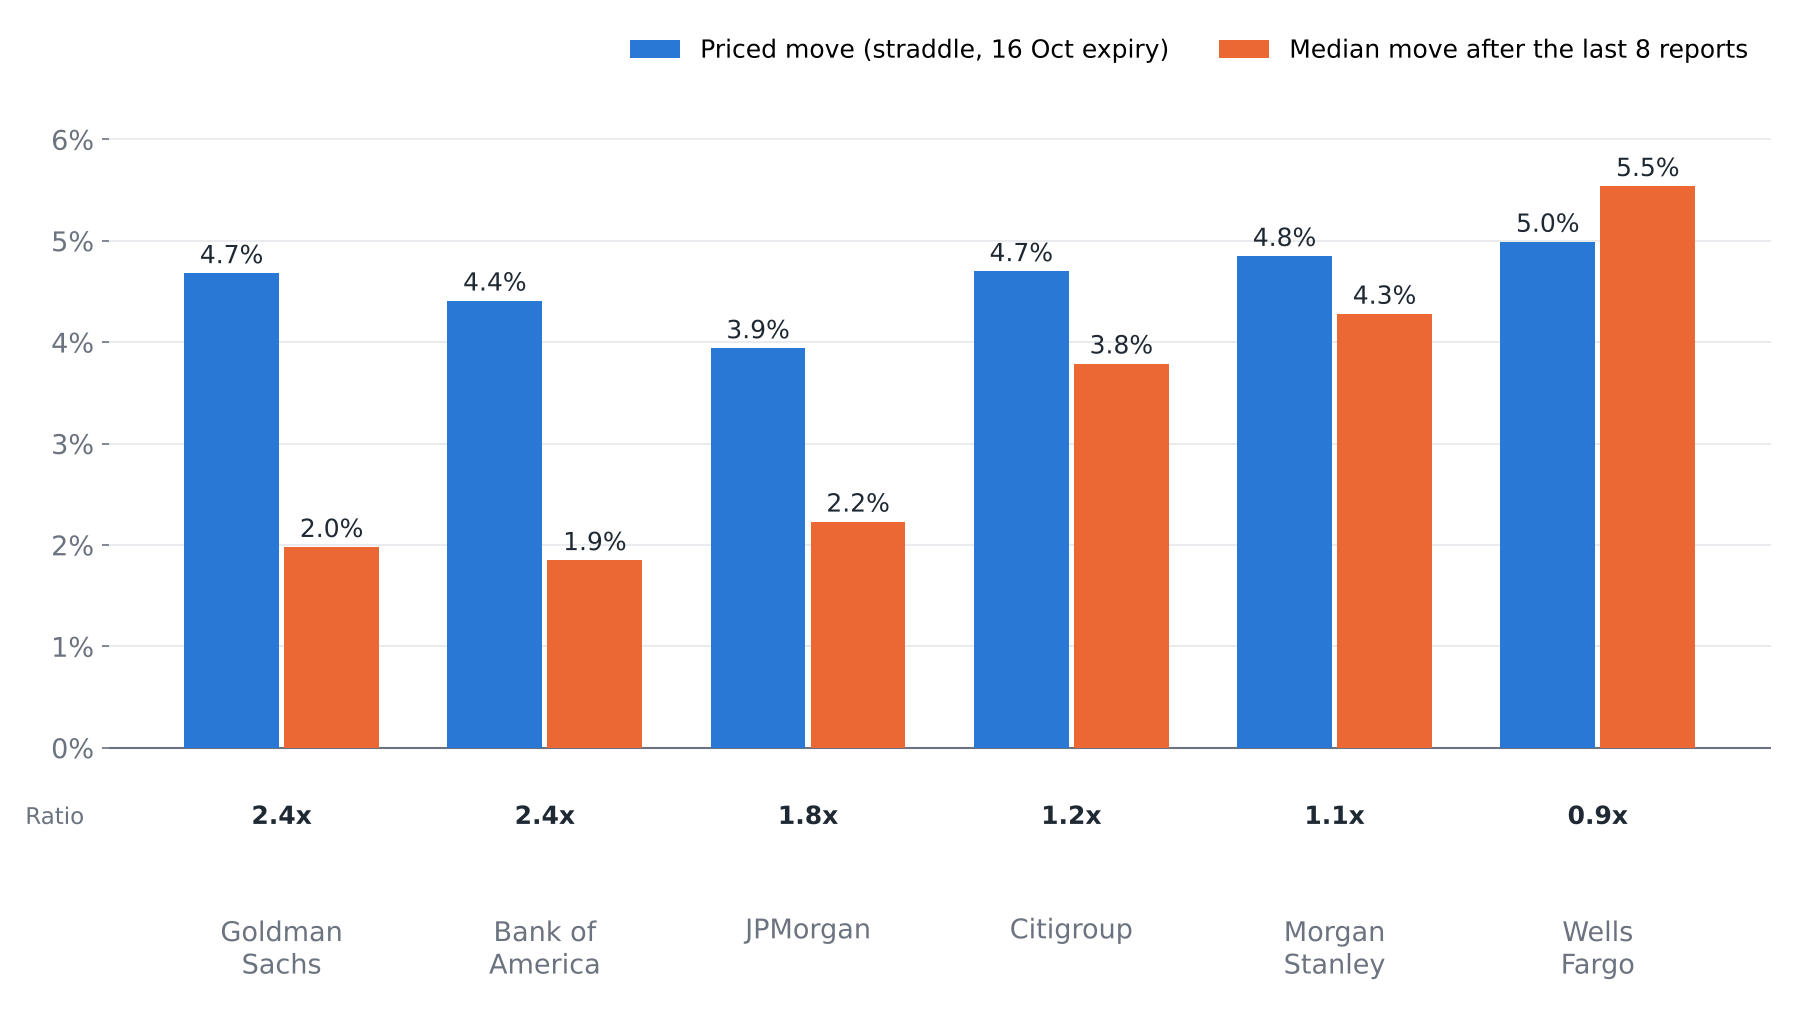 Priced move (at-the-money straddle on the 16 October 2026 expiry, indicative quotes as of the US close on 7 October 2026) against the median move after each bank's last eight reports, previous close to report-day close. The straddle also covers ordinary trading days before the report, so it modestly overstates the event alone. Past performance is not indicative of future results; figures are illustrative and not predictive. Source: Saxo, author calculation.
The priced moves sit close together, between 3.9% and 5.0%. The history is far more spread out. Goldman Sachs and Bank of America have typically moved around 2% after a report, so the options market is pricing more than twice their usual reaction. At the other end, Wells Fargo’s median move is slightly above what is priced. The rest of this article looks at Goldman Sachs, priced at about 2.4 times its usual move alongside Bank of America, and at Wells Fargo, priced just below its own.
A higher price than usual is not necessarily a wrong price. In mid-September 2026, Bank of America guided third-quarter investment banking fees at least 10% lower year on year, and its shares fell about 5% that day, while JPMorgan expected its investment banking fees and markets revenue to rise by a mid-to-high-teens percentage (Source: company comments at the Barclays Global Financial Services Conference, 14 and 15 September 2026; share move: Saxo price data). In our view, guidance that diverges this much may explain part of the extra premium: the market appears to allow for this season’s reports differing more from recent ones than usual. Eight reports is also a small sample, and a single quarter can move a median.
Important note: The strategies and examples provided in this article are purely for educational purposes. They are intended to assist in shaping your thought process and should not be replicated or implemented without careful consideration. Every investor or trader must conduct their own due diligence and take into account their unique financial situation, risk tolerance, and investment objectives before making any decisions. Remember, investing in the stock market carries risk, and it’s crucial to make informed decisions.
Two banks, two views each
The sections below first explain how the examples were built, then take each bank in turn: what is priced, how the shares have reacted in the past, and two example structures for opposite views. All examples use the 16 October 2026 expiry, the first after the report, and indicative Saxo mid prices as of the US close on 7 October 2026; actual prices will differ. Each contract covers 100 shares. All figures are hypothetical and for education only. Options carry a high risk of rapid loss and are not suitable for every investor. Costs and charges apply to each leg; see Saxo pricing for full details.
How the strikes and the expiry were chosen
Strike selection is the question readers ask most, so the rules used below are spelled out here. They all start from the same number: the priced move in points, the cost of the at-the-money straddle. For Goldman Sachs that was about 41.50 on a share price of 887.20, so the options market priced a range of roughly 846 to 929. For Wells Fargo it was about 4.00 on 80.22, a range of roughly 76.2 to 84.2. Each strike is then rounded to the nearest listed strike, preferring round numbers, where trading tends to be more active and quotes tighter.
- Short strikes of an iron condor sit near the edges of the priced range (845 and 930 for Goldman Sachs, 76 and 84 for Wells Fargo). The position then keeps its credit as long as the shares move less than the market prices. Placing them closer to the share price collects more credit but is breached by a smaller move.
- Protective wings sit about half the priced move further out. Wider wings bring in more credit but raise the maximum loss; narrower wings do the opposite.
- The long strangle buys strikes about half the priced move away from the share price. That makes it cheaper than the straddle, but the shares still need to move beyond the priced range before it pays. Strikes further out are cheaper still and need an even bigger move.
- The twin butterflies are centred on the edges of the priced range, with wings about half the priced move wide, because that is where the shares would land if they moved about as much as priced.
There is no single correct strike. Moving a strike changes the balance between how often a structure may pay and how much it may pay, the same trade-off between win rate and payoff described in the first article of this series.
The expiry follows from the report date. Both banks report before the open on 13 October 2026, and 16 October 2026 is the first listed expiry after that. The nearest expiry after an event puts most of the option’s price on the event itself: the post-report drop in implied volatility shows up fully, which short-premium structures may benefit from and long-premium structures suffer from. A later expiry includes more ordinary trading days, costs more for long positions, and reacts less to the report alone. An expiry before the report would not include the event at all.
Goldman Sachs: priced at 2.4 times its usual move
Goldman Sachs reports on 13 October 2026, with a priced move of about 4.7% on a share price of 887.20. Its median reaction over the last eight reports was 2.0%, among the lowest of the six, but its history also shows why a median is not the whole story: after its report in July 2026 the shares rose 9.0% in a day (Source: Saxo price data, author calculation). With a calm typical reaction and a large recent exception, the two views below take one side of that each.
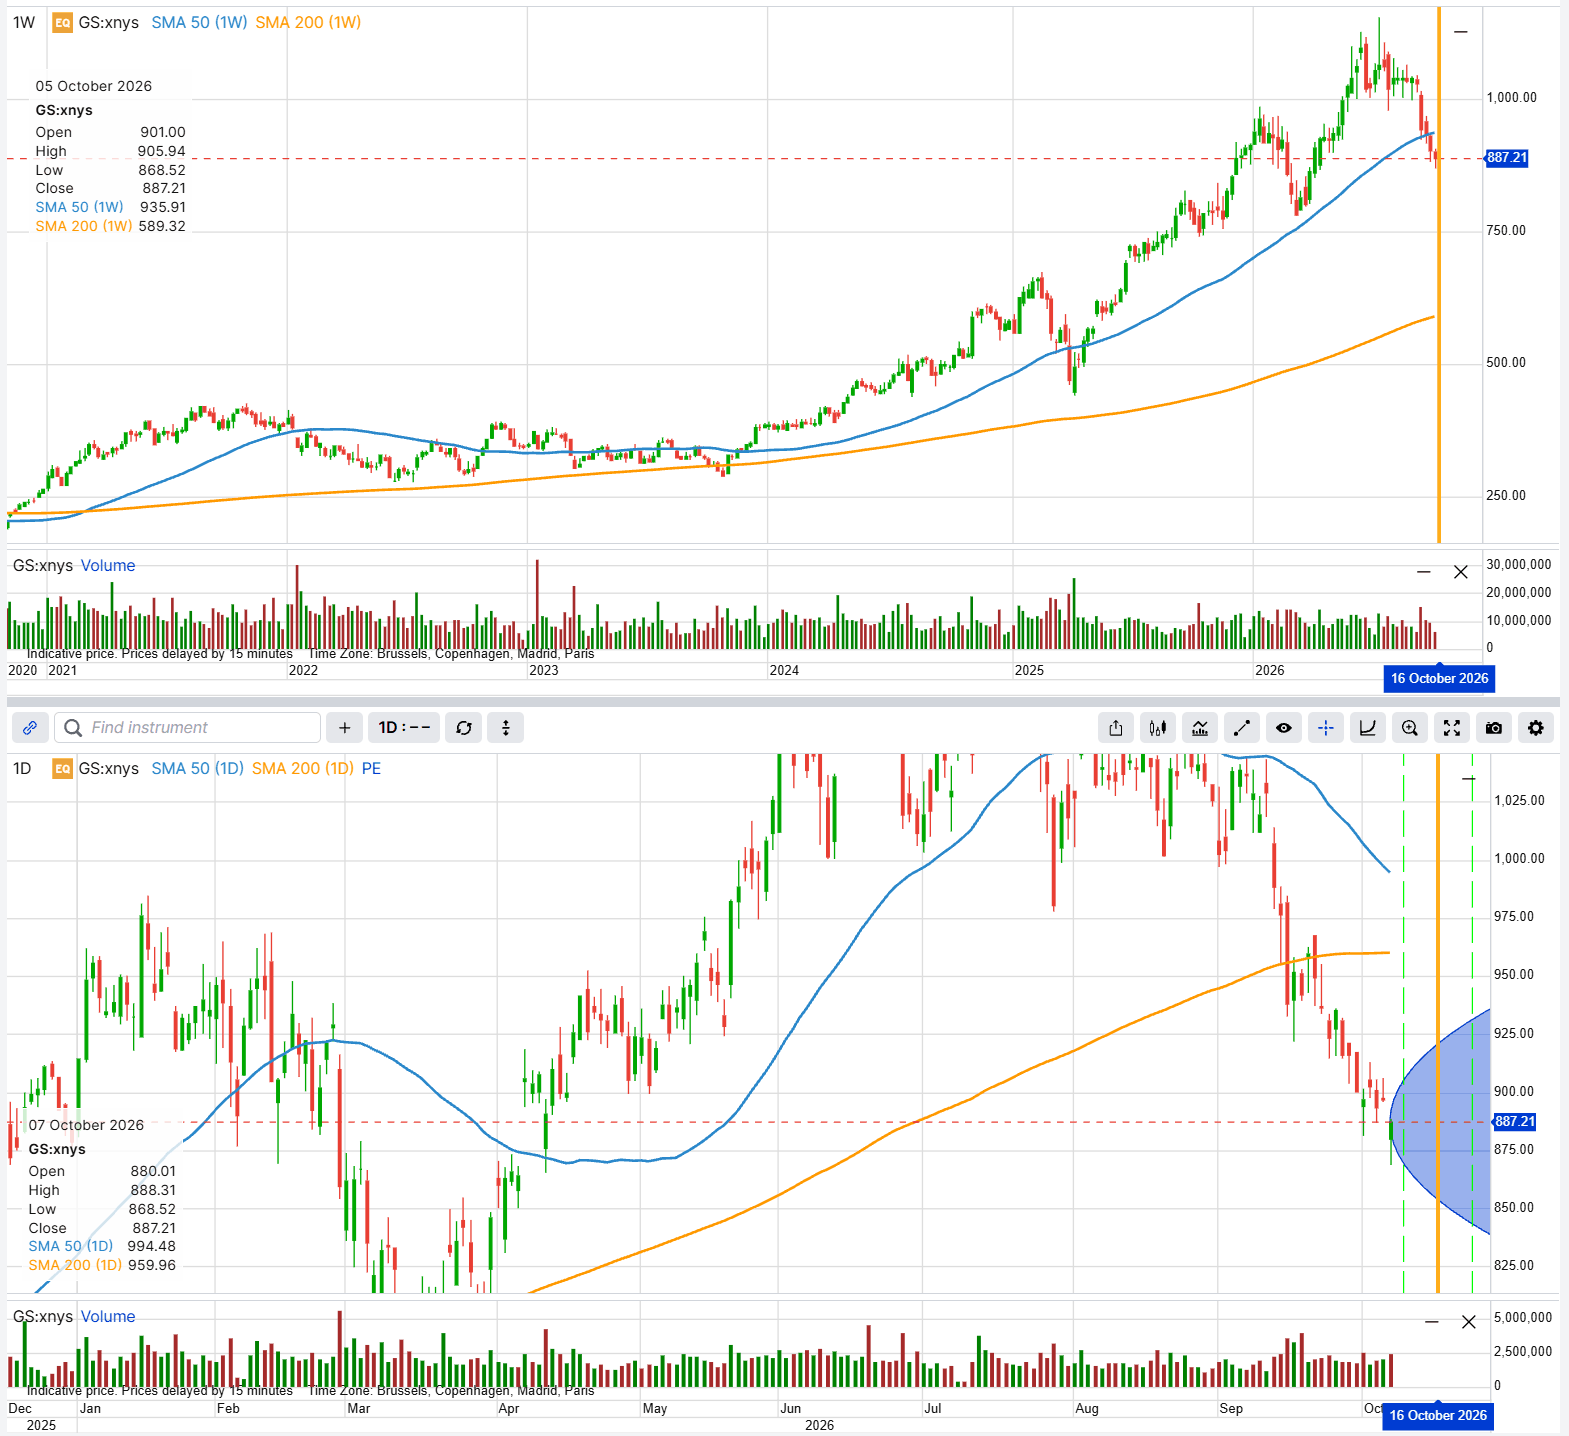 Goldman Sachs share price. Past performance is not indicative of future results; figures are illustrative and not predictive. Source: Saxo.
1. Iron condor: for a move smaller than priced (illustrative only, not a trade recommendation)
A reader who expects a reaction closer to the usual 2% than to the priced 4.7% could sell a put spread below the share price and a call spread above it. The position collects a credit up front and keeps it in full if the shares close between 845 and 930 at expiry. As long as the shares stay within that range, it may also benefit from the drop in implied volatility that usually follows a report, which lowers the value of the options sold. The risk sits outside that range: beyond either outer strike the loss is capped, but at about USD 1,386 per contract it is about 2.3 times the credit received. This is the classic trade-off of short-premium structures: frequent small gains against occasional larger losses.
- Sell 1 845 put at 6.275
- Buy 1 825 put at 2.91
- Sell 1 930 call at 6.325
- Buy 1 950 call at 3.55
- Net credit: approximately 6.14 per share, or USD 614 per contract
- Maximum loss: approximately USD 1,386; maximum gain: approximately USD 614
- Break-even at expiry: approximately 838.86, 936.14
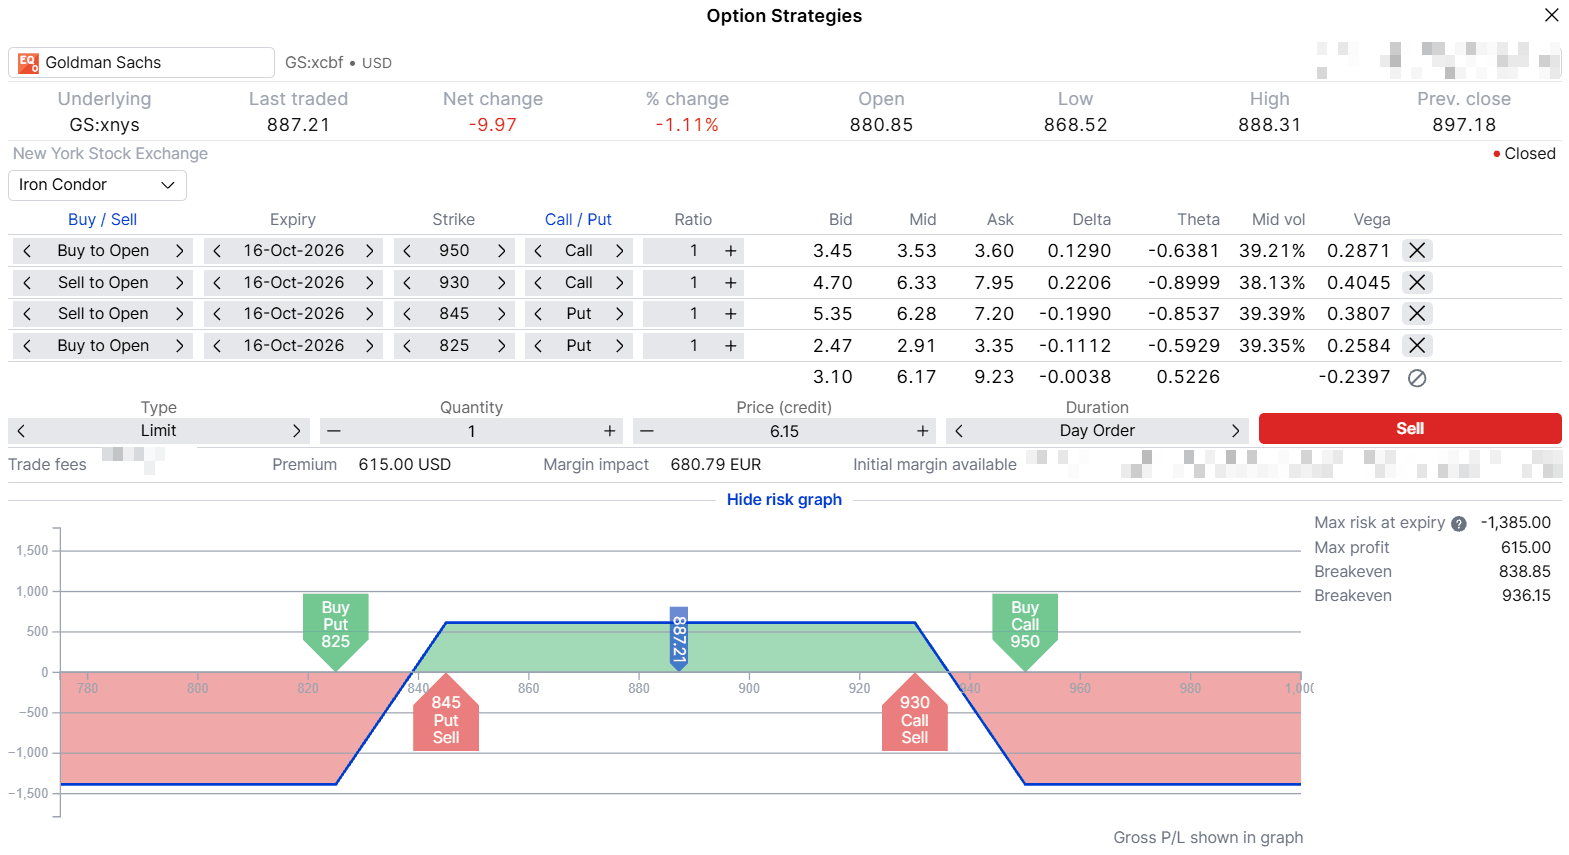 Strategy screen for the Goldman Sachs iron condor described above, 16 October 2026 expiry. Illustrative only, not a trade recommendation. Prices are indicative as of the US close on 7 October 2026 and will differ. Past performance is not indicative of future results; figures are illustrative and not predictive. Source: SaxoTrader.
2. Long strangle: for a move bigger than priced (illustrative only, not a trade recommendation)
A reader who sees the July 2026 reaction as a sign of what is possible could take the opposite side and buy an out-of-the-money call and an out-of-the-money put. The strangle costs about USD 2,508 per contract, which is also the maximum loss if the shares close between the two strikes. It starts to gain only if the shares close beyond 839.93 or 932.58, a move of roughly 5.3% either way, and the fall in implied volatility after the report works against it. Goldman Sachs quotes were noticeably wider than the other banks’ at the time of writing, which adds to the cost of entering and exiting.
- Buy 1 907.5 call at 13.925
- Buy 1 865 put at 11.15
- Net debit: approximately 25.07 per share, or USD 2,508 per contract
- Maximum loss: approximately USD 2,508; maximum gain: not capped
- Break-even at expiry: approximately 839.93, 932.58
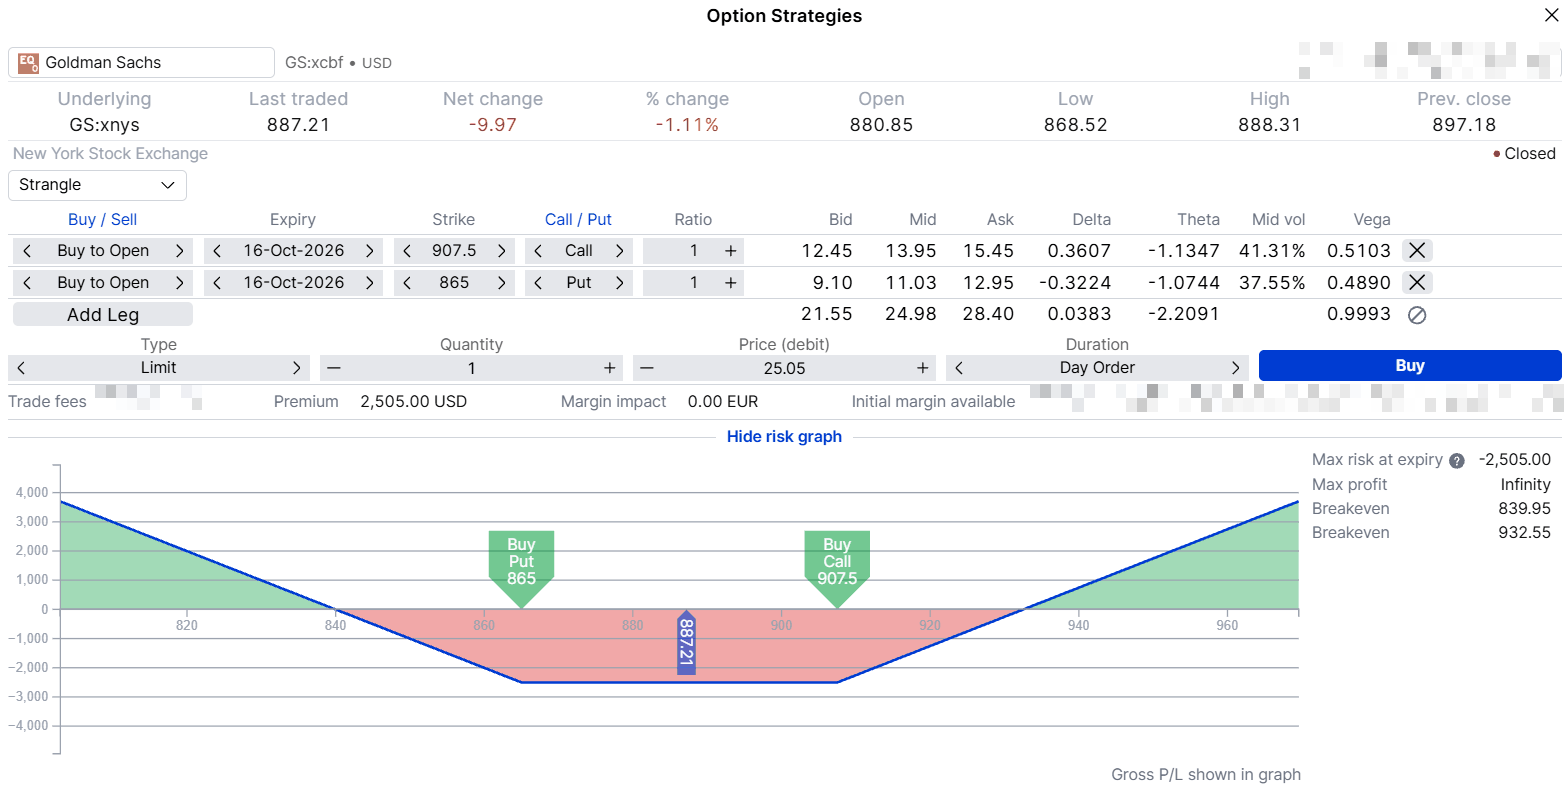 Strategy screen for the Goldman Sachs long strangle described above, 16 October 2026 expiry. Illustrative only, not a trade recommendation. Prices are indicative as of the US close on 7 October 2026 and will differ. Past performance is not indicative of future results; figures are illustrative and not predictive. Source: SaxoTrader.
Wells Fargo: priced at 0.9 times its usual move
Wells Fargo reports on 13 October 2026 and is the exception in this group. Options price a move of about 5.0% on a share price of 80.22, slightly less than its median reaction of 5.5% over the last eight reports, which is the largest of the six (Source: Saxo price data, author calculation). It is also the bank’s first full year without the asset cap that limited its balance sheet growth until 2025, which, in our view, may add to the range of possible outcomes. Here the two views split along the size of the move.
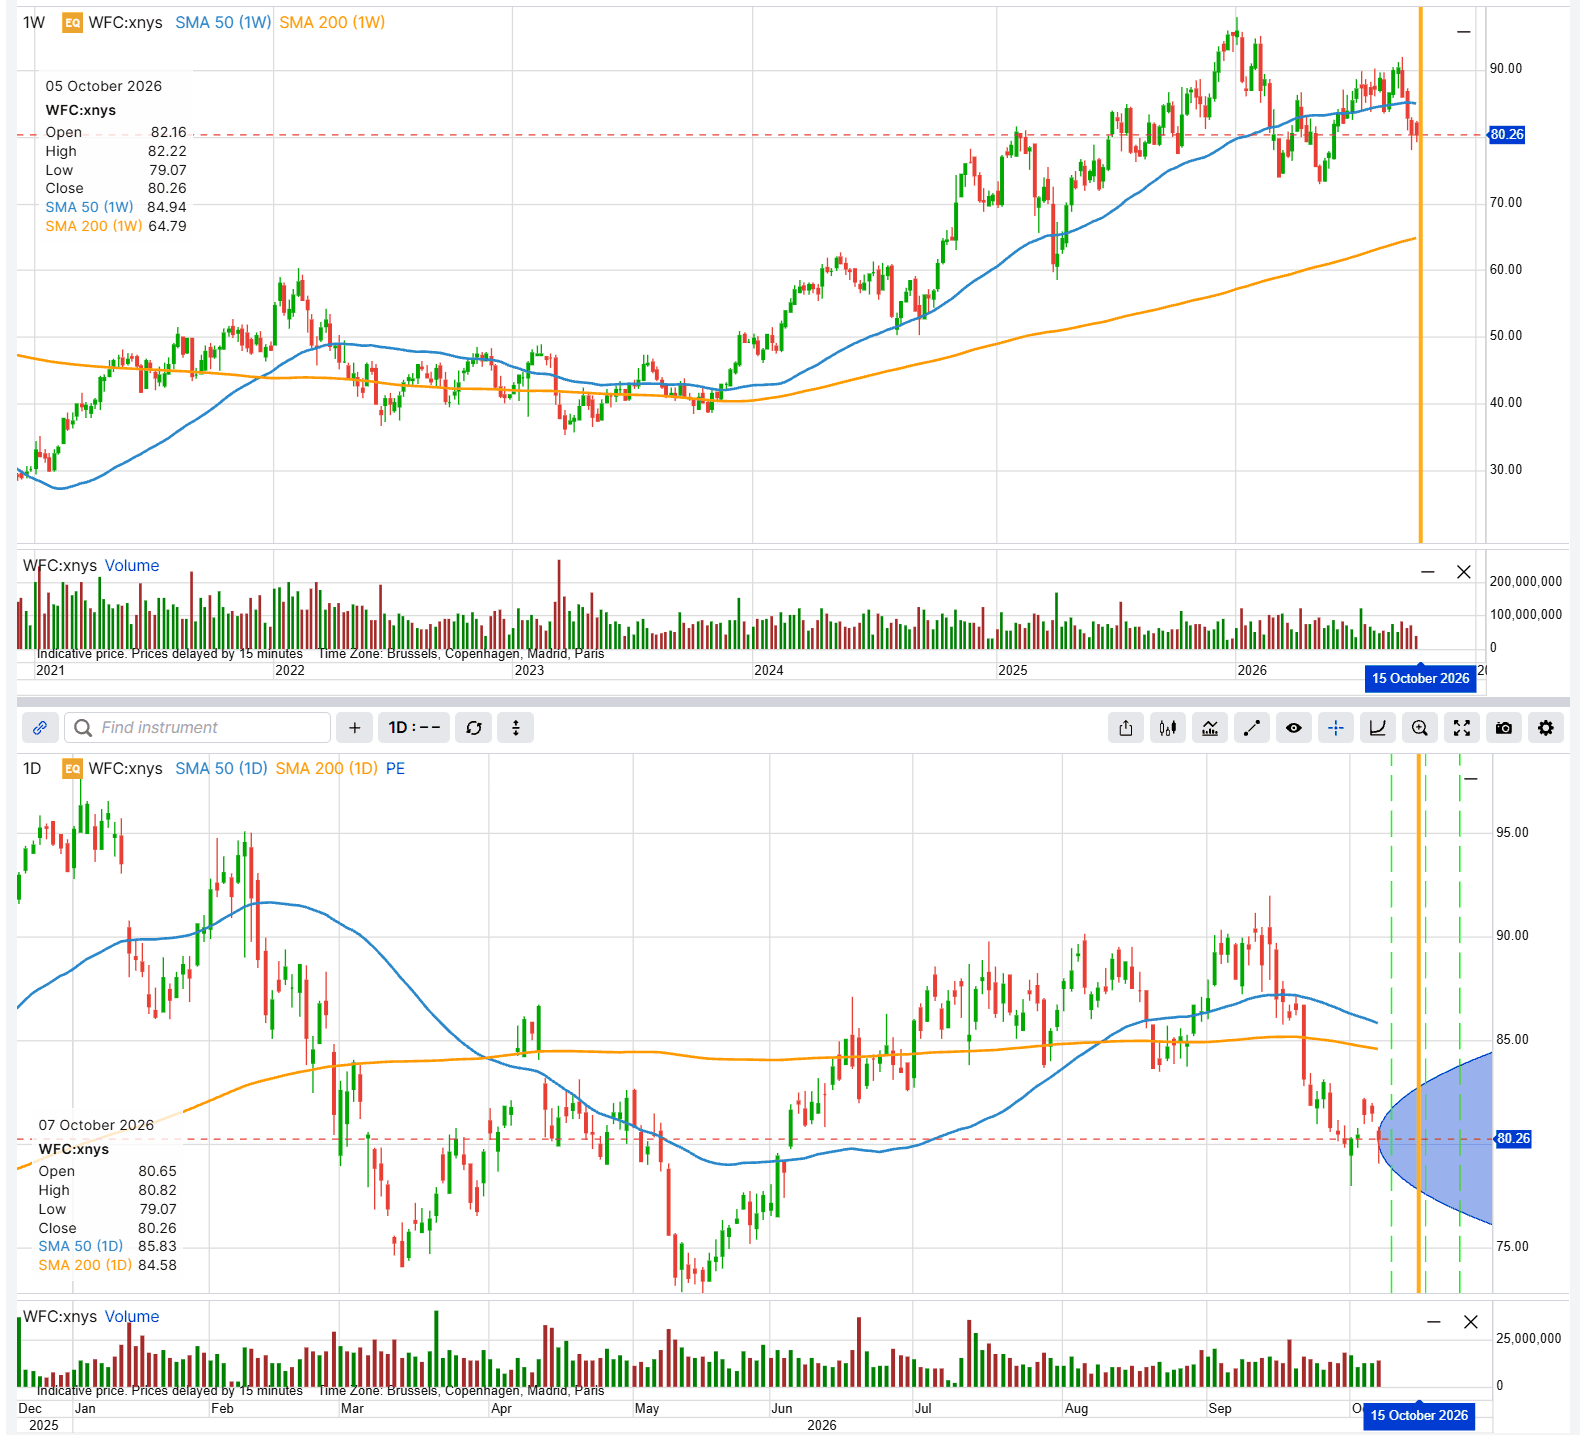 Wells Fargo share price. Past performance is not indicative of future results; figures are illustrative and not predictive. Source: Saxo.
1. Twin butterflies: for a move close to the usual size, in either direction (illustrative only, not a trade recommendation)
A long straddle buys any large move but is expensive. Two butterflies, one centred near 84 on the call side and one near 76 on the put side, target a move of roughly the priced size in either direction for a fraction of the cost: about USD 56 per set, which is also the maximum loss. The best case, about USD 144, needs the shares to finish near one of the two centres; a muted reaction or a very large one both lose the full cost. In practice the pair has six legs, while an order can hold at most four, so it is entered as two separate butterfly orders, each with its own bid/ask spread and its own commissions on every leg. On a structure this cheap, those costs take up a larger share of the potential gain than they would on a single option.
- Buy 1 82 call at 1.345
- Sell 2 84 call at 0.695
- Buy 1 86 call at 0.335
- Buy 1 78 put at 1.055
- Sell 2 76 put at 0.525
- Buy 1 74 put at 0.265
- Net debit: approximately 0.56 per share, or USD 56 per set (one contract per leg, entered as two orders)
- Maximum loss: approximately USD 56; maximum gain: approximately USD 144
- Break-even at expiry: approximately 74.56, 77.44, 82.56, 85.44
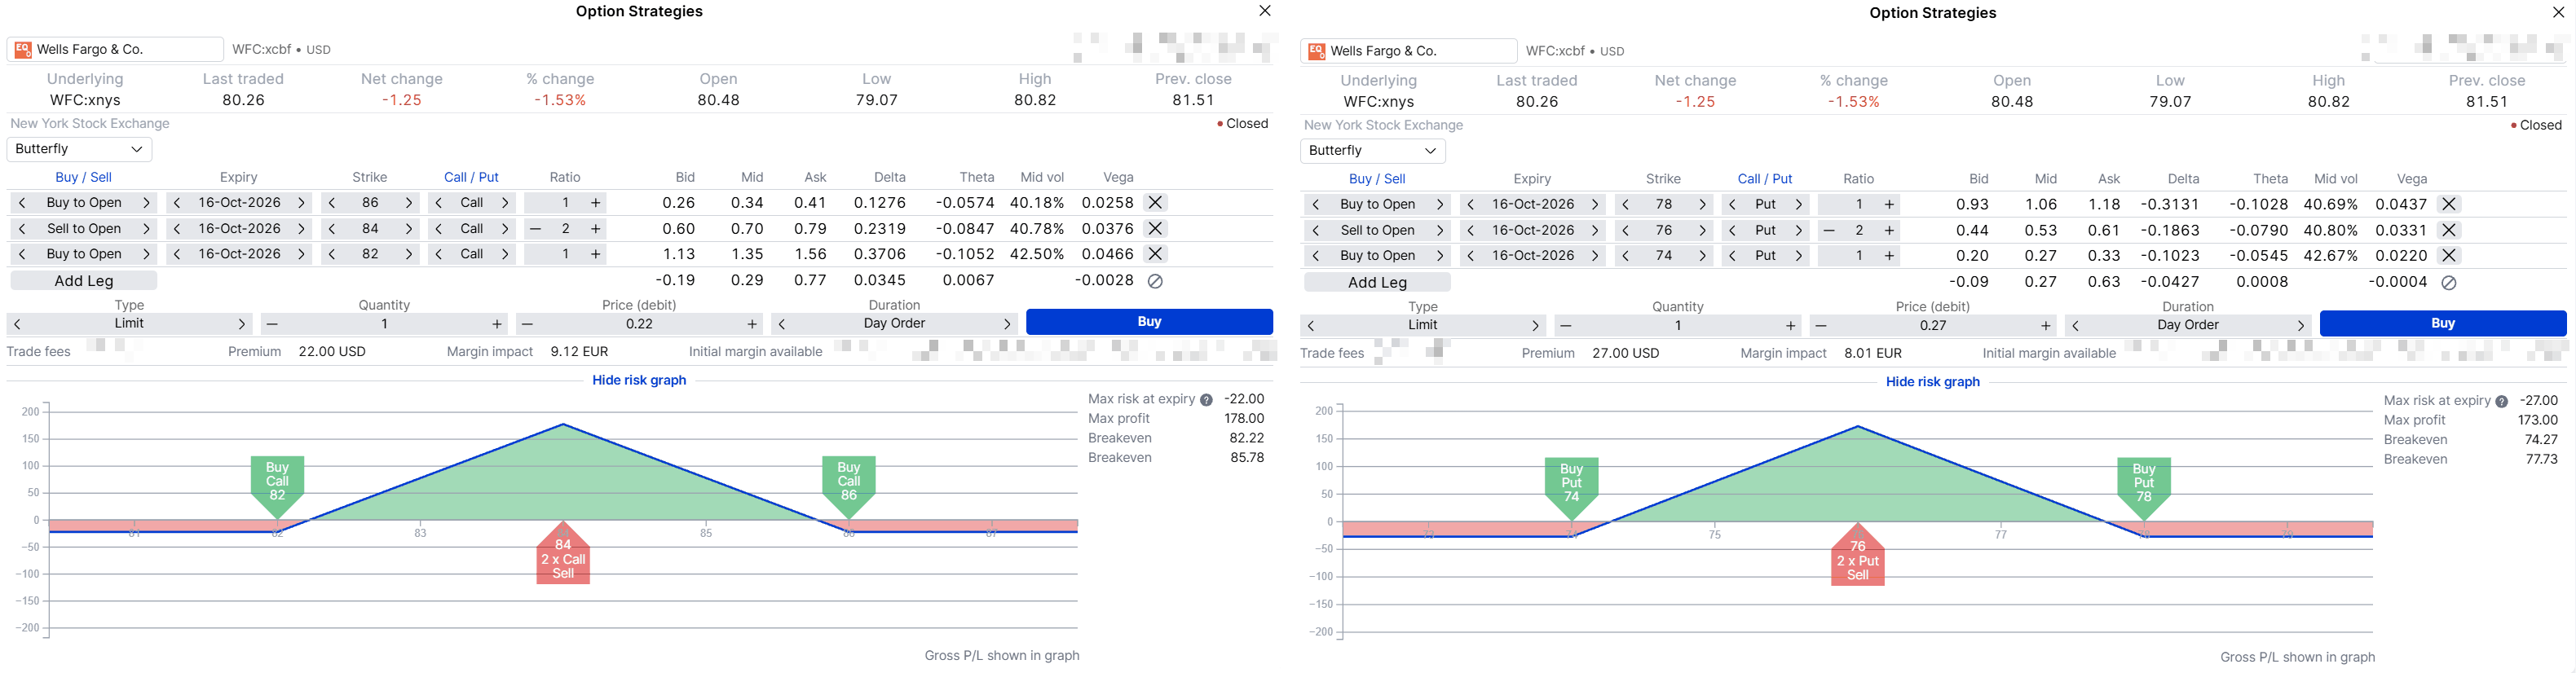 Strategy screens for the two Wells Fargo butterflies described above, entered as two separate orders, 16 October 2026 expiry. Illustrative only, not a trade recommendation. Prices are indicative as of the US close on 7 October 2026 and will differ. Past performance is not indicative of future results; figures are illustrative and not predictive. Source: SaxoTrader.
2. Iron condor: for a move smaller than priced (illustrative only, not a trade recommendation)
The opposite view, that Wells Fargo moves less than priced, can be expressed with an iron condor that sells the 76 put and 84 call and buys protection further out. It collects about USD 62 per contract and keeps it if the shares stay between 76 and 84, and while the shares stay in that range it may also benefit from the post-report drop in implied volatility. Given that this bank’s typical move is above the priced one, the loss of up to about USD 138 beyond the outer strikes deserves particular weight here.
- Sell 1 76 put at 0.525
- Buy 1 74 put at 0.265
- Sell 1 84 call at 0.695
- Buy 1 86 call at 0.335
- Net credit: approximately 0.62 per share, or USD 62 per contract
- Maximum loss: approximately USD 138; maximum gain: approximately USD 62
- Break-even at expiry: approximately 75.38, 84.62
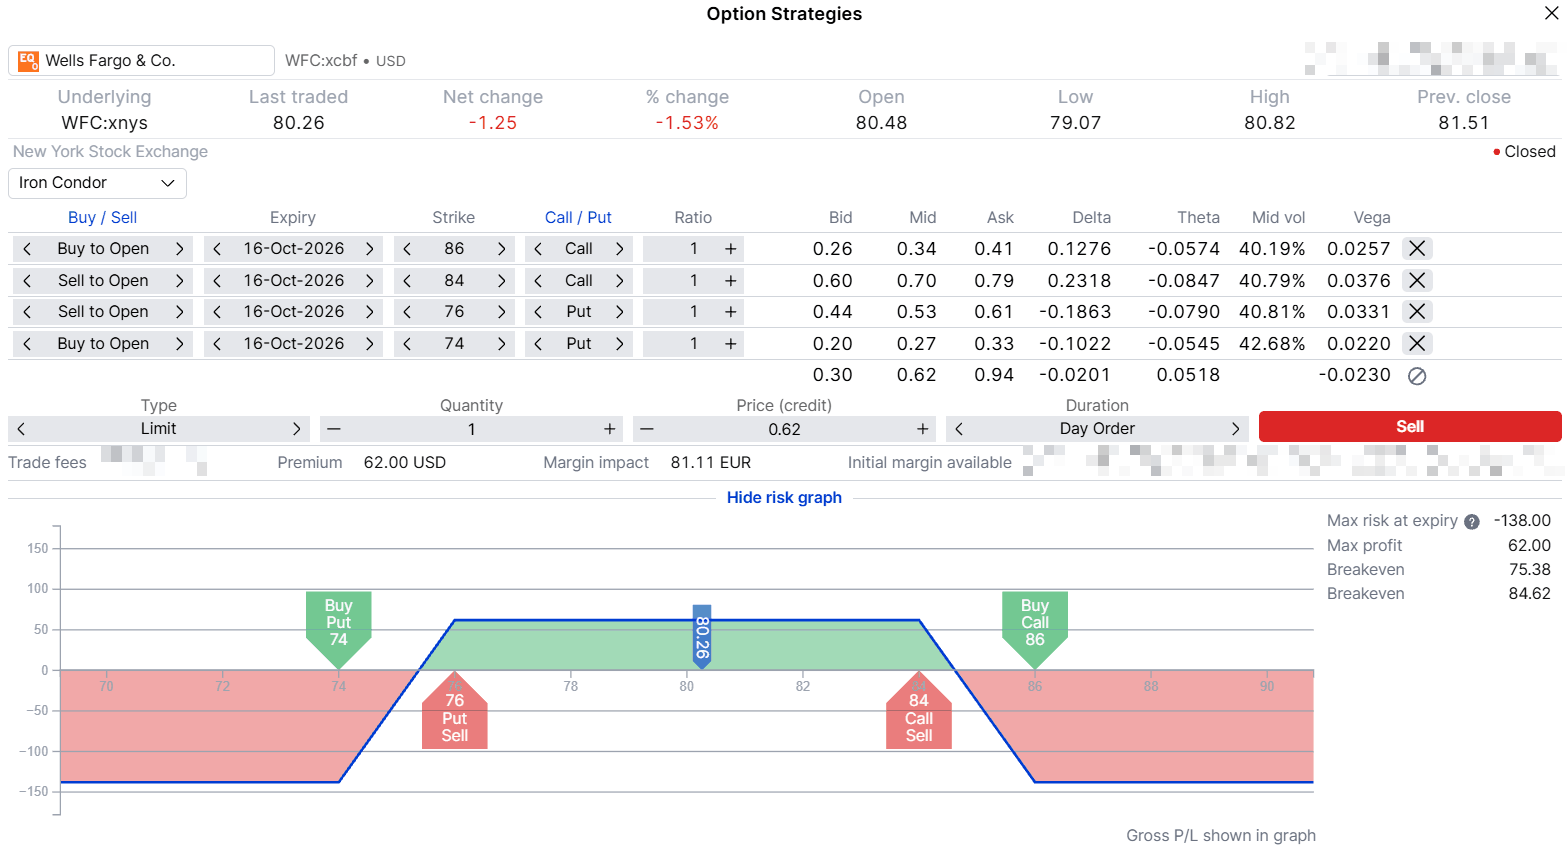 Strategy screen for the Wells Fargo iron condor described above, 16 October 2026 expiry. Illustrative only, not a trade recommendation. Prices are indicative as of the US close on 7 October 2026 and will differ. Past performance is not indicative of future results; figures are illustrative and not predictive. Source: SaxoTrader.
Before any position: practical points
- Costs add up with every leg. Commissions apply per leg and every leg crosses its own bid/ask spread, so a four-leg structure costs noticeably more to open and close than a single option. On wide quotes, a large part of the theoretical value can disappear at entry.
- Four legs per order. A multi-leg order holds at most four legs; anything larger, such as the twin butterflies, is entered as separate orders.
- Timing. Both banks report before the US open, so the reaction appears in the opening price, before there is a chance to adjust.
- The exit. Whether to close after the report or hold to the 16 October 2026 expiry is easier to settle before the report than in the middle of the move.
- Assignment. US bank options are American-style. Short legs that move into the money can be assigned before expiry, most often in the last days before it.
Final thoughts
The six banks carry similar priced moves but quite different histories, with Goldman Sachs and Wells Fargo near the two ends. In our view, the more useful comparison is between each bank and itself rather than between the banks: it shows where the options market appears to price more movement than usual and where it prices less. It does not show which way any share will move. The same comparison can be made for the other four banks reporting that week, using the chart above as a starting point.
That is why both banks above have two examples rather than one. A reader who expects a small reaction and one who expects a large reaction can both find a defined-risk way to express that view, and both carry a maximum loss that is known before the trade is placed. Which, if either, fits depends on the reader’s own view, risk tolerance and the prices available at the time, which will differ from the indicative prices used here. Options carry a high risk of rapid loss and are not suitable for every investor.
The author does not hold positions in any of the instruments mentioned in this article. The Author is permitted to wait at least 24 hours from the time of the publication before they trade the instruments themselves.
| Related articles/content |
|---|
| Same coin different payoffs an options toolkit for earnings season | 7 Oct 2026 Earnings season is close to a coin flip The edge is in what happens next | 5 Oct 2026 Finding unusually expensive or cheap options in the Saxo screener | 18 Sep 2026 Implied volatility rank what it measures and what it misses | 11 Sep 2026 Nine prints later what Q2 earnings season taught us | 11 Aug 2026 What IV crush really means in practice reviewed version | 9 April 2026 Trading earnings with defined | 31 Mar 2026 |
| More from the author |
|---|