
You can access both of our platforms from a single Saxo account.

The front end drains, the tails do not - Options Brief - 20 October 2026

Summary: Index volatility gave back Friday’s spike in a single session, almost all of it at the very front of the curve. The tails did not follow and correlation barely moved. Something only half unwound.
Index volatility gave back Friday’s spike at the front of the curve, and almost nowhere else.
MARKET REGIME: NEUTRAL / CHOP | VIX 18.44 | TERM STRUCTURE: CONTANGO | SKEW: ELEVATED (161.86) | FRONT-MONTH VIX FUTURES: 18.670
Today in brief
The short version. The one-day volatility gauge more than halved, while the one-year measure, skew and implied correlation stayed near the top of their ranges. Hedging demand did not unwind.
Markets. Semiconductors ended an eight-session losing streak, their longest since 2008. The S&P 500 rose 0.41% to 7,690.73 and the Nasdaq 100 1.17%. In our view few stocks took part: the equal-weighted S&P fell 0.34%. Europe went the other way. The Stoxx 600 lost 0.80% with banks leading, and French political unrest pushed the German-French ten-year spread to 148 basis points, a fourteen-year high. This morning the Kospi is down 3.73%, Brent is near 110 and the US ten-year yield is at 5.13%.
Volatility curve. VIX1D fell 48.73% to 11.93, back under the VIX at 18.44, which ends Friday’s inversion. The one-year eased only to 22.30 and is still at the top of its sixty-session range. The October VIX future settles tomorrow.
Single names. The median US implied-volatility rank fell to 45.2 from 49.2, but median implied volatility barely moved. The index gauge dropped 7.75% while the typical name eased under half a percent, so the move was in correlation. In Europe the median rank rose to 48.3 from 43.5.
Flow. Most of it was structure (rolls, paired legs, collars) and gives no read on direction. The one consistent strand was hedging: puts were bought in defensive sector funds and in semiconductor funds.
This week’s range. One session in, the S&P 500 has used 26% of the 1.56% move priced for the week, roughly in line with the time gone. The VIX used 63% of its range, by falling. The band ends on 23 October, before the 28 October Fed decision.
Earnings and catalysts. Netflix reports tonight with the widest premium against its own history: 9.5% priced against a 7.1% eight-report average. Tesla is the opposite at 5.5% against 7.8%. It reports tomorrow with Meta, SAP, IBM and Texas Instruments. US housing starts at 14:30 CET are the main US release.
Looking back: Goldman Sachs. Ahead of the 13 October bank results, options priced Goldman between about 846 and 929 by expiry. The shares touched 931 on results morning and closed at 881.26. The priced range is about where the shares close, not the path they take, so it helps to decide before the report what triggers an exit: a touch of the strike, or a close beyond it.
What it adds up to. Today’s expiry prices 0.55%, the week’s 1.21%. In our view the front end has stopped paying for a session that never came. The VIX at 18.44 against realised volatility of 8.81% leaves a nine-point gap that the back of the curve has not closed.
That is the whole brief in one read. The sections below hold the detail behind each paragraph, with the charts, the full set of readings and the sources, for when you want to go deeper on one part.
Headline driver
Semiconductors ended an eight-session losing streak, the longest since 2008, after the sector had shed around 2.3 trillion dollars in market value. The Philadelphia semiconductor index rose 1.6% and Amazon 4.98% after a brokerage named it a top pick.
Europe went the other way. The Stoxx Europe 600 fell 0.80%, the DAX 1.18% and the CAC 40 1.11%, banks leading the losses, and French political unrest pushed the German-French ten-year spread to 148 basis points, its highest daily close in fourteen years.
In our view the rebound was narrow rather than broad. The equal-weighted S&P 500 fell 0.34% on a day the index rose 0.41%, so the recovery was carried by the same few names that had led the fall.
Market snapshot
Levels are as of the 06:00 CET snapshot on 20 October 2026. US and European figures are the Monday 19 October close, Asian figures Tuesday’s session.
- US (Monday 19 October close): S&P 500 7,690.73, up 0.41%. Nasdaq 100 29,529.34, up 1.17%. Dow 51,971.19, down 0.07%. The equal-weighted S&P fell 0.34% while the Russell 2000 fund rose 0.31%. Amazon gained 4.98%, Tesla 3.76% and Nvidia 1.38%; Meta fell 0.55%. Semiconductors rose 1.61% and technology 1.36%, utilities lost 2.01%.
- Europe (Monday 19 October close): Stoxx Europe 600 down 0.80% to 639.57, the DAX 1.18% to 25,319.77 and the Euro Stoxx 50 0.96%. Euro-zone banks fell 2.07%, the weakest line on the board.
- Asia (Tuesday session): the Kospi is down 3.73%, Samsung Electronics and SK Hynix still weighing. Hong Kong has reopened after Monday’s Chung Yeung holiday and trades about 1% lower.
- Commodities and rates: Brent trades near 110 after Monday’s rebound towards a five-month high on tightening control of the Strait of Hormuz. Spot gold is little changed near 4,135, down 0.6% on Monday. The ten-year Treasury yield rose nearly seven basis points to 5.14% and reads 5.127% now, the two-year 4.763%.
- Market regime: Neutral and choppy. VIX 18.44, 20-day realised volatility 8.81% and stable, the index 0.19% below its 50-day average.
Past performance is not indicative of future results. Source: Saxo, Bloomberg, CBOE.
Volatility surface
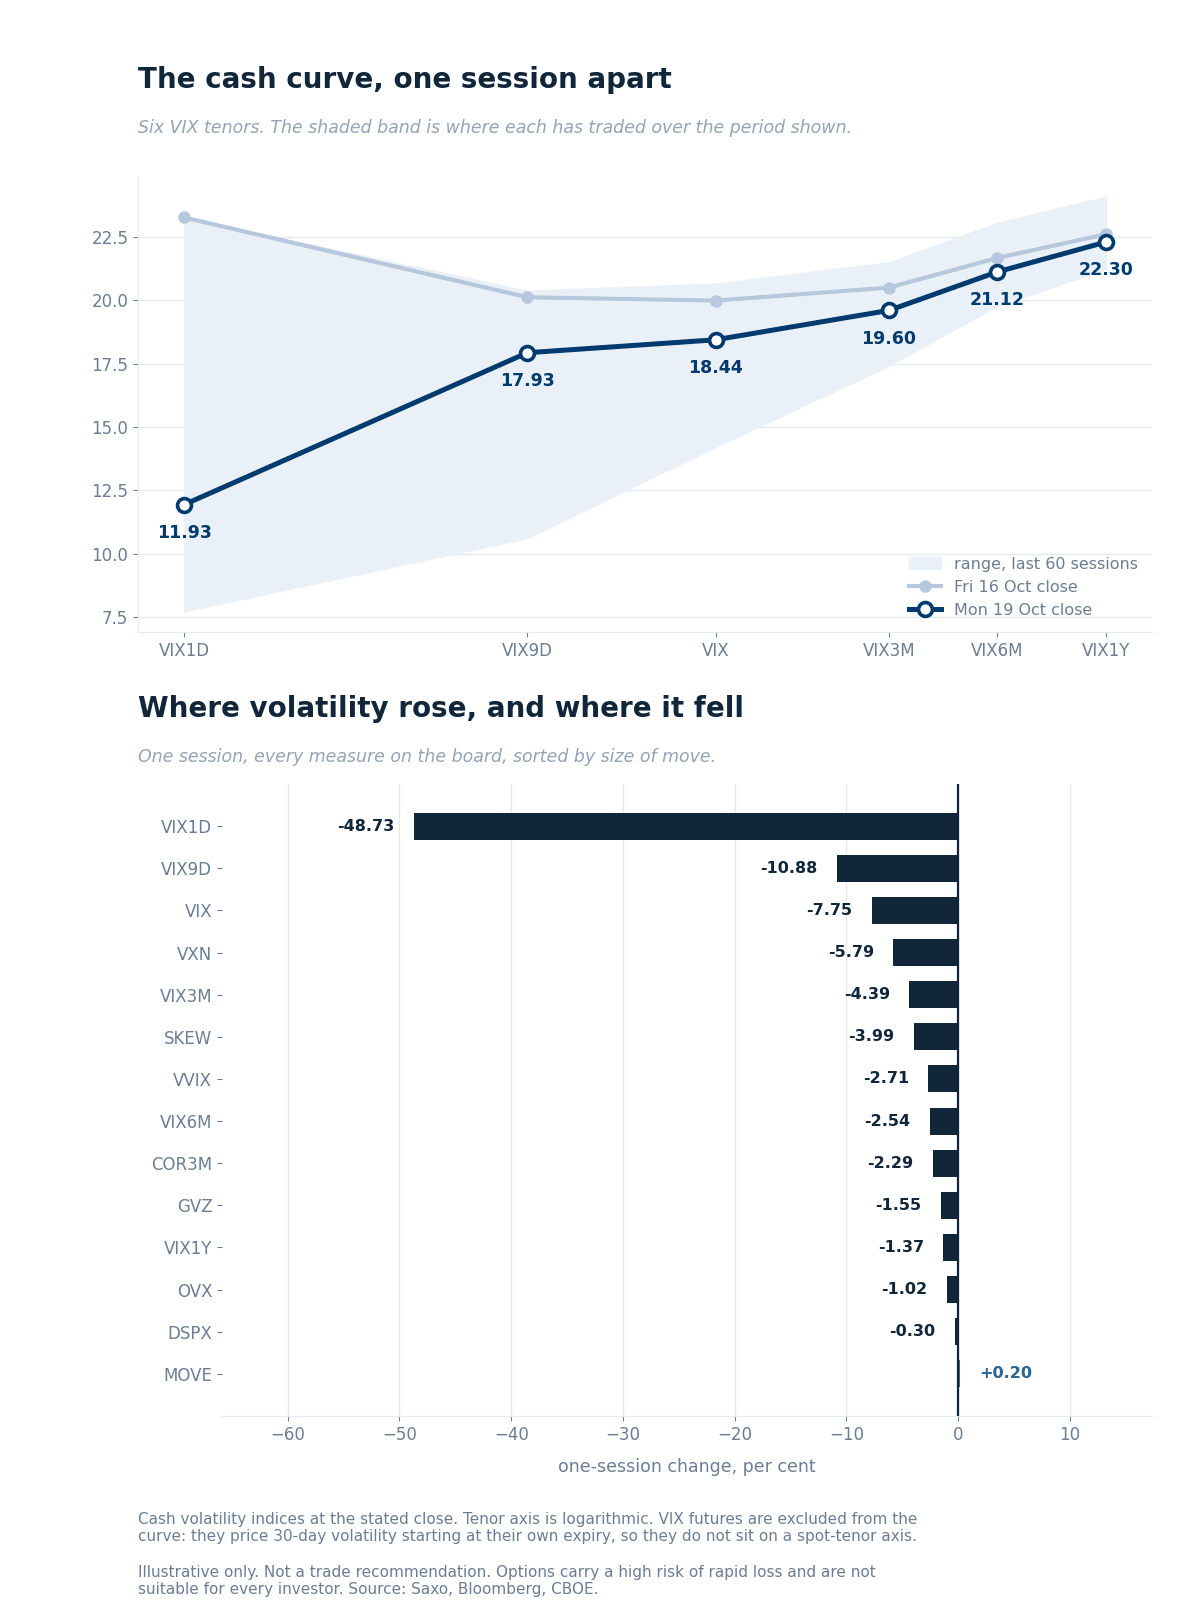
The cash curve against the previous session, over each tenor’s 60-session range, with the one-session change across every measure on the board. Source: Saxo, Bloomberg, CBOE.
The curve unwound its inversion in one session and did it from one end. VIX1D fell 11.34 points to 11.93 and the nine-day measure 2.19 to 17.93, both back under the thirty-day 18.44, while the one-year gave up 0.31 to 22.30. The one-year sits at the top of its sixty-session range and the one-day in the lower part of its own.
Ratios. VIX1D/VIX reads 0.65 against 1.16 a session ago, the inversion closing in one number. VIX3M/VIX rose to 1.06 from 1.03 as the front fell away from the back. VXN/VIX is 1.39 against 1.36, the Nasdaq gauge at 25.56.
VIX futures. The October contract reads 18.670 against spot at 18.44 and November 18.750, a front-month ratio of 0.995. The 21 October option expiry gives a parity forward of 18.225, consistent to 0.11 across the five nearest strikes on indicative pre-open quotes, a discount to spot of 0.215 against 0.12 a session ago. That contract settles tomorrow against a thirty-day window containing the 3 November midterm elections.
Rates and correlation. The bond gauge was the only measure on the board to rise, up 0.20% to 101.31. Oil volatility eased 1.02% to 50.22, still 2.72 times the equity gauge, and gold volatility 1.55% to 22.23. Three-month implied correlation fell 2.29% to 13.66, dispersion 0.30% to 36.50.
Single-name volatility
Saxo’s one-year implied-volatility ranks, read at Monday’s close across 187 US names, show the distribution sliding back down after Friday pushed it up.
- The rank gave back most of Friday’s move. On an identical set of names, the median rank fell to 45.2 from 49.2 while the median implied volatility moved only from 33.70% to 33.55%. The rise came without a rise in what the names cost, and so did the fall.
- Both ends reversed. Names above rank 70 fell from 19.8% of the set to 15.0%, and names below 20 rose from 10.2% to 11.2%. That is Friday’s slide up running backwards.
- The index moved more than its parts, again. Index implied volatility fell 7.75%. The typical single name eased by 0.15 of a volatility point, under half a percent, so almost all of the index move sits in the correlation term.
- Europe went the other way. Across 337 names on an identical set the median rank rose to 48.3 from 43.5 and the median implied volatility to 33.62% from 32.13%, with names above rank 70 up from 15.1% to 20.8%. That fits a session when European equities fell and banks led the losses.
Past performance is not indicative of future results. Source: Saxo.
Options flow sentiment
Based on end-of-day 19 October, yesterday’s positioning, not today’s price action.
Nine of the ten reports read as structure rather than conviction: rolls, paired legs, collars and mid-market prints, several carrying a conviction label of two out of five. Treat the session as unreadable on direction.
One strand is worth naming. Protection was bought rather than sold in the defensive sector funds, every ask-side print in the risk-off file was a put, and the staples fund was the most one-sided name in the set. Semiconductor fund flow was puts only and reads as hedging. Against that, upside in the long-dated Treasury fund was sold across several expiries. Hedging demand did not unwind with the front end.
Where the week's range sits
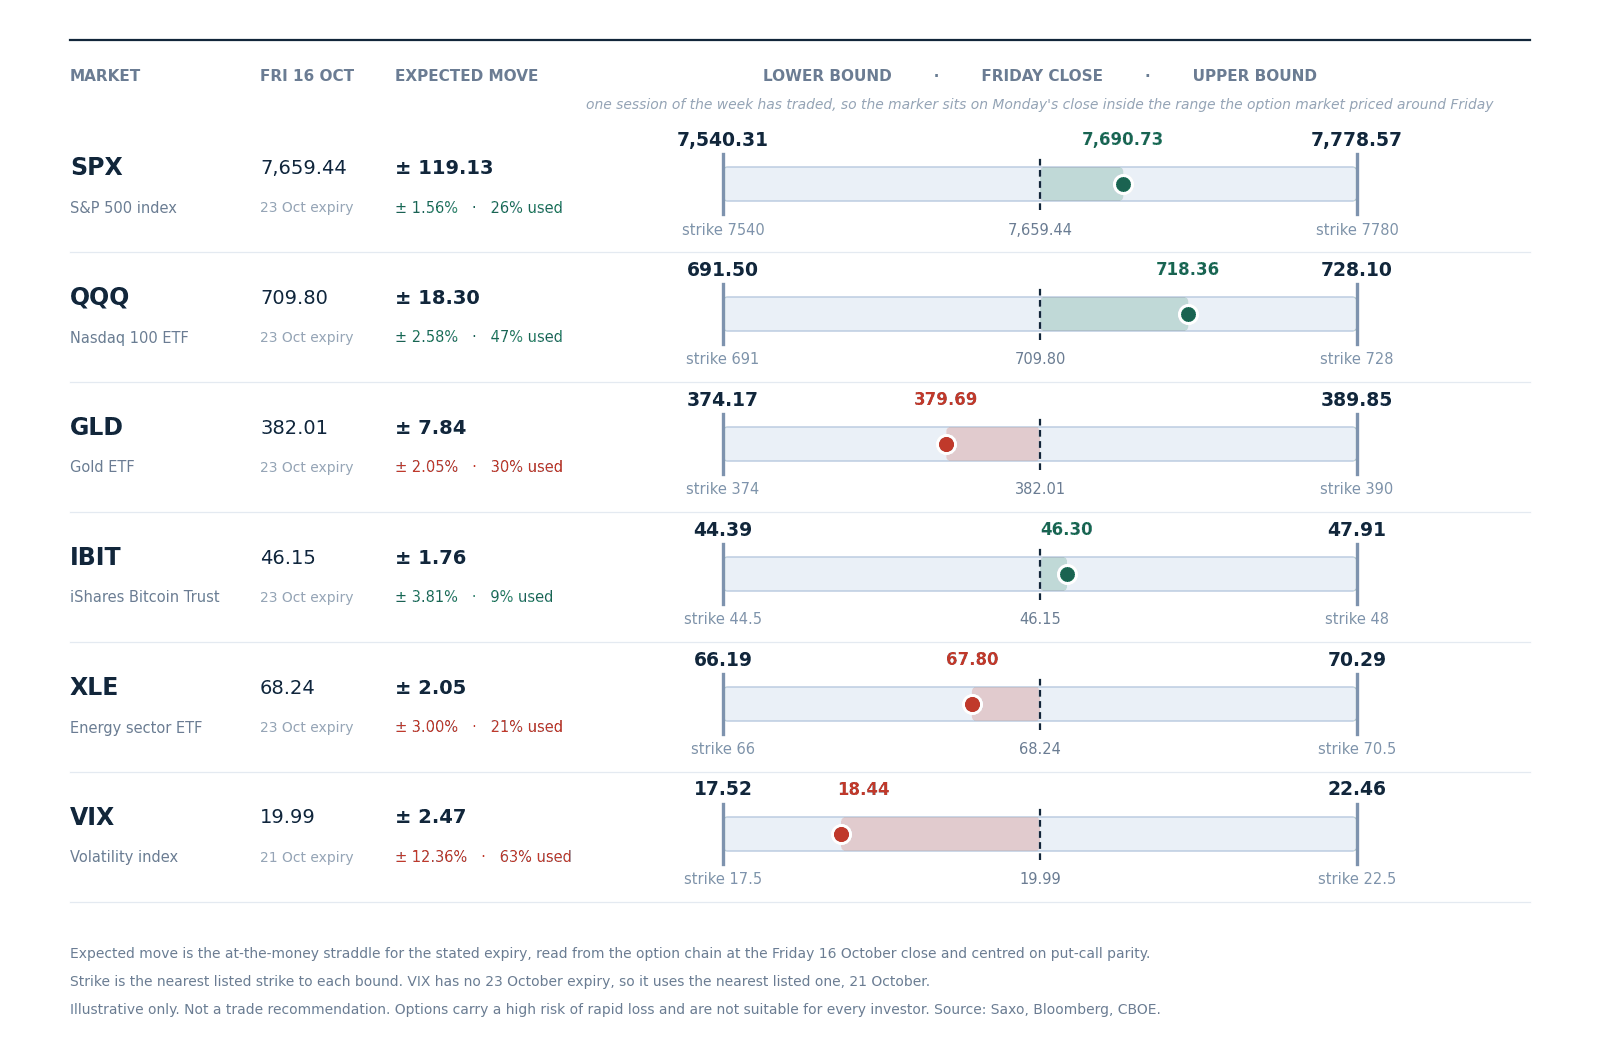
The range the option market priced for this week around Friday 16 October’s close, with the nearest listed strike at each bound. One session has traded, so the marker sits on Monday’s close. Straddles are read from the Saxo chain at Friday’s close and centred on put-call parity. Illustrative only, not a trade recommendation. Source: Saxo, Bloomberg, CBOE.
One session in, the S&P 500 has used 26% of the 119.13 points, 1.56%, priced around Friday’s close, against one of five sessions gone. It is spending its range at about the rate the option market allowed for.
The outlier is the volatility index, which used 63% of its priced week in one session, and did so by falling. The Nasdaq 100 fund has used 47%, gold 30%, energy 21% and the bitcoin fund 9%.
The 23 October expiry stops before the 28 October Federal Reserve decision, so none of the band pays for it. The VIX row uses the 21 October expiry, covering today and tomorrow.
Options carry a high risk of rapid loss and are not suitable for every investor. Costs and charges apply and vary by account and venue; check the rates applicable to you before entering any position.
Today's catalysts
- UK labour market data at 08:00 CET and the German ZEW survey at 11:00, the European releases of note.
- US housing starts and building permits at 14:30 CET, with weekly ADP employment at 14:15. They follow builder sentiment falling to 29 in October from 32, its lowest since June 2012, with price cuts now running at 43% of builders.
- The Federal Reserve is in blackout before the 28 October decision.
- Earnings today: Netflix after the US cash close at 22:00 CET, with GE Aerospace, General Motors, RTX, 3M, Intuitive Surgical, Capital One and United Airlines during the session.
- Tomorrow: Meta, Tesla, SAP, IBM and Texas Instruments.
Earnings scorecard
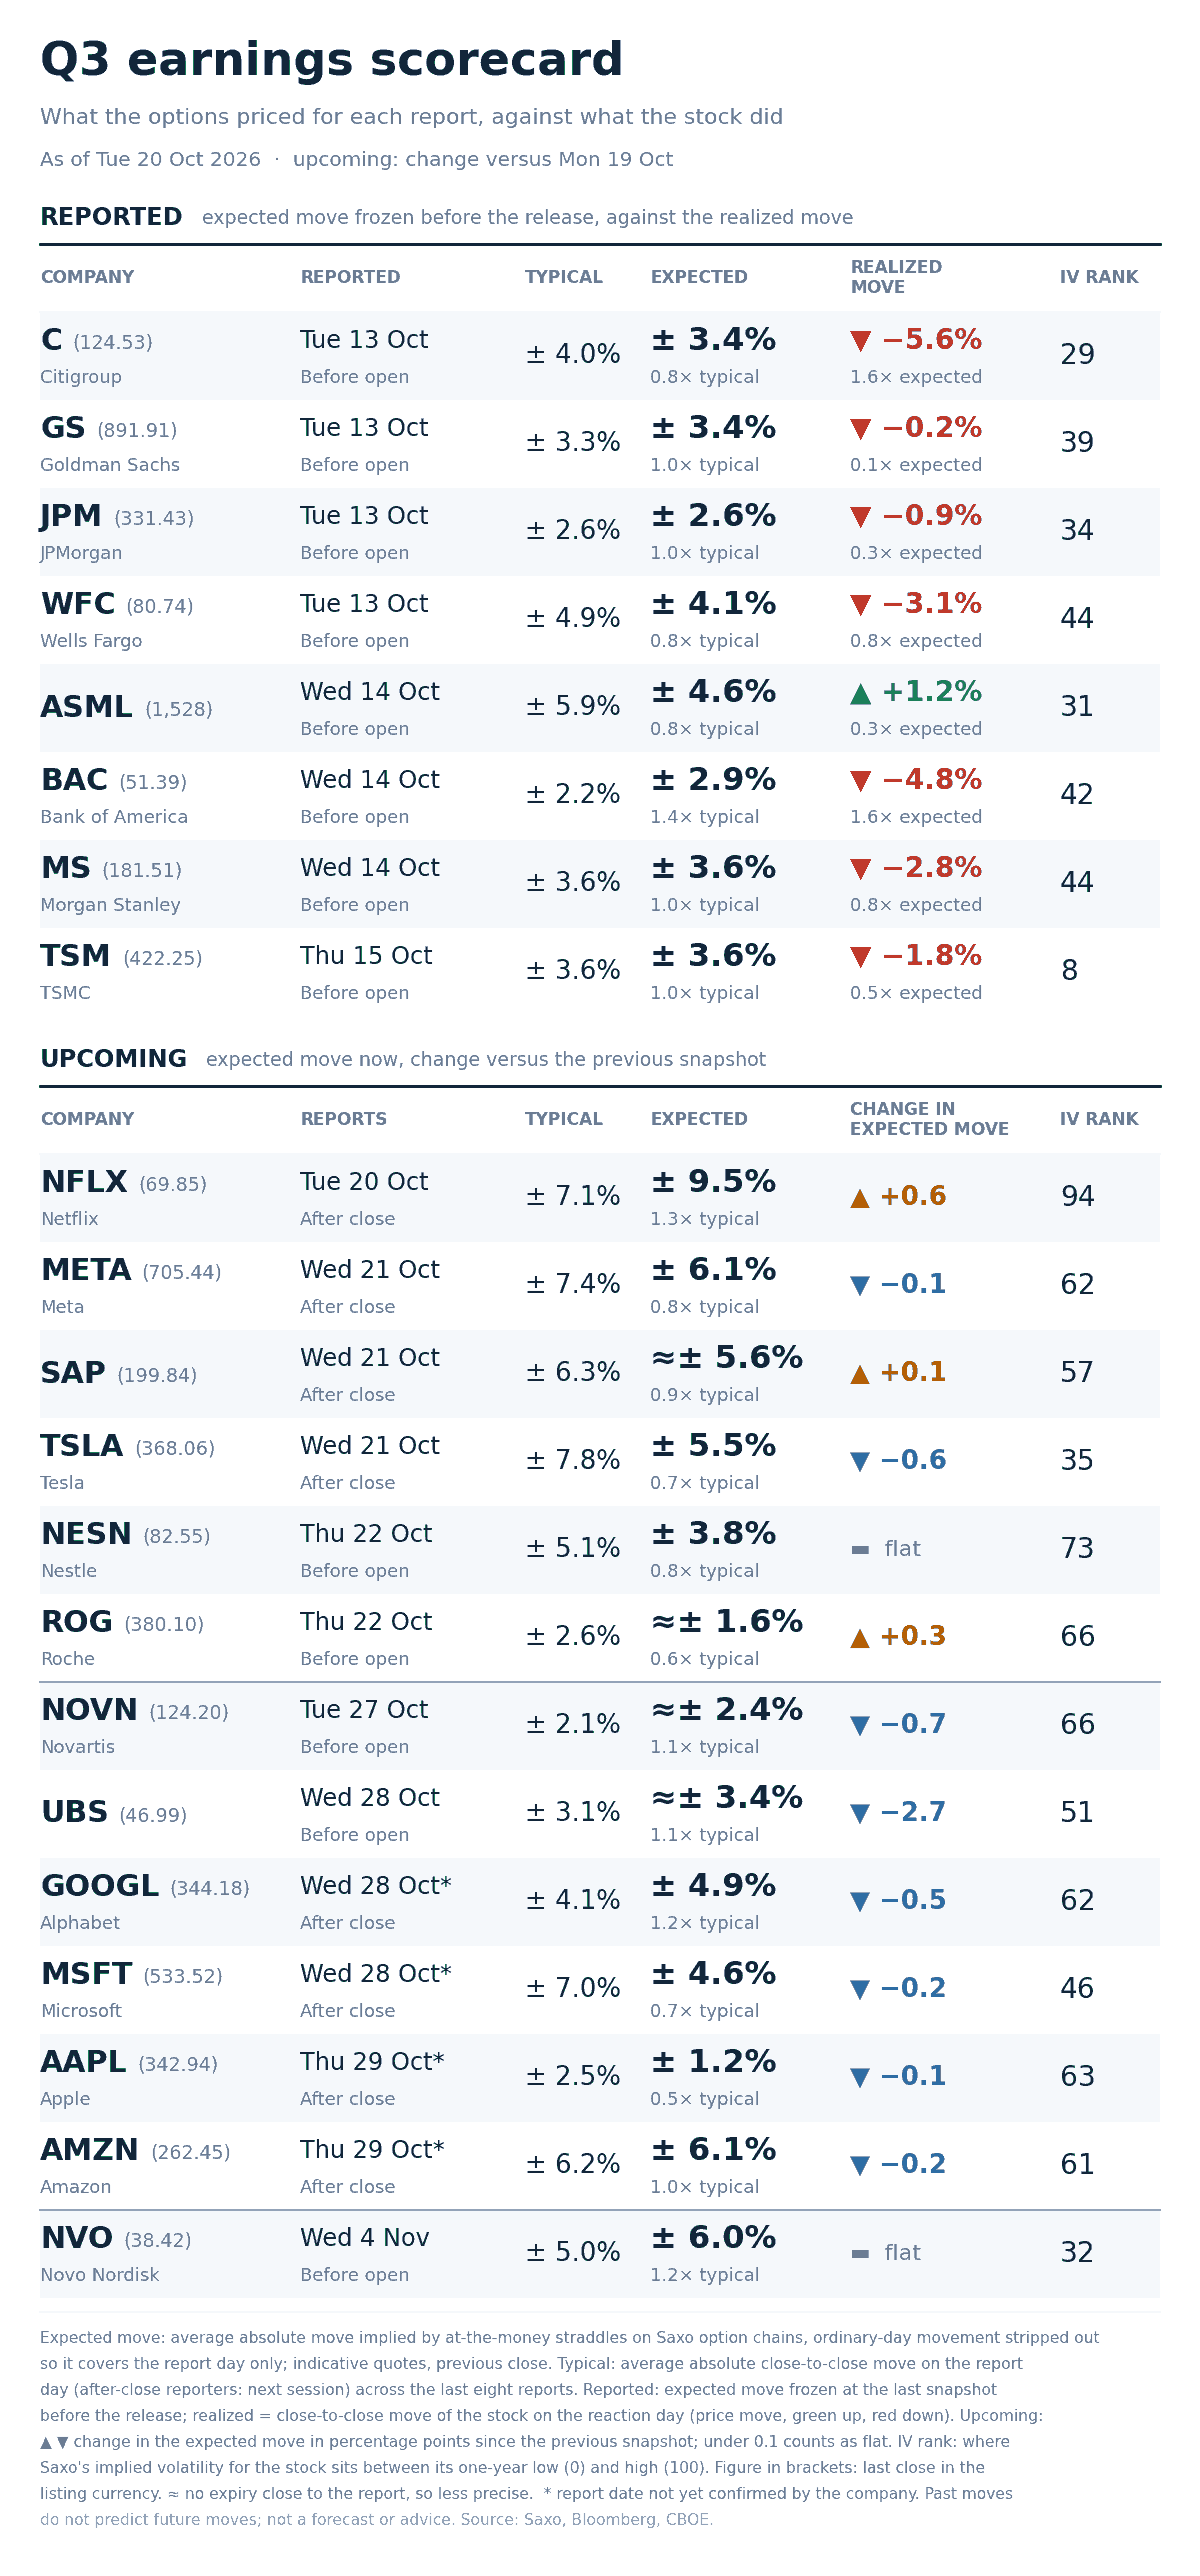
Option-implied expected move for each report day against the average move after the last eight reports, as of 20 October 2026. Illustrative only, not a trade recommendation. Source: Saxo, Bloomberg, CBOE.
- Netflix carries the widest premium against its own history and reports tonight. It prices 9.5% against a 7.1% eight-report average, 1.3x, up 0.6 points on the session. Alphabet is next at 4.9% against 4.1%.
- Rank and event premium answer different questions. Netflix carries an implied-volatility rank of 94 and the board’s highest expected move. Tesla carries 35 and prices 5.5% against a 7.8% average, 0.7x, reporting tomorrow.
What the options market taught us: Goldman Sachs
Before the US banks reported on 13 October, we looked at what options were pricing for Goldman Sachs and Wells Fargo. Goldman Sachs had the more useful lesson, and it came on results morning.
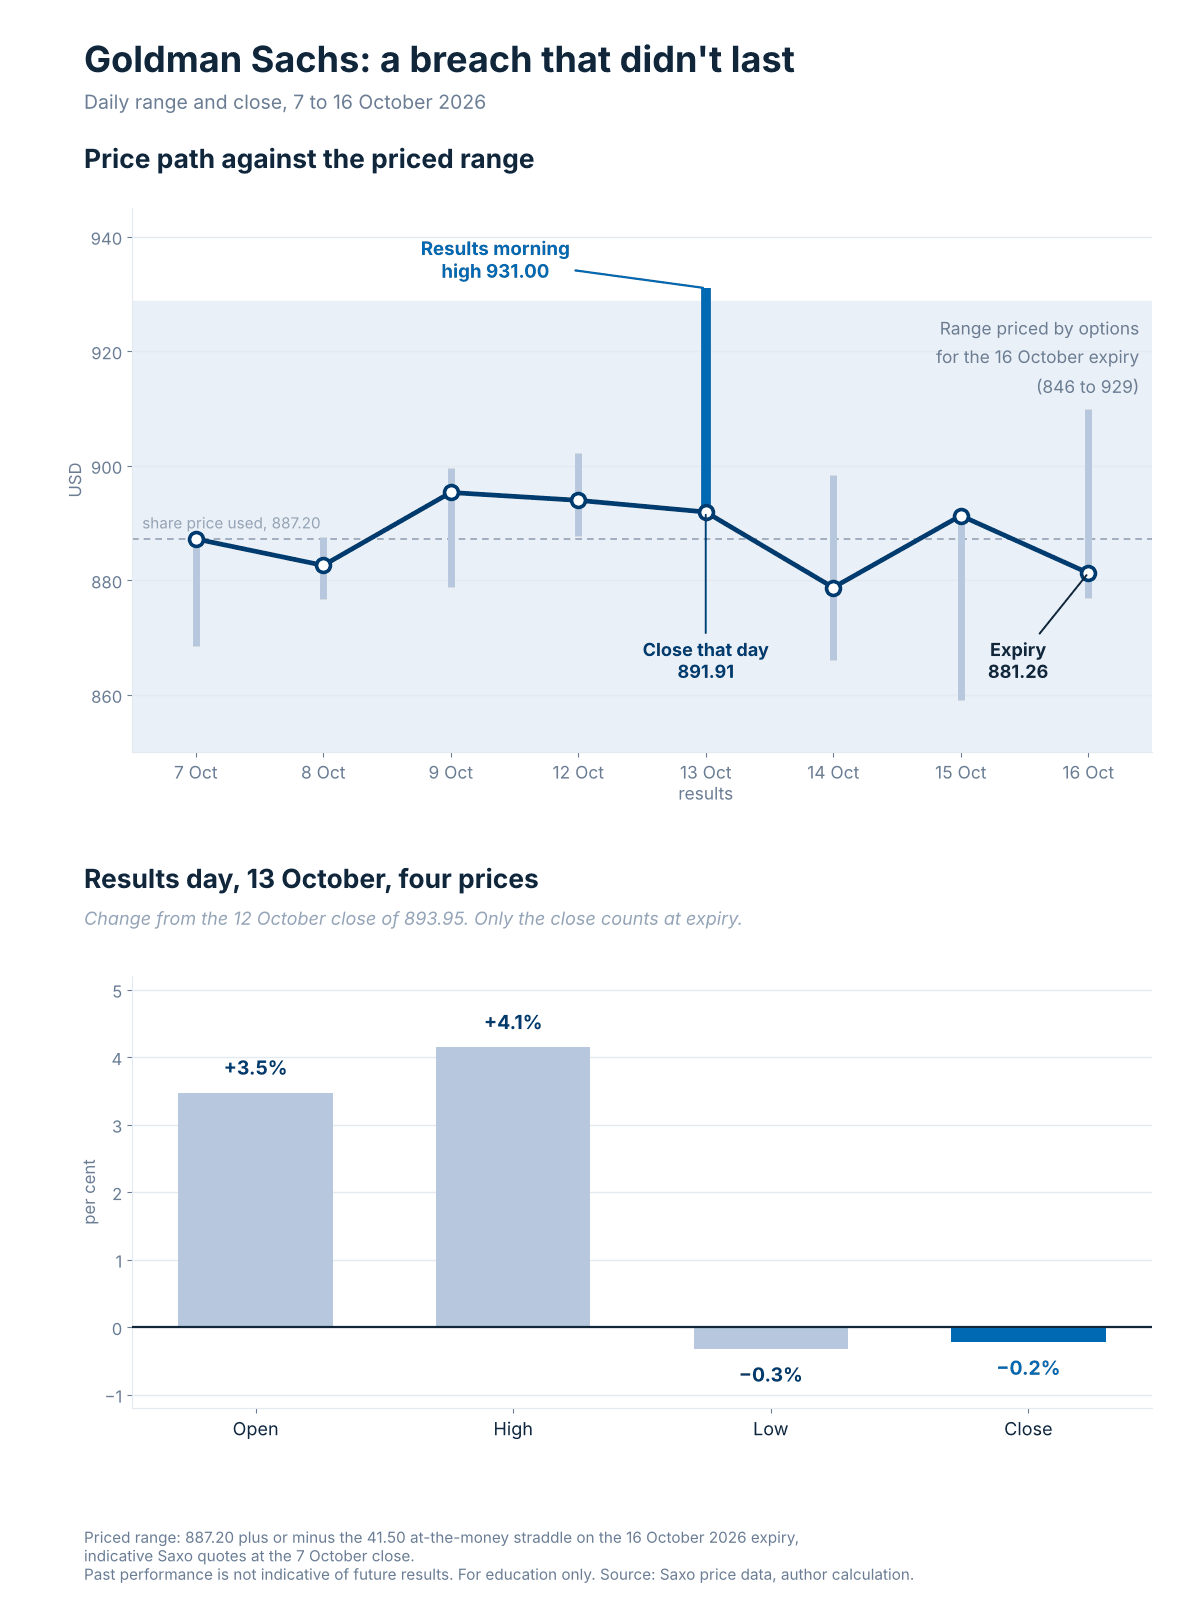
Goldman Sachs daily range and close from 7 to 16 October 2026, against the range options priced for the 16 October expiry, and the results-day open, high, low and close against the previous close. Past performance is not indicative of future results. For education only. Source: Saxo price data, author calculation.
- The priced range: options priced Goldman Sachs between roughly 846 and 929 by the 16 October expiry.
- Results morning: the shares opened 3.5% higher and reached 931, just above that range.
- Expiry: the shares closed at 881.26, well inside it.
The priced range measures where the shares close at expiry, not where they trade along the way. An option sold at the 930 strike was briefly in the money that morning and out of the money again by the close. So it helps to decide before the report what triggers an exit: a touch of the strike, or a close beyond it.
- Next up: Meta, SAP and Tesla on 21 October, Nestle and Roche on 22.
Options carry a high risk of rapid loss and are not suitable for every investor. Costs and charges apply and vary by account and venue; check the rates applicable to you before entering any position.
What the market is pricing
- Session implied range: today’s expiry prices 42.1 index points, 0.55%, against 61.5 points and 0.80% on Monday.
- Event implied range: the 23 October expiry prices 92.9 points, 1.21%, against 118.3 a session ago with five sessions to run and four now. Decay alone leaves about 106, so roughly 13 points came out beyond the clock, the mirror of Monday’s 27 going in.
- Correlation read: implied correlation fell 2.29% to 13.66 while the index gauge fell 7.75%, so the index gave back more than the input that drove it up. Correlation sits near the top of its stored range.
- Tail risk signal: SKEW fell 3.99% to 161.86 and the tail-risk gauge 16.94% to 20.32. Far downside is cheaper than Friday, dearer than any stored session before last week.
In our view the question is what the front end had been paying for. VIX1D at 23.27 on Friday priced a session that did not arrive, and at 11.93 it is back to early-October levels, into an evening carrying the board’s widest single-name event premium. Index volatility at 18.44 against 20-day realised volatility of 8.81% leaves a nine-point gap the back of the curve has not closed.
Options carry a high risk of rapid loss and are not suitable for every investor. Costs and charges apply and vary by account and venue; check the rates applicable to you before entering any position. Past performance is not indicative of future results.
| More from the author |
|---|