
You can access both of our platforms from a single Saxo account.

SpaceX earnings: pricing a first print with no history

Summary: SpaceX reports as a listed company for the first time on 4 August, and the options market is charging about 156% implied volatility for the privilege. The trouble is there is nothing to compare that against.
Almost every earnings estimate leans on a base rate. What do you do when there isn’t one?
SPCX (Space Exploration Technologies Corp) listed on 12 June 2026 at an offer price of $135, closed its first session at $160.95, and reached $201.80 four sessions later. It closed at $116.41 on 28 July, which is 42.3% below that peak and 13.8% below the offer price (Source: Saxo price history, as of 28 July 2026 close). Past performance is not indicative of future results. The company is scheduled to report second-quarter results on 4 August 2026 after the US close, with the webcast at approximately 22:30 CET (Source: SpaceX investor relations, https://ir.spacex.com).
This will be its first report as a public company, so there is no record of how the stock reacts to a print and no history of what happens in the sessions afterwards. The chart makes the point on its own: with roughly thirty sessions of trading, SPCX does not yet have a 50-day moving average. For traders considering the event, the key question is whether the risk and reward justify a position at all, and if so, how to structure it with defined risk.
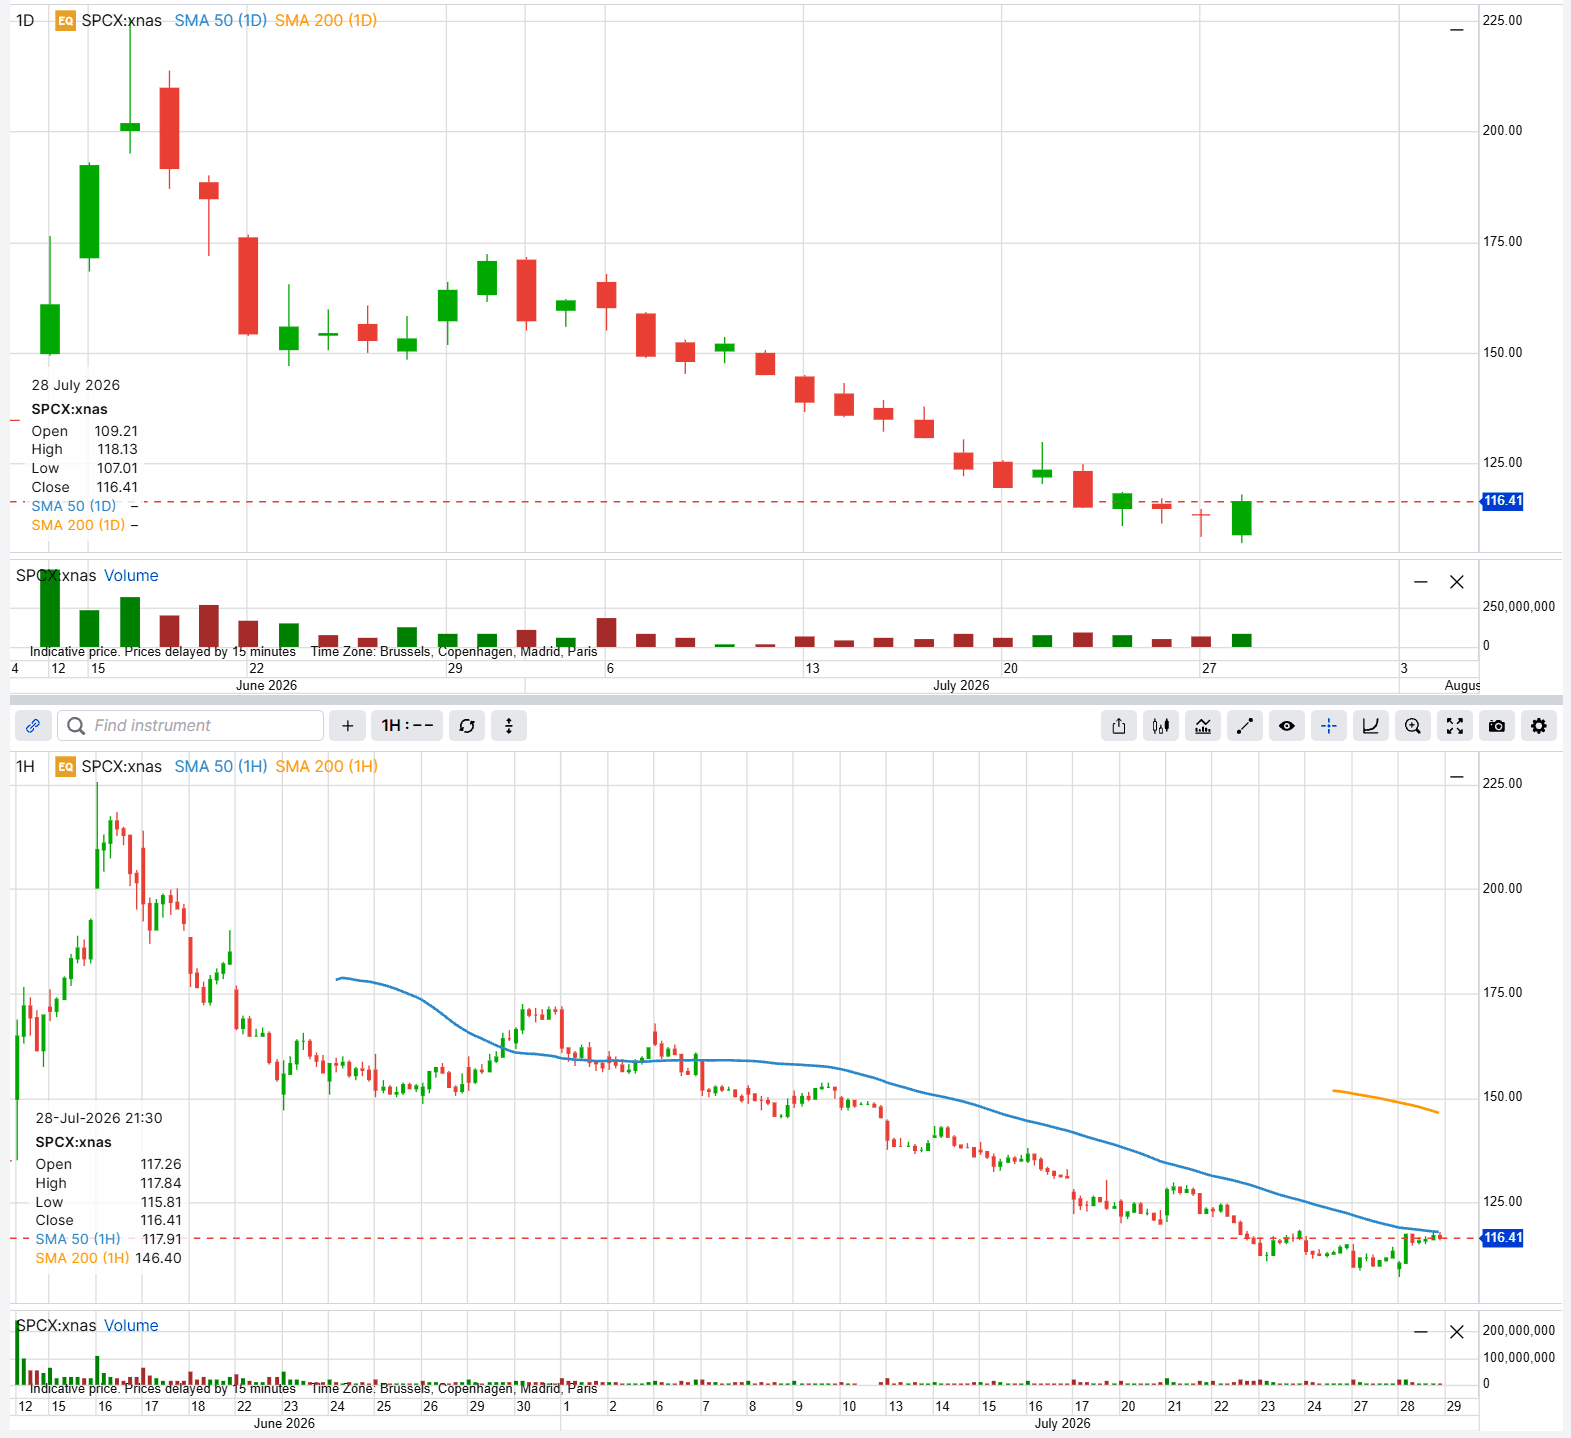 SPCX since listing. The daily moving averages return no value because the stock has too few sessions. Source: Saxo, as of 28 July 2026 close
Past performance is not indicative of future results; figures are illustrative and not predictive.
What you have instead of an earnings history
No base rate for earnings moves exists. Thirty sessions of price history do.
Measured close to close and annualised, SPCX has realised 95.3% volatility across its listed life. Three sessions in the opening fortnight carry most of that: +17.58% on 12 June, +17.90% on 15 June and -17.95% on 22 June. Excluding the listing period changes the picture materially. Over the last 20 sessions realised volatility is 59.4%, and over the last 10 it is 55.0% (Source: Saxo price history, as of 28 July 2026 close). That says nothing about earnings, but it does say what this stock has been doing lately.
A common way to estimate the market-implied move is to add the at-the-money call premium and the at-the-money put premium for the expiry capturing the event. That combined straddle price is a rough proxy for how much movement option buyers are paying for. On the 7 August 2026 expiry, the first Friday expiry falling after the print, the 116 call is quoted at a mid of about $11.65 and the 116 put at about $11.40. The straddle costs roughly $23.05, which against a $116.41 share price is a move of about 19.8% by 7 August (Source: Saxo option chain, indicative pre-open quotes as of 29 July 2026).
Recent realised volatility is near 55%. The 7 August expiry is pricing at-the-money implied volatility near 156%.
The premium sits on one expiry
At-the-money implied volatility by expiry, from the same chain snapshot (Source: Saxo option chain, indicative pre-open quotes as of 29 July 2026):
- 31 July, two sessions out and before the print: approximately 129%, an implied move of 8.2%
- 7 August, the first expiry after the print: approximately 156%, an implied move of 19.8%
- 21 August: approximately 122%
- 18 September: approximately 101%
Implied volatility does not fall away smoothly from the front. It rises into the expiry containing the event and declines on either side. In our view that hump is what a market with no reaction history may look like: lacking any way to judge how large the move should be, the premium collects on the single expiry carrying the risk rather than spreading along the curve.
All four structures below use that 7 August expiry, so the 19.8% implied move applies to each without adjustment. An implied move is derived from option pricing rather than a forecast, and future outcomes are uncertain and may result in losses. Options carry a high risk of rapid loss and are not suitable for every investor. See Saxo pricing for costs and applicable charges: https://www.home.saxo/rates-and-conditions/pricing-overview
Important note: The strategies and examples provided in this article are purely for educational purposes. They are intended to assist in shaping your thought process and should not be replicated or implemented without careful consideration. Every investor or trader must conduct their own due diligence and take into account their unique financial situation, risk tolerance, and investment objectives before making any decisions. Remember, investing in the stock market carries risk, and it’s crucial to make informed decisions.
Bullish to neutral view: selling the downside
Put implied volatility on the 7 August expiry sits near 156% at the money, and stays close to that level at every strike down to $90. Downside protection is expensive right across the range, not only near the current price. A trader who expects the eventual move to land inside that range may look at selling a defined-risk put spread rather than paying those levels for protection.
Example structure (illustrative only - not a trade recommendation)
- Sell 1 SPCX 7 August 2026 $100 put (mid about $4.40, delta -0.22, implied volatility about 156%)
- Buy 1 SPCX 7 August 2026 $90 put (mid about $1.95, delta -0.11, implied volatility about 156%)
- Net credit: approximately $2.45 = $4.40 taken in on the short $100 put, less $1.95 paid for the long $90 put
- Maximum risk: approximately $7.55, being the $10 spread width less the $2.45 credit
- Maximum profit: approximately $2.45
- Break-even at expiry: approximately $97.55, which is 16.2% below the 28 July close
Risk: the maximum loss is the $10 wing width less the $2.45 net credit; the short leg carries early-assignment risk. All figures are hypothetical and for education only. Costs and charges apply to each leg; see Saxo pricing for full details: https://www.home.saxo/rates-and-conditions/pricing-overview (Source: Saxo option chain, indicative pre-open quotes as of 29 July 2026)
The short $100 put carries the risk and generates the credit: the maximum loss of about $7.55 is reached if SPCX closes at or below $90 on 7 August, against a maximum gain of about $2.45 above $100. The long $90 put converts an open-ended obligation into that fixed $7.55 and consumes $1.95 of the $4.40 collected.
Strategy insight - read the short strike against the priced move. The maximum loss of roughly $7.55 arrives below $90, and the $100 short strike sits 14.1% below the 28 July close while the chain prices a move of 19.8%, so the market appears to treat a test of that strike as well within reach. That is the trade-off accepted for the $2.45 credit. Options carry a high risk of rapid loss and are not suitable for every investor.
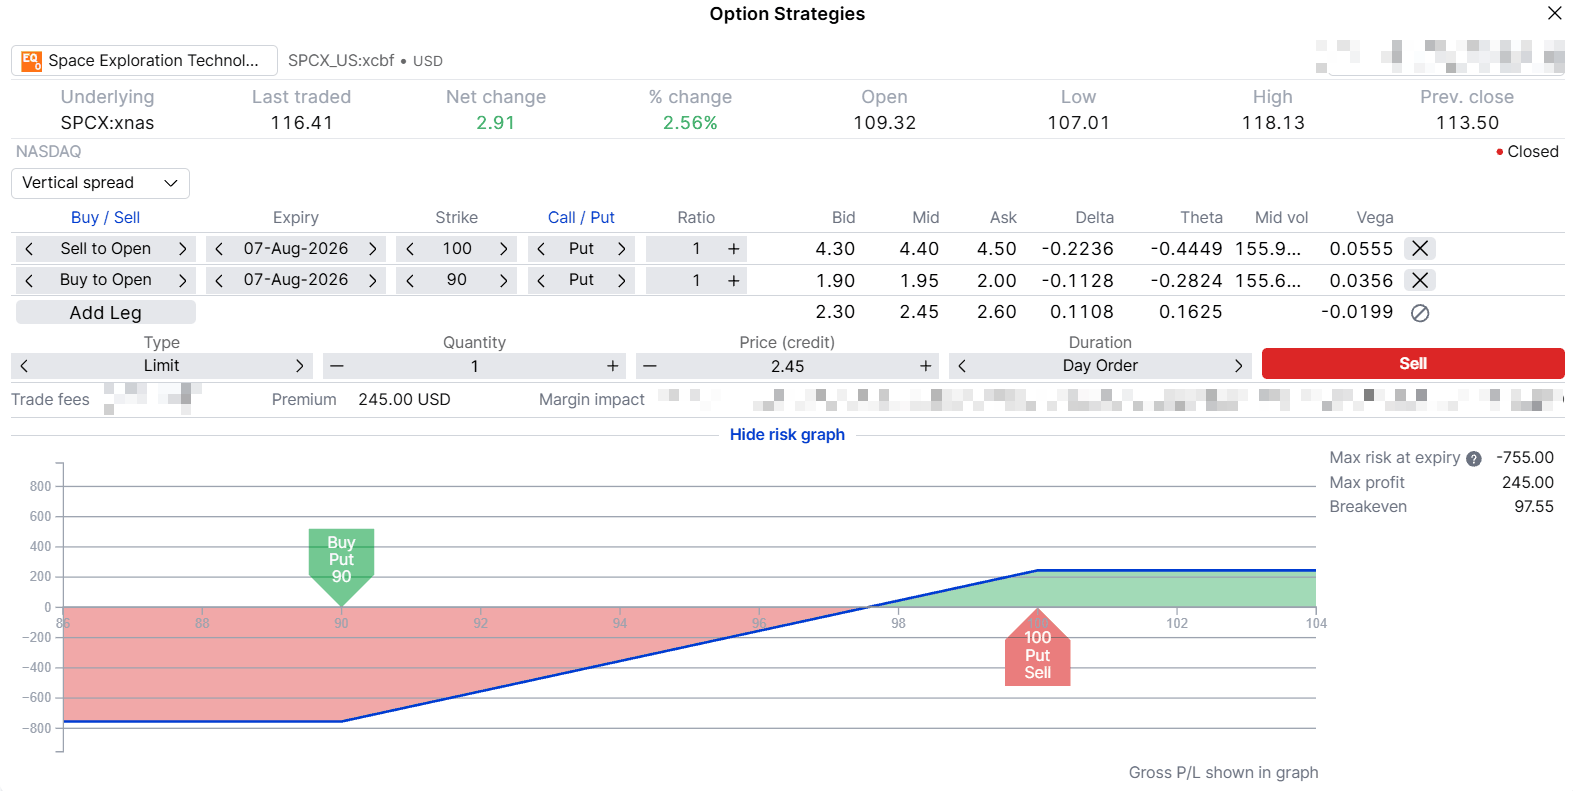 Bull put spread, 100/90, at the 7 August 2026 expiry. Illustrative only - not a trade recommendation, and not predictive. Source: SaxoTrader
Past performance is not indicative of future results; figures are illustrative and not predictive.
Bearish view: fading the call bid
Call implied volatility behaves differently. It rises as strikes move further out of the money, reaching approximately 165% at $140 and 171% at $150, consistent with demand for out-of-the-money calls on this name. A trader who thinks that upside is being overpaid may consider selling a call spread.
Example structure (illustrative only - not a trade recommendation)
- Sell 1 SPCX 7 August 2026 $140 call (mid about $4.80, delta 0.28, implied volatility about 165%)
- Buy 1 SPCX 7 August 2026 $150 call (mid about $3.45, delta 0.20, implied volatility about 171%)
- Net credit: approximately $1.35 = $4.80 taken in on the short $140 call, less $3.45 paid for the long $150 call
- Maximum risk: approximately $8.65, being the $10 spread width less the $1.35 credit
- Maximum profit: approximately $1.35
- Break-even at expiry: approximately $141.35, which is 21.4% above the 28 July close
Risk: the maximum loss is the $10 wing width less the $1.35 net credit; the short leg carries early-assignment risk. All figures are hypothetical and for education only. Costs and charges apply to each leg; see Saxo pricing for full details: https://www.home.saxo/rates-and-conditions/pricing-overview (Source: Saxo option chain, indicative pre-open quotes as of 29 July 2026)
Strategy insight - the wing costs more than the body it protects. Both this spread and the put spread above risk $10 of width, yet this one pays $1.35 against $2.45, because the long $150 leg carries implied volatility about six points higher than the $140 leg it protects and gives back most of the premium collected. Selling calls here may look attractive on headline volatility, but a maximum loss of about $8.65 above $150 against a $1.35 credit is what the skew delivers once the position is defined-risk. Options carry a high risk of rapid loss and are not suitable for every investor.
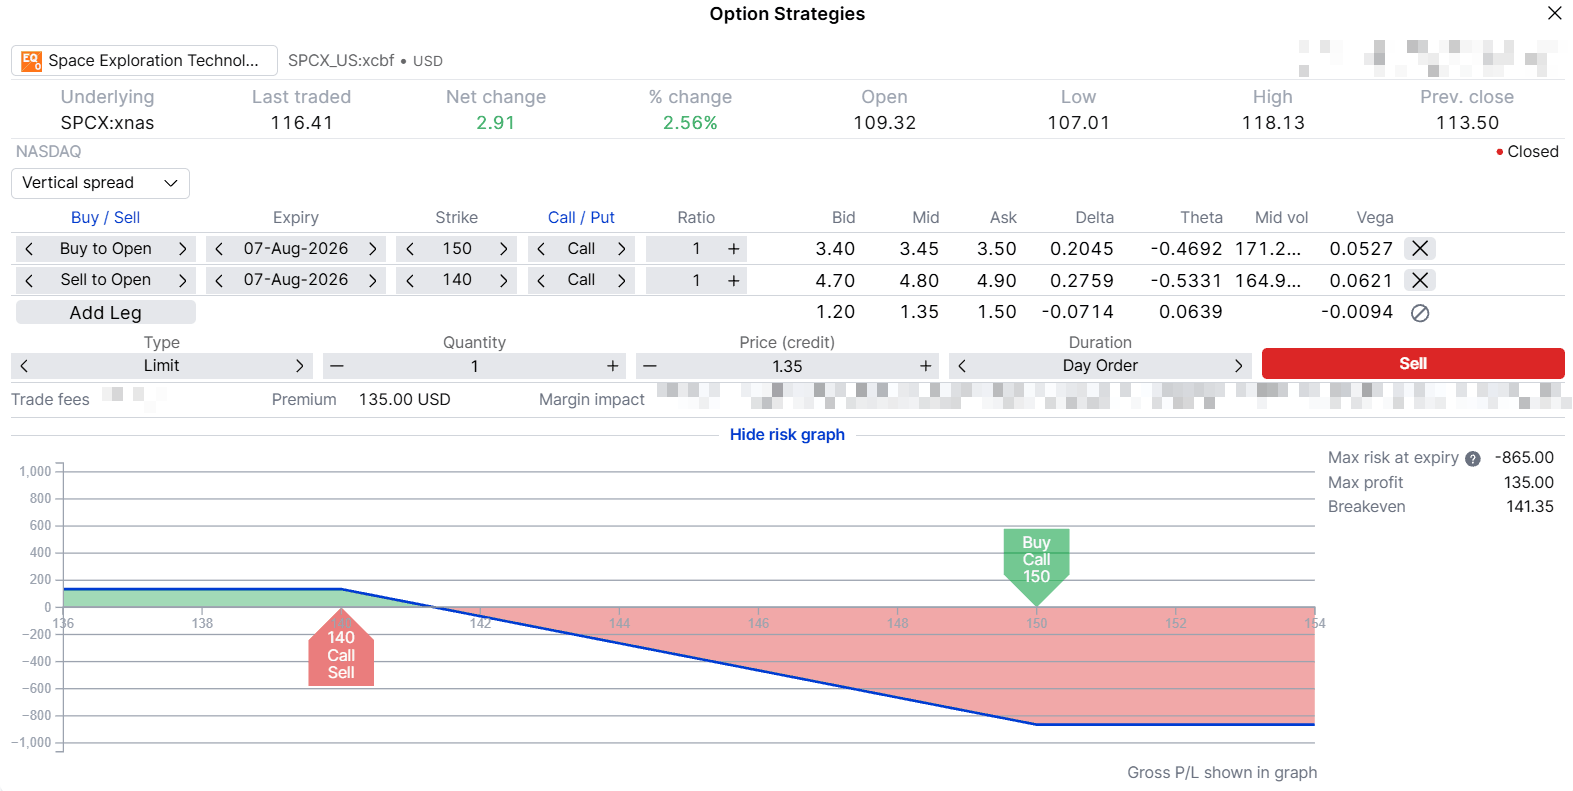 Bear call spread, 140/150, at the 7 August 2026 expiry. Illustrative only - not a trade recommendation, and not predictive. Source: SaxoTrader]
Past performance is not indicative of future results; figures are illustrative and not predictive.
Range-bound view: putting the two sides together
An iron condor is the two spreads above held at the same time. The short strikes define the range the trader wants SPCX to stay inside; the long strikes define the maximum loss if it does not.
Example structure (illustrative only - not a trade recommendation)
- Sell 1 SPCX 7 August 2026 $100 put (mid about $4.40) and buy 1 $90 put (mid about $1.95)
- Sell 1 SPCX 7 August 2026 $140 call (mid about $4.80) and buy 1 $150 call (mid about $3.45)
- Net credit: approximately $3.80 = $2.45 from the put side plus $1.35 from the call side
- Maximum risk: approximately $6.20, being the $10 width of one side less the $3.80 credit
- Maximum profit: approximately $3.80, if SPCX closes between $100 and $140
- Break-even at expiry: approximately $96.20 and $143.80, which are 17.4% below and 23.5% above the 28 July close
Risk: the maximum loss is the $10 width of one side less the $3.80 net credit; short legs carry early-assignment risk. All figures are hypothetical and for education only. Costs and charges apply to each leg; see Saxo pricing for full details: https://www.home.saxo/rates-and-conditions/pricing-overview (Source: Saxo option chain, indicative pre-open quotes as of 29 July 2026)
The maximum loss of about $6.20 is the width of one wing less the credit, not both wings added together, because SPCX cannot finish below $90 and above $150 at once. Against that risk the structure keeps a maximum $3.80 between the short strikes, a better ratio than either spread standing alone.
Strategy insight - equal widths, unequal pay. Widening the call side does not repair the imbalance described above, since call implied volatility keeps climbing with distance and the extra premium collected is more than offset by the extra risk carried. The maximum loss of about $6.20 arrives whenever either break-even is breached. Those two break-evens sit differently against the priced move: the downside one, 17.4% below the close, falls inside the 19.8% the chain is pricing, while the upside one at 23.5% above it falls outside. Options carry a high risk of rapid loss and are not suitable for every investor.
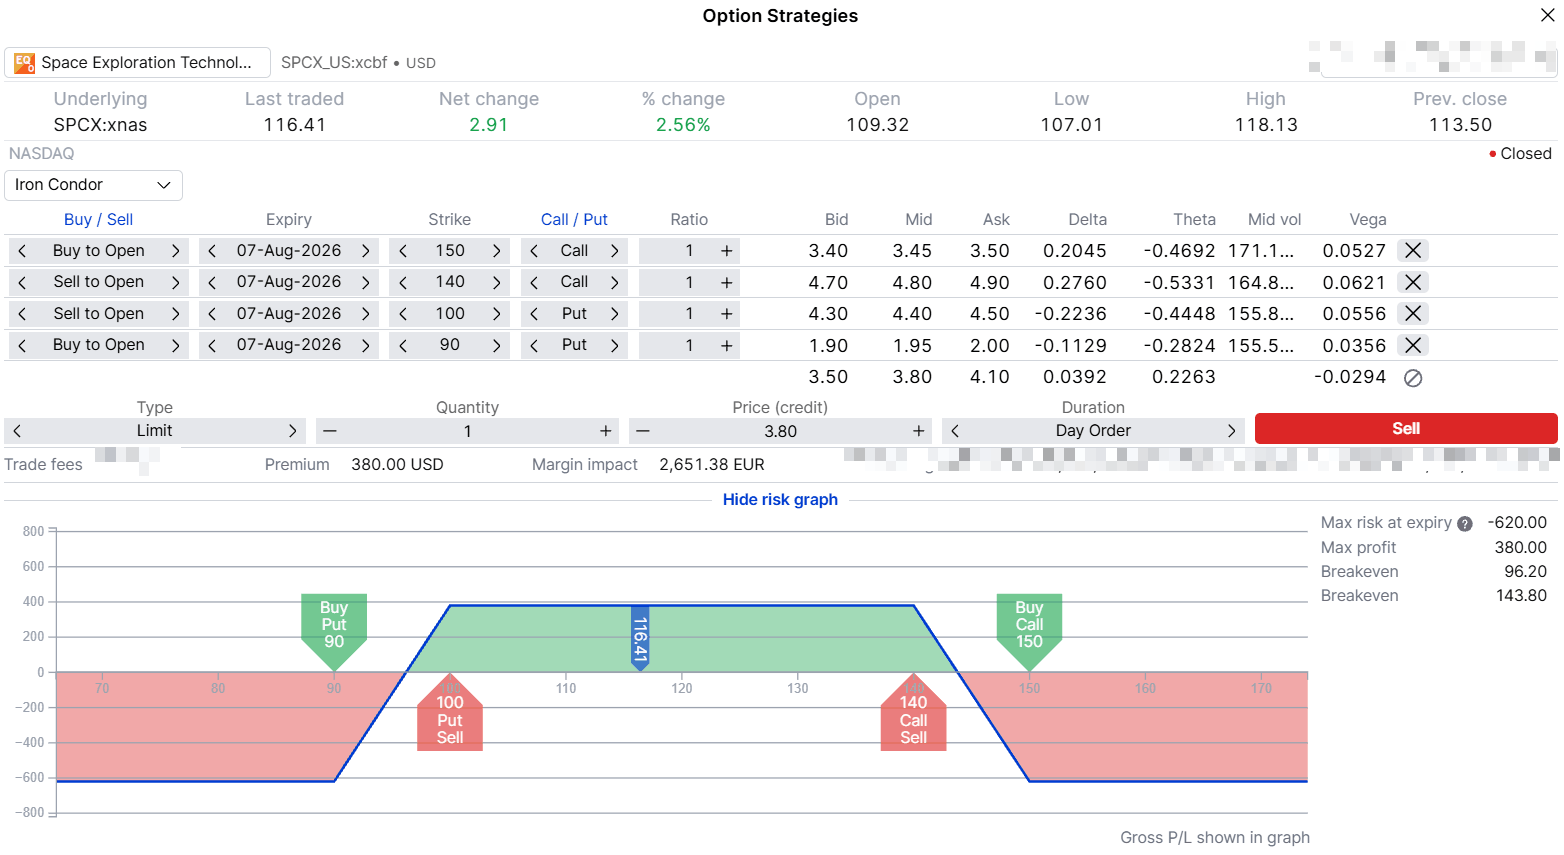 Iron condor, 90/100 and 140/150, at the 7 August 2026 expiry. Illustrative only - not a trade recommendation, and not predictive. Source: SaxoTrader
Past performance is not indicative of future results; figures are illustrative and not predictive.
Range-bound view without upside risk: the jade lizard
The condor’s weakness is the leg buying expensive call protection. A jade lizard avoids it, selling an out-of-the-money put and an out-of-the-money call spread, sized so the total credit is at least as large as the width of the call spread. When that condition holds there is no loss on the upside however far the stock rises, because the credit already covers the widest the call spread can become.
Example structure (illustrative only - not a trade recommendation)
- Sell 1 SPCX 7 August 2026 $100 put (mid about $4.40, implied volatility about 156%)
- Sell 1 SPCX 7 August 2026 $130 call (mid about $6.90, implied volatility about 160%)
- Buy 1 SPCX 7 August 2026 $135 call (mid about $5.70, implied volatility about 162%)
- Net credit at mid: approximately $5.60 = $4.40 from the short put, plus $6.90 from the short call, less $5.70 paid for the long call. The illustration uses a $5.50 working limit, a realistic step inside mid given the $130 call is quoted around $6.80 bid against $7.00 offered
- Maximum risk: approximately $94.50 per share, if SPCX were to fall to zero by expiry
- Maximum profit: approximately $5.50, if SPCX closes between $100 and $130
- Upside outcome: approximately $5.50 retained above $130, reducing to about $0.50 above $135 and no further, because the $5.50 credit exceeds the $5 call spread width
- Break-even at expiry: approximately $94.50, which is 18.8% below the 28 July close
Risk: losses on the downside are not capped by a long put and grow with every dollar below $94.50, to a maximum of about $94.50 per share; short legs carry early-assignment risk. All figures are hypothetical and for education only. Costs and charges apply to each leg; see Saxo pricing for full details: https://www.home.saxo/rates-and-conditions/pricing-overview (Source: Saxo option chain, indicative pre-open quotes as of 29 July 2026)
Everything the structure gives up sits on the downside. The short $100 put is uncovered by any long put, so the risk below $94.50 grows with every dollar the stock falls, in exchange for a maximum gain of about $5.50 and the removal of upside risk.
Strategy insight - the downside break-even against the priced move. The $94.50 break-even is 18.8% below the 28 July close while the chain prices a move of about 19.8%, so the cushion is very close to the move the market expects. A trader removing upside risk here pays for it by accepting a downside break-even the options market already regards as reachable, with losses growing below it. In our view that appears to be a reasonable exchange only for someone genuinely willing to own SPCX materially lower. Options carry a high risk of rapid loss and are not suitable for every investor.
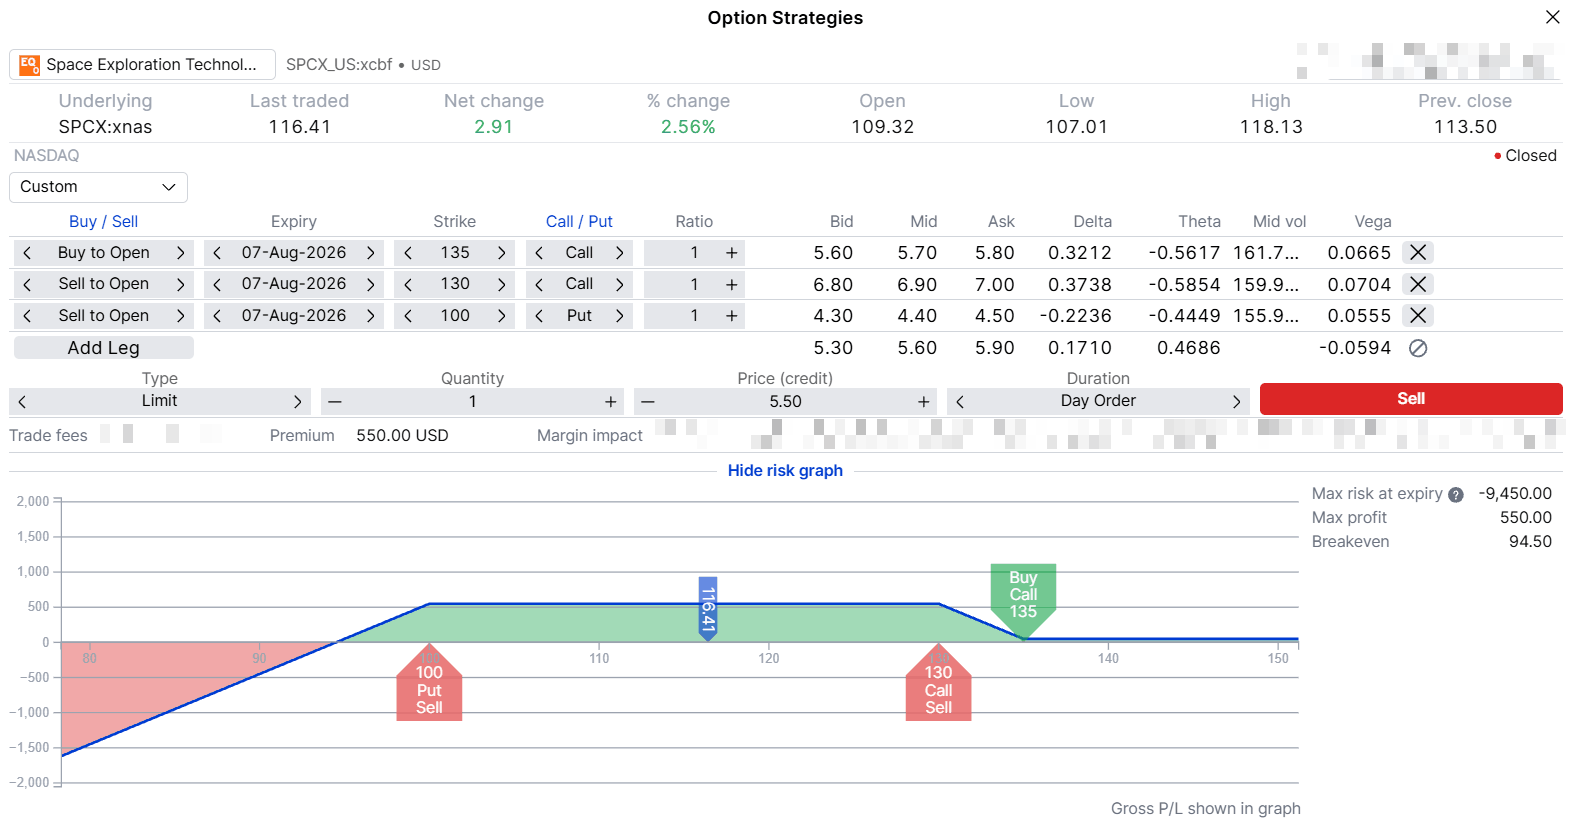 Jade lizard, short 100 put with a 130/135 call spread, at the 7 August 2026 expiry. Note the flat, small positive outcome on the upside. Illustrative only - not a trade recommendation, and not predictive. Source: SaxoTrader]
Past performance is not indicative of future results; figures are illustrative and not predictive.
Before placing the trade, check:
- Bid/ask spreads, which are wide here and can eliminate the theoretical edge at entry
- Volume and open interest at the exact strikes selected rather than the expiry as a whole
- That the report is scheduled after the US close on 4 August 2026, so the first tradable reaction is the following session
- Implied volatility against realised volatility, roughly 156% against 55% over the last 10 sessions
- An exit plan defined before entry, particularly for structures with an uncovered short put
- The 6 August 2026 lock-up release, scheduled to open a window for insiders to sell a portion of restricted holdings shortly after the print (Source: SpaceX investor relations, https://ir.spacex.com)
Assignment risk note: Because SPCX options are American-style, short legs can be assigned before expiry if they move into the money, particularly close to expiration. Traders should monitor short options and understand the platform’s assignment process before entering any of these structures.
Final thoughts
The interesting thing about SPCX is not that its options are expensive. It is that the usual way of deciding whether they are expensive does not work: no prior print exists to compare against, and there are not enough sessions for a 50-day moving average.
What remains is a narrower question, and a more answerable one. Realised volatility over the last 10 sessions is about 55%, and the expiry containing the print is asking about 156%. That gap is not an edge on its own, because a first report from a company with three segments and no reporting history is harder to forecast than a routine quarter. It is a number that can be examined rather than guessed at, and the four structures above are different ways of expressing a view on it with the loss defined in advance. When the familiar reference point is missing, the task is to find the next best one and be explicit about what it does and does not tell you.
Past performance is not indicative of future results; figures are illustrative and not predictive. Options carry a high risk of rapid loss and are not suitable for every investor.
This content is marketing material and should not be regarded as investment advice. Trading financial instruments carries risks and historic performance is not a guarantee of future results.
The Author is permitted to wait at least 24 hours from the time of the publication before they trade the instruments themselves.
The instrument(s) referenced in this content may be issued by a partner, from whom Saxo receives promotional fees, payment or retrocessions. While Saxo may receive compensation from these partnerships, all content is created with the aim of providing clients with valuable information and options.
This content will not be changed or subject to review after publication.
The author does not hold positions in any of the instruments mentioned in this article.
| Related articles/content |
|---|
| What IV crush really means in practice reviewed version | 9 April 2026 Trading earnings with defined | 31 Mar 2026 Small move big night how the options market prices Apple earnings | 29 July 2026 Where the strikes go a Meta earnings case study | 28 July 2026 Amazon into earnings choosing a structure when the move is already priced | 28 July 2026 Hedging a portfolio near the highs four ways to buy insurance while it is cheap | 17 July 2026 Before Alphabet reports reading the expected move and structuring three views | 16 July 2026 How to trade an earnings event with options a Netflix case study | 15 July 2026 ASML how to position with options ahead of Q2 earnings | 13 July 2026 Fed day Friday gets pricier - Options Brief - 29 July 2026 Seoul halts index vol holds - Options Brief - 28 July 2026 |
| More from the author |
|---|