
Un seul compte Saxo suffit pour accéder à nos plateformes.

Where option prices look stretched or cheap against their own year
Options

Résumé: A nightly scan of 511 option underlyings ranked every implied volatility reading against its own past year. Twenty-one names sat at the extremes at Friday’s close, and the gap between the two ranking columns says as much as the headline numbers.
A high reading does not mean the share is volatile. It means its options cost more than they usually do.
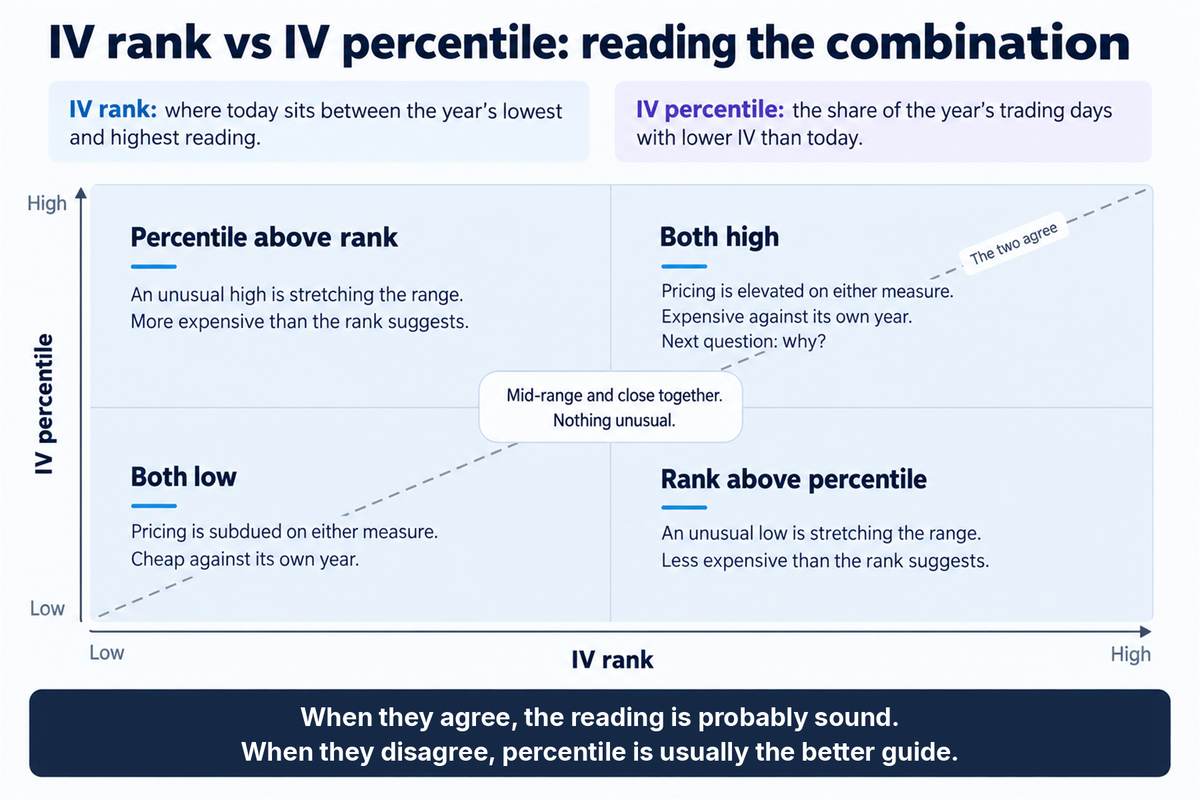
Implied volatility alone says little about whether an option is dear. IV rank places today’s reading between the lowest and highest levels an underlying has printed over the past year, on a zero to one hundred scale. IV percentile asks a different question: what share of that year’s sessions closed below the current level. At Friday 9 October’s close, six of the names below printed a rank of 100. (Source: Saxo OpenAPI, close of 9 October 2026, recorded 10 October 2026. Past performance is not indicative of future results; figures are illustrative and not predictive.)
The scan covered 184 US and 327 euro-zone underlyings. Median rank was 42.4 in the US and 46.5 in the euro zone, and about 11 percent of US names and 17 percent of euro-zone names carried a rank above 70.
Reading the two columns together
Rank and percentile usually agree. When rank sits below percentile, an old spike has stretched the year’s range, so today’s level looks middling on rank yet high on percentile. When rank is near 100 but percentile is under 50, Saxo’s history behind the figures may be short or thin, and the pair is a prompt to check the chart rather than a verdict.
Neither column is a signal. Dear optionality can become dearer and cheap optionality can stay cheap for months. Options carry a high risk of rapid loss and are not suitable for every investor. Every reading below comes from the same 9 October snapshot, with tickers resolved through Saxo reference data rather than the option root. Every front expiry sat six days out, on 16 October 2026, so a reading may carry a scheduled event inside that window.
Important note: The strategies and examples provided in this article are purely for educational purposes. They are intended to assist in shaping your thought process and should not be replicated or implemented without careful consideration. Every investor or trader must conduct their own due diligence and take into account their unique financial situation, risk tolerance, and investment objectives before making any decisions. Remember, investing in the stock market carries risk, and it’s crucial to make informed decisions.
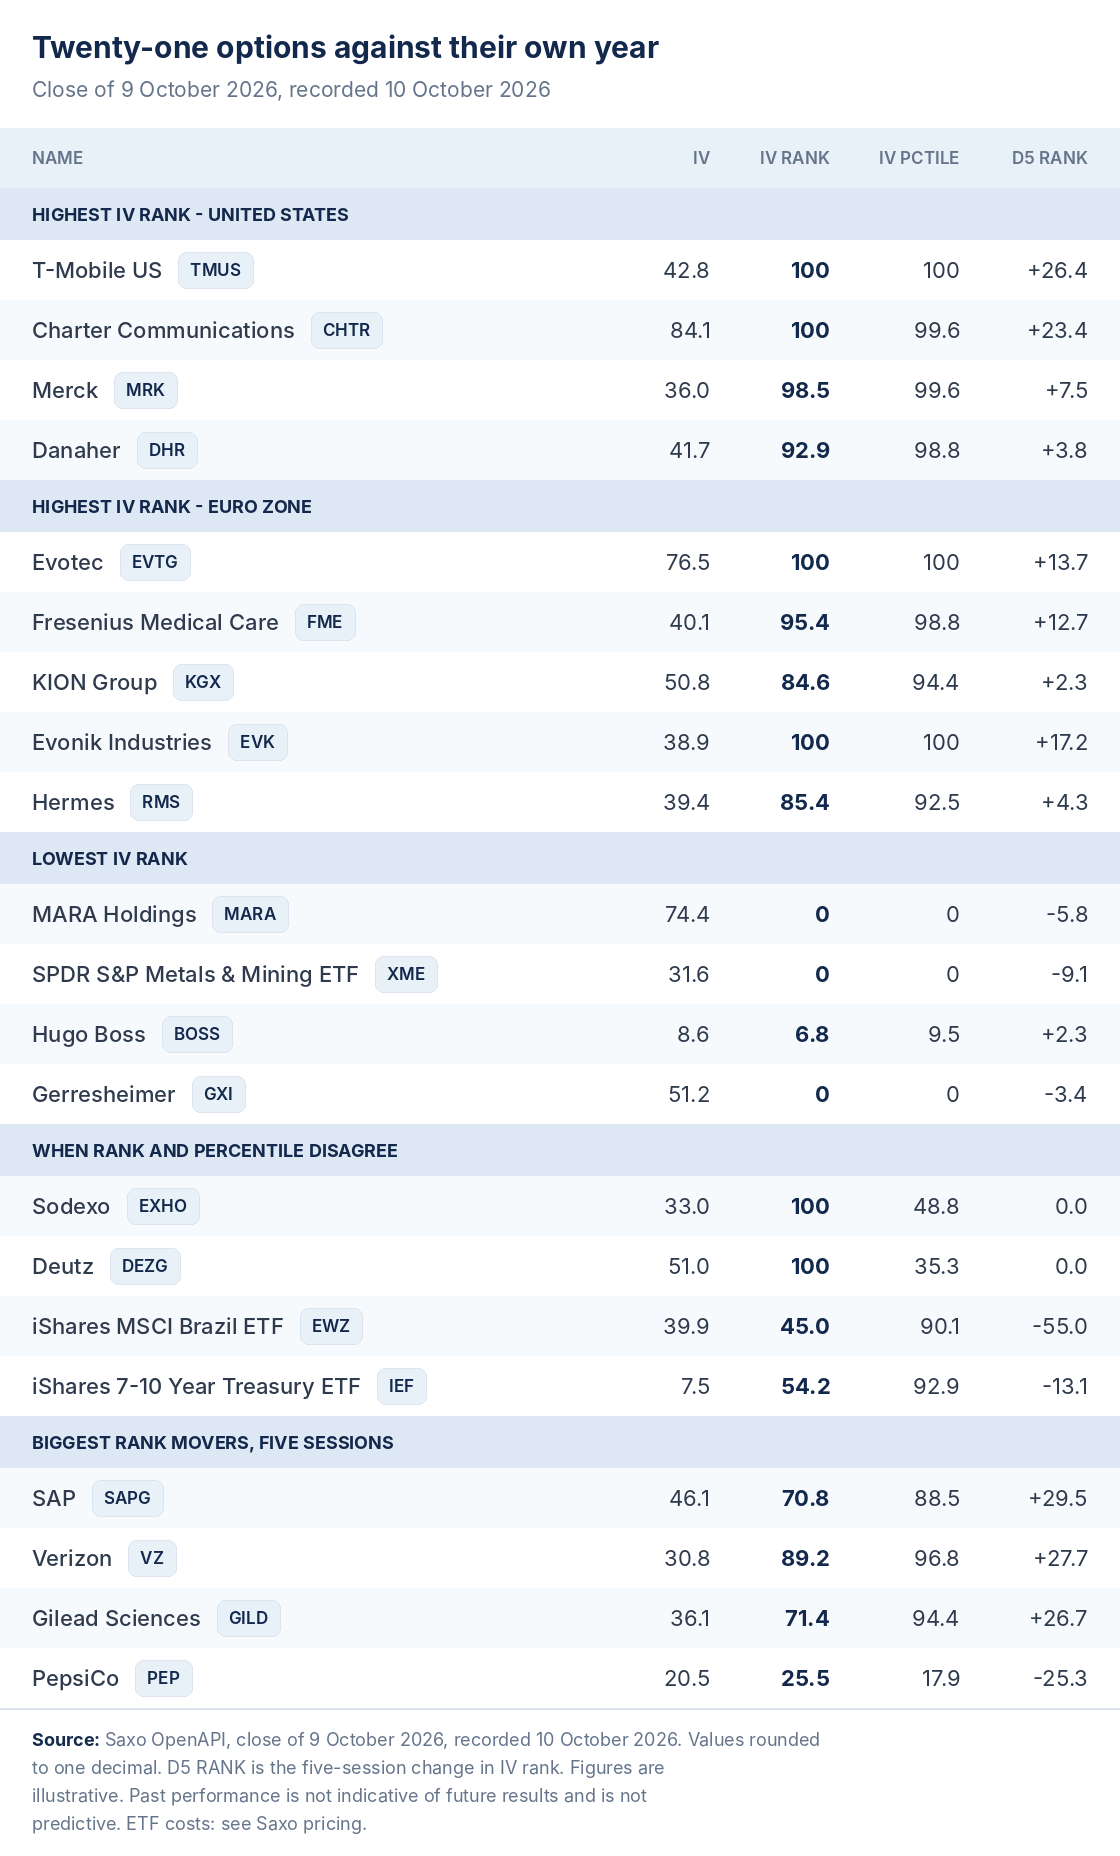 IV, IV rank, IV percentile and five-session rank change for the twenty-one names, close of 9 October 2026. Past performance is not indicative of future results; figures are illustrative and not predictive. Source: Saxo OpenAPI
Highest readings in the United States
- T-Mobile US (TMUS) - IV 42.8, rank 100, percentile 100. Rank up 26.4 points in five sessions.
- Charter Communications (CHTR) - IV 84.1, rank 100, percentile 99.6. The highest absolute IV in this group.
- Merck (MRK) - IV 36.0, rank 98.5, percentile 99.6. Already above 92 on Wednesday.
- Danaher (DHR) - IV 41.7, rank 92.9, percentile 98.8. Above 97 on Wednesday.
A long option bought at an elevated level can lose its whole premium even if the underlying moves as expected.
Highest readings in the euro zone
- Evotec (EVTG) - IV 76.5, rank 100, percentile 100. Above 90 on Wednesday.
- Fresenius Medical Care (FME) - IV 40.1, rank 95.4, percentile 98.8. Rank 100 on Wednesday.
- KION Group (KGX) - IV 50.8, rank 84.6, percentile 94.4.
- Evonik Industries (EVK) - IV 38.9, rank 100, percentile 100. Up from 78.6 on Wednesday.
- Hermes (RMS) - IV 39.4, rank 85.4, percentile 92.5.
Each carries eight listed expiries and was already elevated two sessions earlier. Kesko, Webuild and Basic-Fit also printed rank 100 but list only six expiries, so they were left out. A short option opened against an elevated reading carries risk that is not capped by the premium received.
Lowest readings
- MARA Holdings (MARA) - IV 74.4, rank 0, percentile 0. An IV above 74 at its own floor.
- State Street SPDR S&P Metals & Mining ETF (XME) - IV 31.6, rank 0, percentile 0. See Saxo pricing for applicable costs and charges.
- Hugo Boss (BOSS) - IV 8.6, rank 6.8, percentile 9.5. Single-digit IV.
- Gerresheimer (GXI) - IV 51.2, rank 0, percentile 0. A high level that is still the year’s low.
Micron and NVIDIA also sat near their floors but were excluded, because their front expiry is 12 October rather than 16 October. Buying cheap optionality still costs premium that decays, and a low reading says nothing about when it will rise.
When rank and percentile disagree
- Sodexo (EXHO) - IV 33.0, rank 100, percentile 48.8.
- Deutz (DEZG) - IV 51.0, rank 100, percentile 35.3. The widest gap among euro-zone names with seven or more expiries.
- iShares MSCI Brazil ETF (EWZ) - IV 39.9, rank 45.0, percentile 90.1. Rank down 55.0 points in five sessions. See Saxo pricing for applicable costs and charges.
- iShares 7-10 Year Treasury Bond ETF (IEF) - IV 7.5, rank 54.2, percentile 92.9. See Saxo pricing for applicable costs and charges.
Sodexo and Deutz fit the thin-history pattern, so their rank of 100 deserves a chart check. EWZ and IEF are the spike pattern: a mid-range rank, yet most of the year closed below the current level. A rank filter set at 50 would miss both.
Biggest movers over five sessions
- SAP (SAPG) - rank 70.8, up 29.5 points, IV 46.1, percentile 88.5. The largest rise among euro-zone names with seven or more expiries.
- Verizon (VZ) - rank 89.2, up 27.7 points, IV 30.8, percentile 96.8. The largest US rise.
- Gilead Sciences (GILD) - rank 71.4, up 26.7 points, IV 36.1, percentile 94.4.
- PepsiCo (PEP) - rank 25.5, down 25.3 points, IV 20.5, percentile 17.9. The largest fall among US single stocks.
No catalyst is asserted for any of the four, and momentum in a rank is not momentum in a price.
Setting rank against momentum
Rank says how dear premium is, not where the price sits. The first grid below plots 58 liquid US-listed ETFs and nine large US stocks by IV rank against 14-day RSI at the 9 October close. Each cell lists strategies commonly associated with that combination, not recommendations.
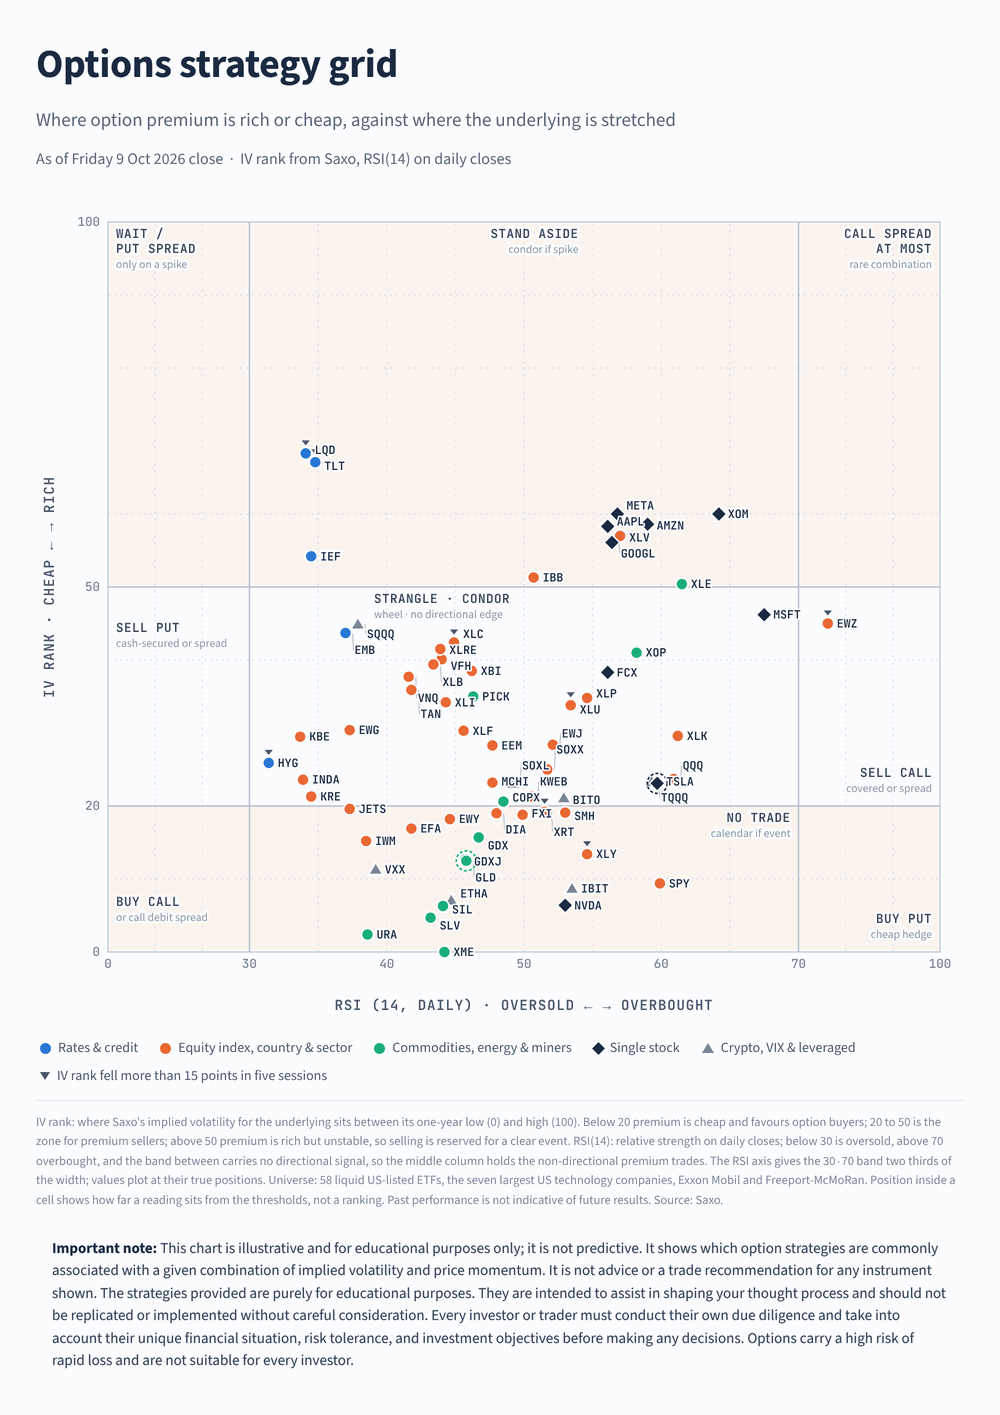 Options strategy grid, IV rank against 14-day RSI, close of 9 October 2026. Past performance is not indicative of future results; figures are illustrative and not predictive. Source: Saxo
The second grid covers the S&P 100. Read it left to right for momentum and bottom to top for premium: below 20 premium is cheap and favours buyers, above 50 it is rich and selling is reserved for a clear event, and the middle column carries no directional signal. T-Mobile US, Charter, Verizon, AT&T and Comcast all sit in the top-left cell, with a rank between 70 and 100 and an RSI below 30. Rich premium beside an oversold price may reflect a sector-wide selloff; no cause is asserted. (Sources: Saxo, TradingView. Past performance is not indicative of future results; figures are illustrative and not predictive.) Leveraged, inverse and volatility products on the first chart are complex instruments that carry a high risk of rapid loss and are not suitable for every investor.
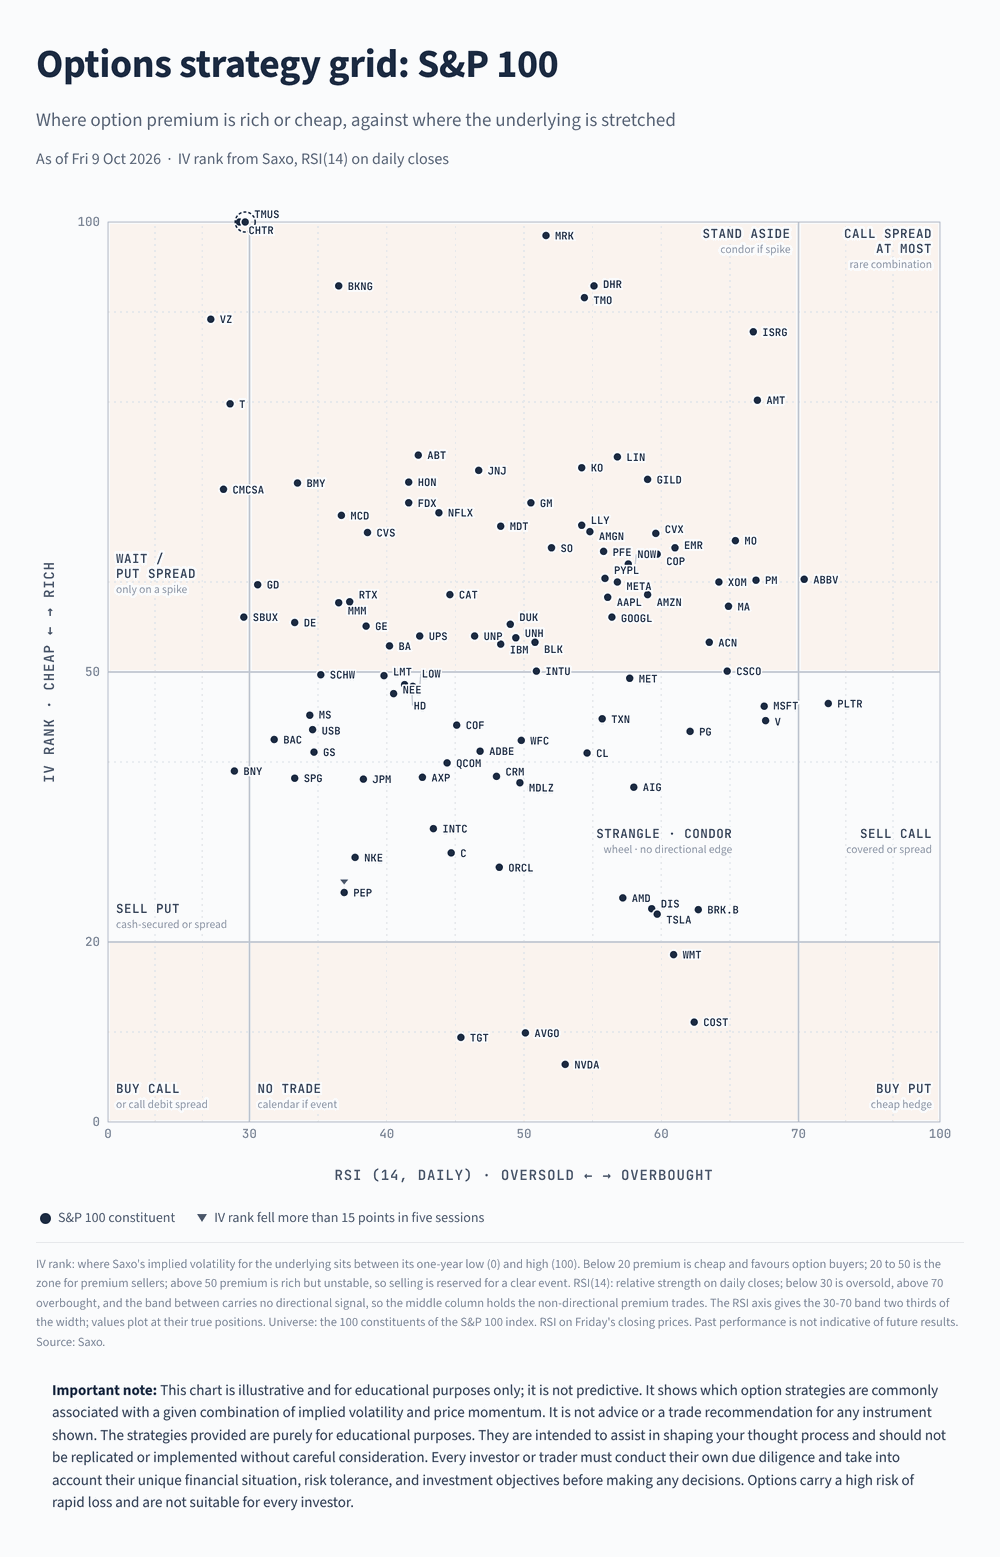 Options strategy grid for the S&P 100, IV rank against 14-day RSI, close of 9 October 2026. Past performance is not indicative of future results; figures are illustrative and not predictive. Source: Saxo
What the screen does not tell you
Three limitations matter before any reading here is used. The figures come from one close, and a chain can reprice overnight. Several names quote a front expiry only days away, where implied volatility is noisiest and least comparable with a name quoting a month out. And a rank built on one year of history is sensitive to what that year contained: one spike twelve months ago compresses every reading since.
Pulling the readings yourself
These figures come from Saxo’s OpenAPI, so traders can keep their own daily record. That route is covered in the webinar Using AI and OpenAPI to elevate your Saxo platform experience on 4 November 2026 at 13:00 CET.
Final thoughts
A screen like this separates two questions traders collapse into one: how much a market is moving, and how much movement is already priced.
In our view these columns are best used as a filter for which names deserve a look at the chain, where spread, open interest and the catalyst calendar do the real work.
Options carry a high risk of rapid loss and are not suitable for every investor. Future outcomes are uncertain and may result in losses.
The author holds positions in MARA Holdings (MARA) and iShares MSCI Brazil ETF (EWZ), both named in this article, and no position in any of the other instruments mentioned.
| More from the author |
|---|