
Un seul compte Saxo suffit pour accéder à nos plateformes.

Microsoft earnings: is the options market leaning up or down?
Options

Résumé: Microsoft shares fell after five of the last eight reports, yet the biggest move went up. Two mirror-image spreads show whether option prices lean either way ahead of the 28 October results.
Microsoft’s report history leans one way and its biggest move went the other; two spreads of the same width show which way the options lean.
Microsoft reports results for its fiscal first quarter on 28 October 2026, after the US close (Source: Microsoft investor relations). The first full session to price the results is 29 October.
The stock’s recent record on report days is lopsided. It fell after five of the last eight reports. The largest of the eight moves, the jump after the July 2026 report, went the other way. Past performance is not indicative of future results, and that record supports an argument in either direction.
This article does not pick a side. It uses two spreads, one for each direction, to read how the options market itself prices that question.
Five falls, three rises, and one outlier
The last eight reactions show a clear majority and one large exception.
- Reports followed by a fall: 5 of 8
- Reports followed by a rise: 3 of 8
- Median move, up or down: 6.1%
- Average move, up or down: 7.0%
- Largest move: +15.5%, after the 29 July 2026 report
(Source: Saxo price history. Close before the report to close after it, last eight reports, 30 October 2024 to 29 July 2026.)
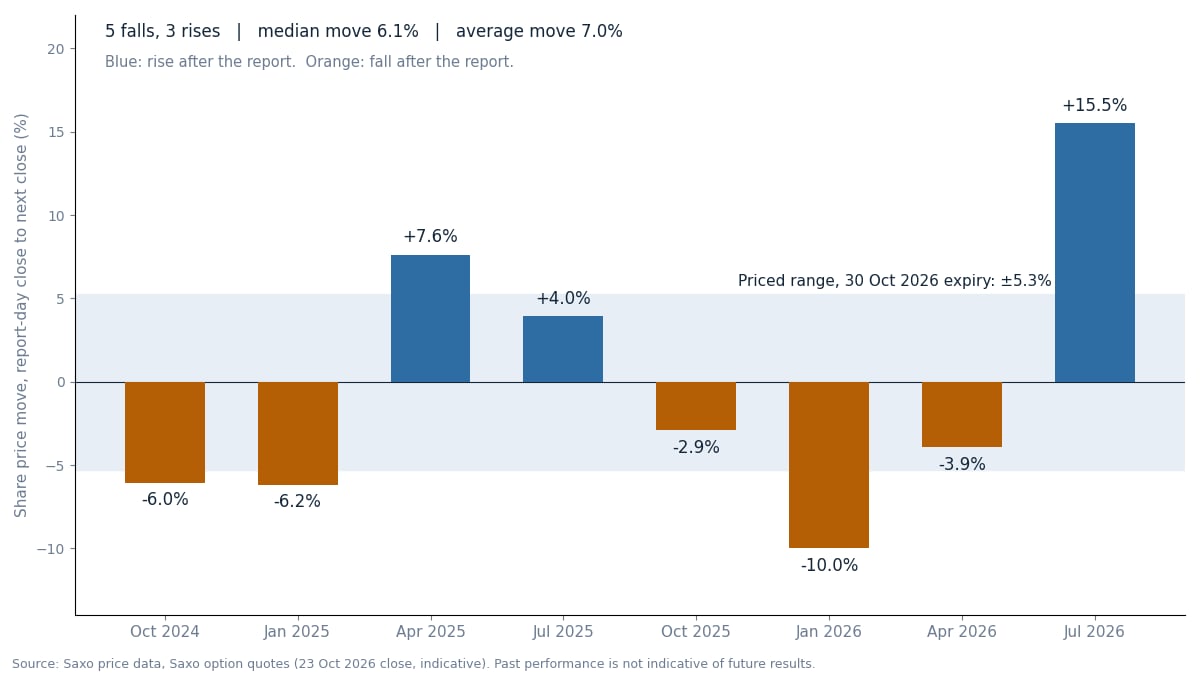 Microsoft's share price move after each of the last eight reports, against the range the options price for the 30 October 2026 expiry. Past performance is not indicative of future results; figures are illustrative and not predictive. Source: Saxo price data, Saxo option quotes
The average sits above the median because of that July outlier. Strip out July and the record looks like a stock that tends to slip after results.
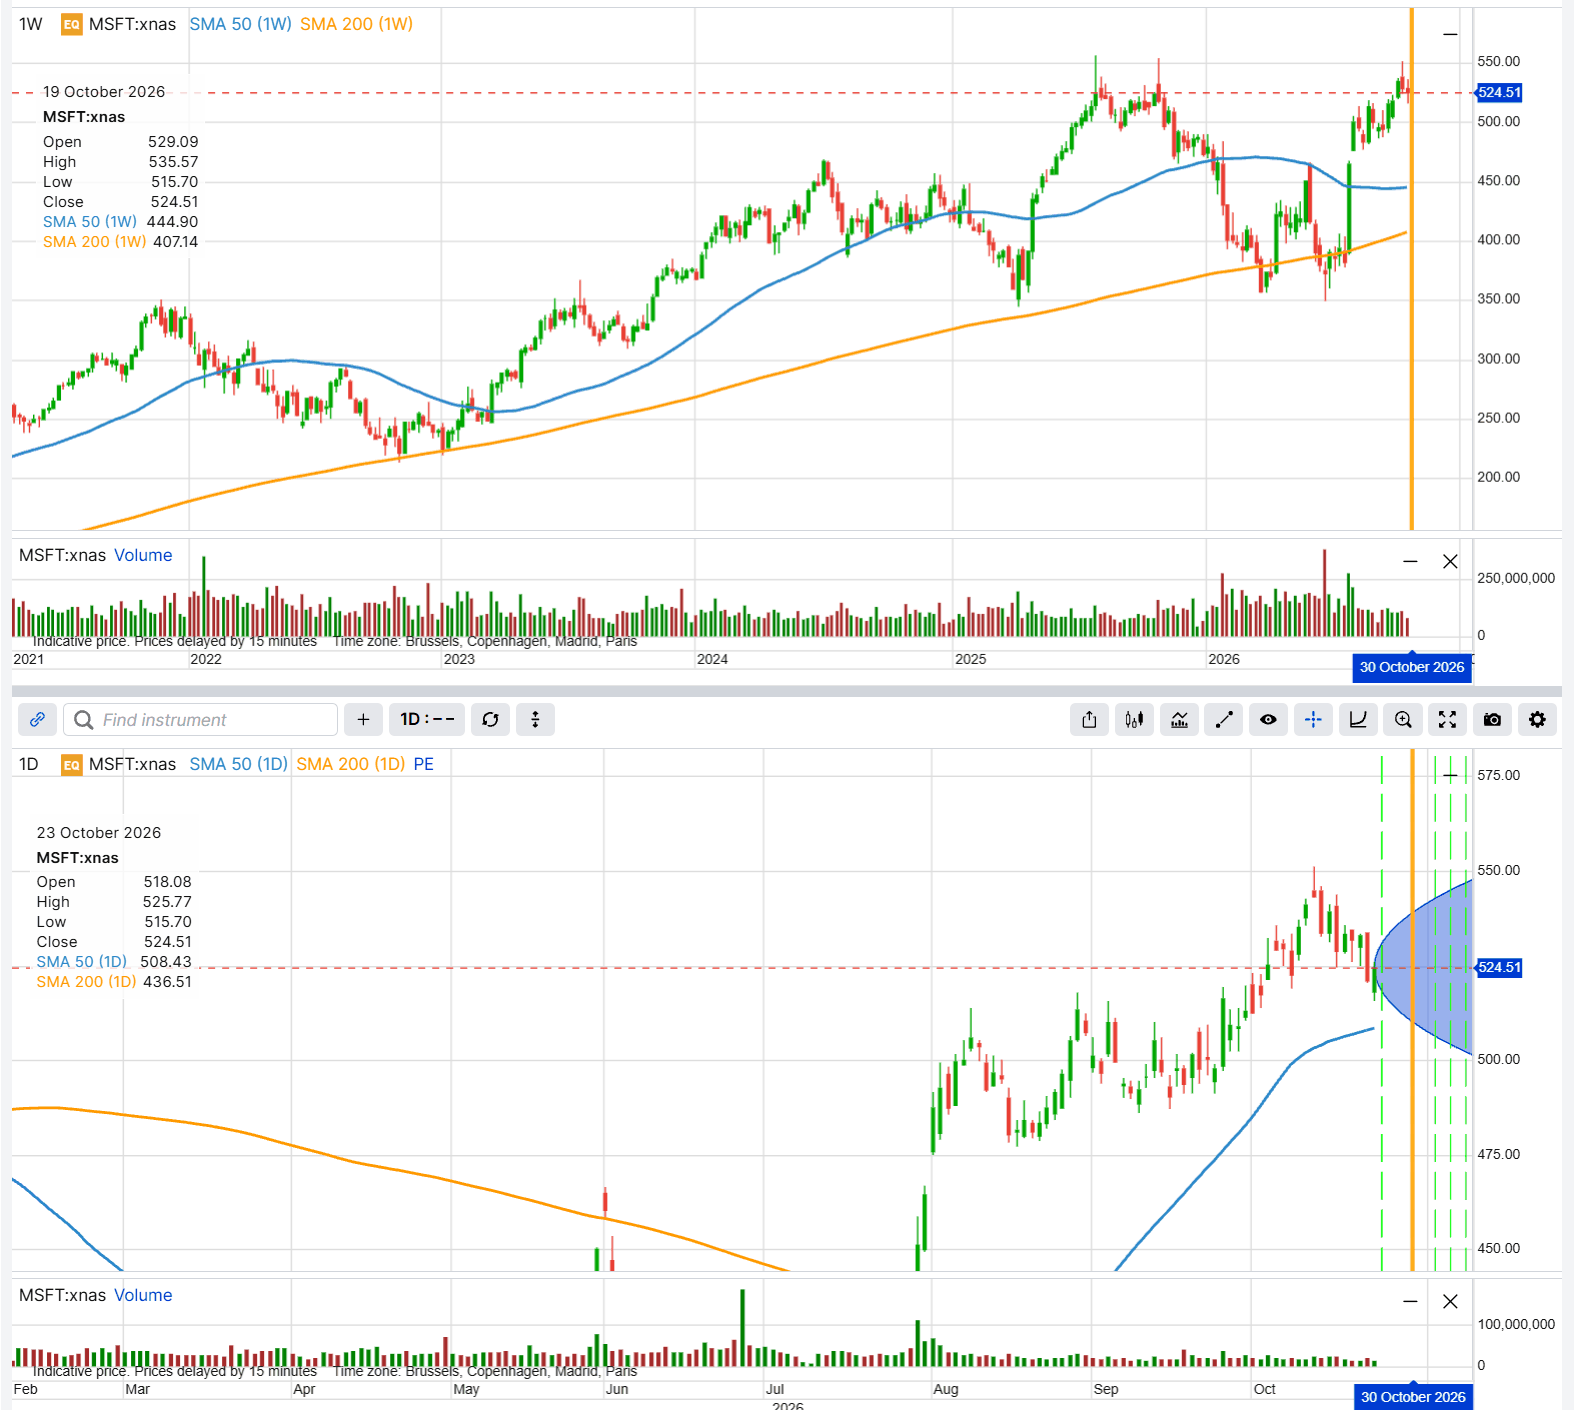 Microsoft share price, weekly and daily, with the range the options price to the 30 October 2026 expiry. Past performance is not indicative of future results; figures are illustrative and not predictive. Source: SaxoTrader
Azure, its cloud platform, is the number much of the reaction tends to hang on. It grew 43% in the fiscal fourth quarter. For the quarter now being reported, management guided for Azure growth of about 45% in constant currency (Source: Microsoft, fiscal Q4 2026 results, 29 July 2026).
How large a move the options price
The at-the-money straddle on the first expiry after the report gives a quick read of the expected size of the move. On the close of 23 October 2026:
- Share price: about $524.50
- 525 call, 30 October expiry: about $13.78
- 525 put, 30 October expiry: about $13.90
- Straddle: about $27.68, or roughly 5.3% of the share price
(Source: Saxo, indicative quotes after the close of 23 October 2026.)
That straddle also covers the ordinary sessions before the report, so the part that belongs to the report alone is a little smaller. Either way, the options price a move somewhat below the 6.1% median of the last eight reports. A straddle measures the size of the move, not its direction.
Reading direction from two mirror-image spreads
To see whether the market leans one way, compare two spreads built as mirror images: the same starting strike, the same width, the same expiry, one pointing up and one pointing down. A spread of this kind costs more when the options imply a better chance of the shares finishing beyond its far strike. If the market saw a fall as more likely than a rise of the same size, the bearish spread would cost noticeably more than the bullish one.
Here the two cost almost the same, about $9.65 for the bullish spread and $9.47 for the bearish one. In our view, that suggests the market may see a rise and a fall of this size as roughly equally likely, despite a history of more falls than rises. Each spread is set out below.
Important note: The strategies and examples provided in this article are purely for educational purposes. They are intended to assist in shaping your thought process and should not be replicated or implemented without careful consideration. Every investor or trader must conduct their own due diligence and take into account their unique financial situation, risk tolerance, and investment objectives before making any decisions. Remember, investing in the stock market carries risk, and it’s crucial to make informed decisions.
Why these strikes and the 30 October expiry
Both spreads start at the 525 strike, the listed strike closest to the share price. The far strikes sit near the edges of the move the straddle prices: 552.50 above and 497.50 below. Each spread therefore reaches its maximum if the shares move by about the priced amount in its direction; a larger move adds nothing.
Moving the far strike closer makes a spread cheaper but caps the gain sooner. Moving it further out raises both the cost and the potential gain, and needs a larger move to reach it.
The 30 October weekly is the first expiry after the report; earlier expiries close before the release and do not capture the results. Later expiries add more ordinary trading days, which dilutes the part of the price that relates to the report.
If the report lifts the shares: a bull call spread
This structure loses its full cost if Microsoft closes at or below 525 on 30 October. The long call gives exposure to a rise; the short call reduces the cost and caps the gain above 552.50.
Example structure (illustrative only - not a trade recommendation)
- Buy 1 MSFT 30 October 2026 525 call at about $13.78
- Sell 1 MSFT 30 October 2026 552.50 call at about $4.13
- Net debit: about $9.65 ($13.78 paid for the long call minus $4.13 received for the short call)
- Maximum loss: about $965 per spread, the debit paid (hypothetical, for education only)
- Maximum profit: about $1,785 per spread, if MSFT closes at or above 552.50 (hypothetical, for education only)
- Break-even at expiry: about 534.65, roughly 1.9% above the 23 October close
- Costs and charges apply to each leg and vary by account and venue; check the applicable rates before entering any position.
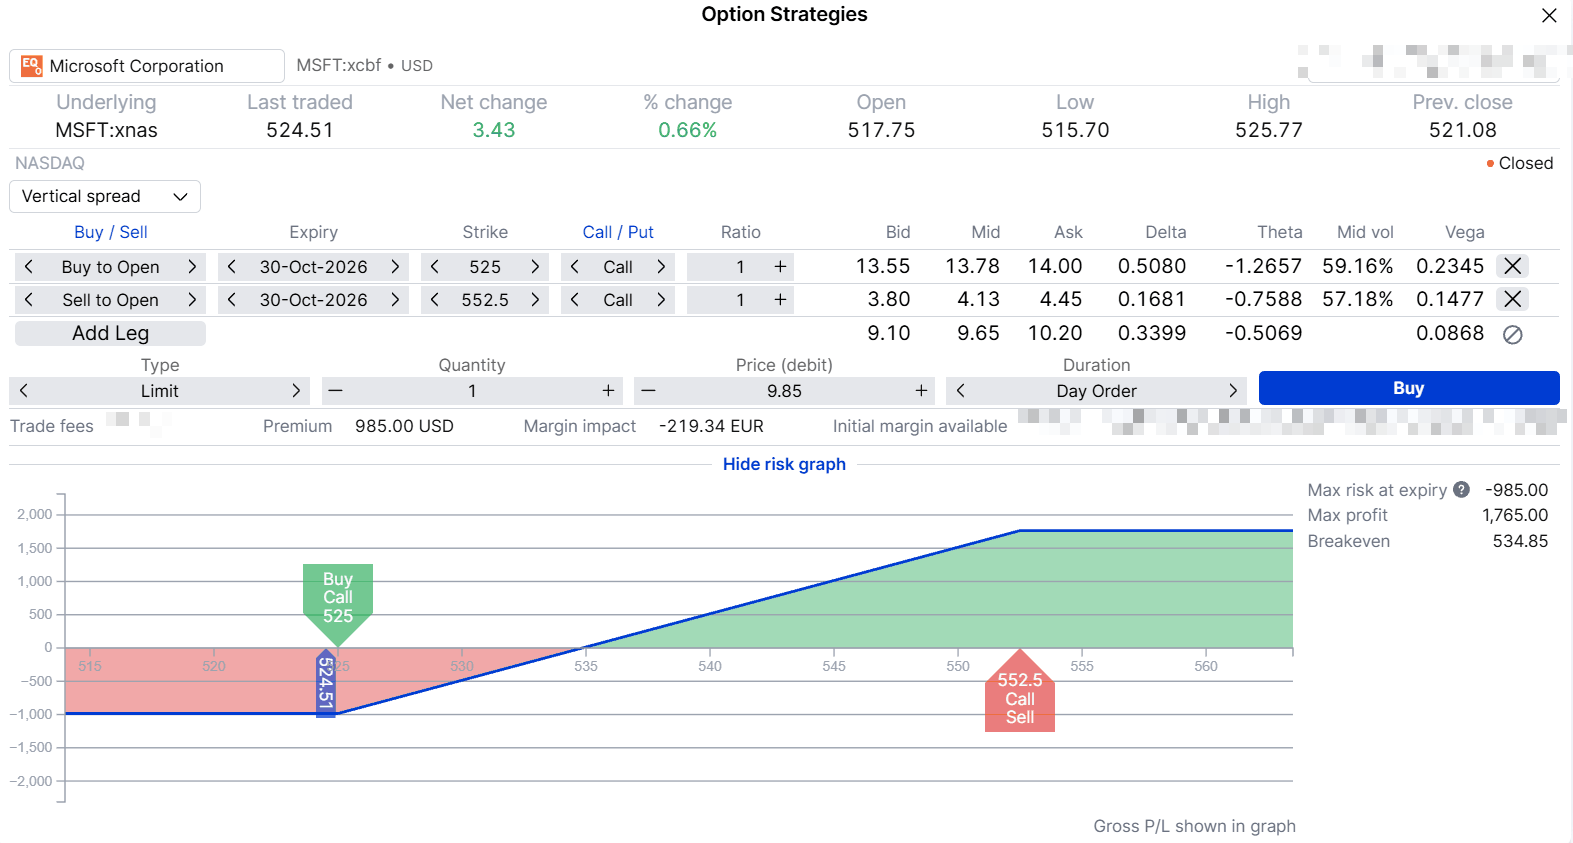 Bull call spread, illustrative only. The screen uses a limit price of $9.85, slightly above the $9.65 mid, so its maximum loss, maximum profit and break-even differ slightly from the figures above. Past performance is not indicative of future results; figures are illustrative and not predictive. Source: SaxoTrader
A rise smaller than about 1.9% leaves this spread below break-even at expiry. A larger rise helps only up to 552.50; beyond that, the extra move goes to the short call.
The spread can still lose the whole debit if the shares do not rise, and its gain stops at 552.50. After a report, option prices usually drop as the uncertainty clears. A long call bought on its own carries that drop in full; in the spread, the short call loses value too, which offsets part of it.
If the report sinks the shares: a bear put spread
This structure loses its full cost if Microsoft closes at or above 525 on 30 October. The long put gives exposure to a fall; the short put reduces the cost and caps the gain below 497.50.
Example structure (illustrative only - not a trade recommendation)
- Buy 1 MSFT 30 October 2026 525 put at about $13.90
- Sell 1 MSFT 30 October 2026 497.50 put at about $4.43
- Net debit: about $9.47 ($13.90 paid for the long put minus $4.43 received for the short put)
- Maximum loss: about $947 per spread, the debit paid (hypothetical, for education only)
- Maximum profit: about $1,803 per spread, if MSFT closes at or below 497.50 (hypothetical, for education only)
- Break-even at expiry: about 515.53, roughly 1.7% below the 23 October close
- Costs and charges apply to each leg and vary by account and venue; check the applicable rates before entering any position.
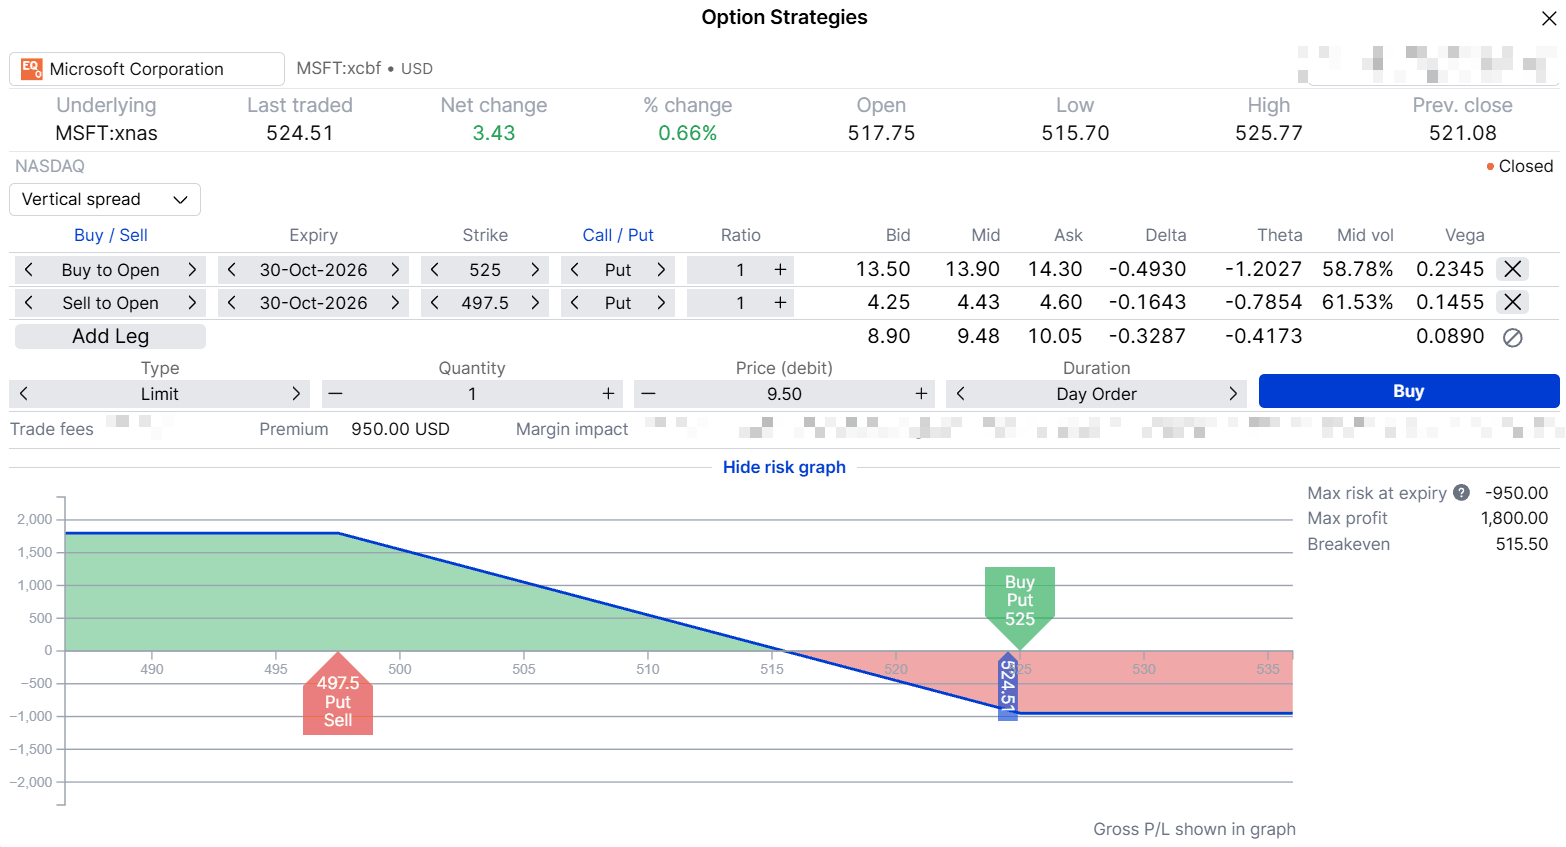 Bear put spread, illustrative only. The screen uses a limit price of $9.50, slightly above the mid of about $9.47, so its figures differ slightly from those above. Past performance is not indicative of future results; figures are illustrative and not predictive. Source: SaxoTrader
The same logic runs in reverse. A fall of less than about 1.7% leaves the spread below break-even, and any fall past 497.50 adds nothing further.
Five falls in eight reports may tempt a trader towards this side. Eight reports are a small sample, and the largest move in it went up. If the shares rise instead, the spread loses its full debit (hypothetical, for education only), and if they fall sharply, the gain stops at 497.50.
Checks before any position
- Quotes move. These prices are indicative quotes after the close of 23 October 2026. Live chain prices may differ.
- Bid/ask spreads. Weekly options can quote wide, and a wide spread on each leg eats into a structure whose maximum gain is only about twice its cost.
- Timing. The results come after the US close on 28 October. Both structures are exposed to the full reaction on 29 October.
- Exit plan. Holding to expiry and closing after the first session can give very different results, and many traders settle that choice before entry.
- Costs. Costs and charges apply to each leg and vary by account and venue; check the applicable rates before entering any position.
Assignment risk: MSFT options are American-style, so the short leg of either spread can be assigned before expiry if it moves into the money, particularly close to expiration. Short options need monitoring, and the platform’s assignment process is worth understanding before any position is opened.
Final thoughts
Microsoft’s report-day history leans down, while its largest recent move went up, and the options market appears to price the two directions almost evenly.
Options carry a high risk of rapid loss and are not suitable for every investor, and a report can move the shares sharply in the direction a trader did not expect. Neither spread is a forecast; each one fixes in advance the most that can be lost and the most that can be made.
The author does not hold positions in any of the instruments mentioned in this article. The Author is permitted to wait at least 24 hours from the time of the publication before they trade the instruments themselves.
| Related articles/content |
|---|
| Meta earnings options price a smaller move than Meta usually makes | 20 Oct 2026 Tesla earnings the median says small the average says big What do options price | 19 Oct 2026 ASML earnings three ways to read the move options are pricing | 12 Oct 2026 Two banks one morning what options price for Goldman Sachs and Wells Fargo earnings | 9 Oct 2026 Same coin different payoffs an options toolkit for earnings season | 7 Oct 2026 Earnings season is close to a coin flip The edge is in what happens next | 5 Oct 2026 Finding unusually expensive or cheap options in the Saxo screener | 18 Sep 2026 Implied volatility rank what it measures and what it misses | 11 Sep 2026 Nine prints later what Q2 earnings season taught us | 11 Aug 2026 What IV crush really means in practice reviewed version | 9 April 2026 Trading earnings with defined | 31 Mar 2026 |
| More from the author |
|---|