
Un seul compte Saxo suffit pour accéder à nos plateformes.

ASML earnings: three ways to read the move options are pricing
Options

Résumé: ASML reports on 14 October, and options price a move of about 6.5%, larger than most of its past reactions. What does that comparison show, and how can three different views be expressed?
One name, one report, three readings of the same priced move.
ASML (EURONEXT:ASML / NASDAQ:ASML) is scheduled to report third-quarter 2026 results on Wednesday 14 October 2026 (Source: company announcements, as of 9 October 2026). The stock has moved more than 5% after four of its last eight reports, and fell after six of them. The Euronext October monthly expiry falls on Friday 16 October 2026, two sessions after the report, so the front-month options carry little beyond the event itself.
This piece applies two earlier articles to a single name: why the direction of an earnings move is close to a coin flip, and how to match option structures to a read on the priced move. The aim is to show how a view can be expressed, not which view is right.
Key takeaways
- ASML has moved more than 5% after four of its last eight reports, and the options market prices about 6.5% into the 16 October 2026 expiry (Source: Saxo price data, author calculation; Saxo indicative quotes as of the 8 October 2026 Euronext close).
- Three example structures follow, one per view: a smaller move than priced, a modestly bearish lean, and a modestly bullish lean. Each has a defined maximum loss, and none is a recommendation.
What is priced against what has happened
Adding the cost of the at-the-money call and put for the first expiry after the report gives a rough measure of the move the market prices. ASML closed on 8 October 2026 at EUR 1,630.60. At the closest listed strike, 1,620, the call mid of EUR 59.20 and the put mid of EUR 45.98 add up to about EUR 105, or roughly 6.5% of the share price (Source: Saxo, indicative quotes as of the 8 October 2026 Euronext close; the market was closed when the quotes were taken, so they are not live tradable prices). The straddle also covers the ordinary trading days before the report, so it modestly overstates the event alone.
The more useful comparison is with what ASML has actually done. Over its last eight reports, the absolute move from the previous close to the close on report day averaged 5.9% and had a median of 4.7%. Six of the eight moves were declines, and the largest, a 15.6% fall in October 2024, followed results that were published hours early by mistake (Source: Saxo price data, author calculation). The priced 6.5% is larger than six of those eight moves and smaller than the two biggest. None of this says anything about the direction of the next move.
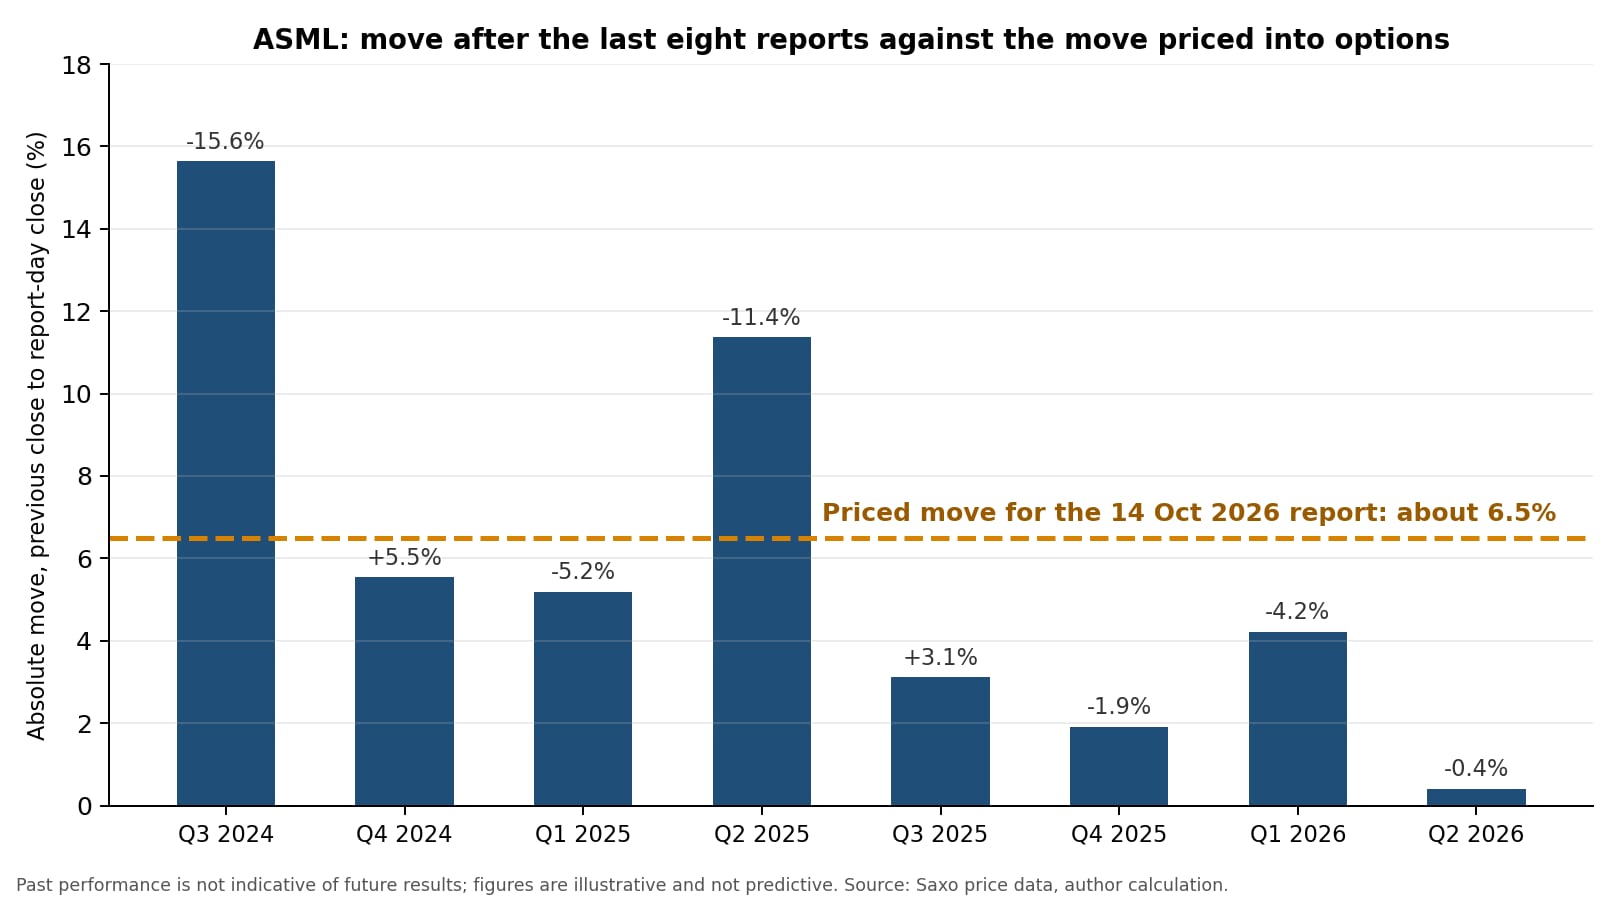 ASML's absolute move from previous close to report-day close for its last eight reports, against the roughly 6.5% move priced into the 16 October 2026 expiry (at-the-money straddle, indicative quotes as of the 8 October 2026 Euronext close). Past performance is not indicative of future results; figures are illustrative and not predictive. Source: Saxo price data, author calculation.
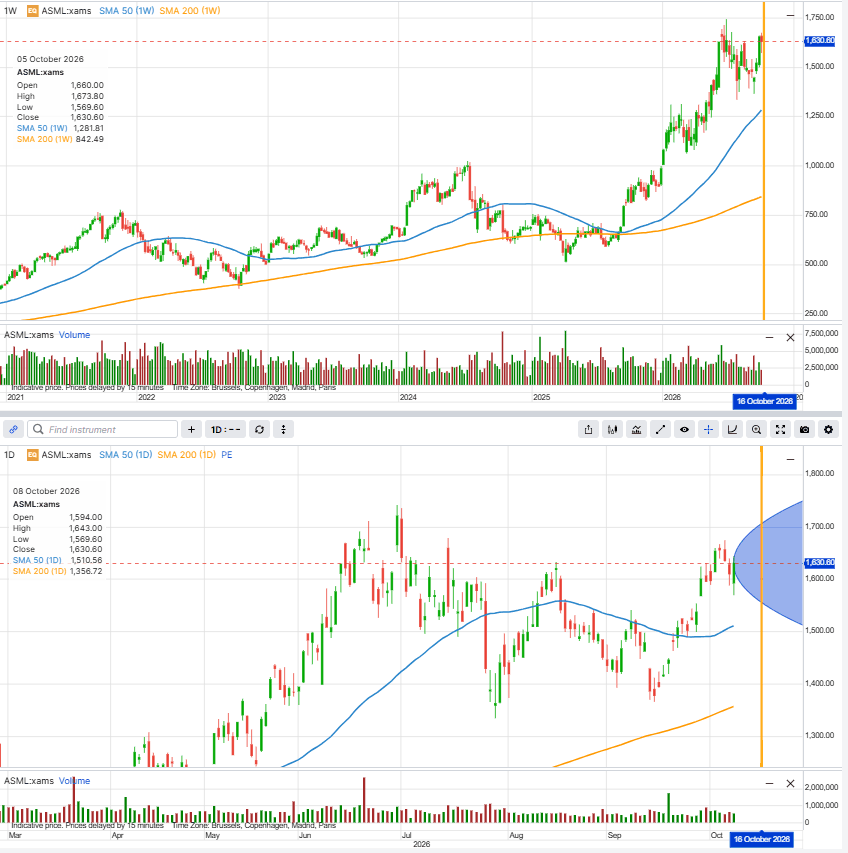 ASML weekly and daily price charts, with the implied move range to the 16 October 2026 expiry shown on the daily chart. Past performance is not indicative of future results; figures are illustrative and not predictive. Source: SaxoTrader.
Important note: The strategies and examples provided in this article are purely for educational purposes. They are intended to assist in shaping your thought process and should not be replicated or implemented without careful consideration. Every investor or trader must conduct their own due diligence and take into account their unique financial situation, risk tolerance, and investment objectives before making any decisions. Remember, investing in the stock market carries risk, and it’s crucial to make informed decisions.
What the market may be weighing
ASML guided third-quarter 2026 net sales to between EUR 11.0 billion and EUR 12.0 billion, with a gross margin between 55% and 57% (Source: ASML Q2 2026 results, 15 July 2026). In our view, how the actual figures compare with that range, and what management says about next year’s demand, may drive much of the reaction. These points describe what the market may be watching, not a forecast. Options carry a high risk of rapid loss and are not suitable for every investor.
How the strikes and the expiry were chosen
Strike selection is the question readers ask most, so the rules are spelled out here. All strikes are listed Euronext strikes, prices are indicative Saxo mid quotes as of the 8 October 2026 Euronext close (actual prices will differ), and each contract covers 100 shares. All figures are hypothetical and for education only.
- Iron condor. The short strikes were picked near the edges of the priced range, with protective wings EUR 60 further out. The shares rose about 1.3% on 8 October, so the structure now sits slightly low: the short put at 1,520 is about 6.8% below the share price, close to the edge of the priced 6.5% move, while the short call at 1,700 is about 4.3% above, inside it. A short call further out would lower the credit.
- Broken-wing put butterfly. The two short puts at 1,540 sit about 5.6% below the share price, close to ASML’s average report-day move of 5.9%. The upper wing is EUR 20 wide and the lower wing EUR 80 wide, and that uneven width is what turns the butterfly from a debit into a credit. A narrower lower wing would cut both the credit and the maximum loss.
- Bull call spread. The long call at 1,620 sits close to the share price, and the short call at 1,700 about 4.3% above it, near ASML’s median reaction of 4.7%. A higher short strike would raise the maximum gain and the cost; a lower one would do the reverse.
There is no single correct strike. Moving a strike changes the balance between how often a structure may pay and how much it may pay.
The expiry follows from the report date. 16 October 2026 is the first listed expiry after 14 October. The nearest expiry after an event puts most of an option’s price on the event itself, so the fall in implied volatility that usually follows a report shows up fully. That may benefit short-premium structures and hurts long-premium ones. A later expiry adds ordinary trading days, costs more for long positions, and reacts less to the report alone.
Neutral view: a smaller move than priced
Iron condor (illustrative only, not a trade recommendation)
A reader who finds the priced 6.5% wide against ASML’s 4.7% median reaction could sell a put spread below the share price and a call spread above it. The position collects a credit up front and keeps it in full if ASML closes between 1,520 and 1,700 at expiry. The risk sits outside that range: beyond either wing the loss is capped at about EUR 3,964 (hypothetical, for education only), almost twice the credit received, and a report-day move like the 15.6% fall in October 2024 would land there. The short legs also carry early-assignment risk, because ASML options are American-style. The structure takes a view on how much movement is priced, not on direction, and "defined risk" still means a real loss is possible.
The following example is hypothetical and for educational purposes only; it is not advice or a trade recommendation.
Example structure (illustrative only, not a trade recommendation)
- Buy 1 16 Oct 2026 1460 put at EUR 5.32
- Sell 1 16 Oct 2026 1520 put at EUR 12.58
- Sell 1 16 Oct 2026 1700 call at EUR 26.70
- Buy 1 16 Oct 2026 1760 call at EUR 13.60
- Net credit: approximately EUR 20.36 per share, made up of EUR 7.26 on the put side (EUR 12.58 received less EUR 5.32 paid) and EUR 13.10 on the call side (EUR 26.70 received less EUR 13.60 paid)
- Maximum profit: approximately EUR 2,036 (hypothetical, for education only), kept if ASML closes between 1,520 and 1,700 at expiry
- Maximum risk: approximately EUR 3,964 (hypothetical, for education only), the EUR 60 wing width on either side less the credit, times 100 shares
- Break-even at expiry: approximately EUR 1,499.64 on the downside and EUR 1,720.36 on the upside
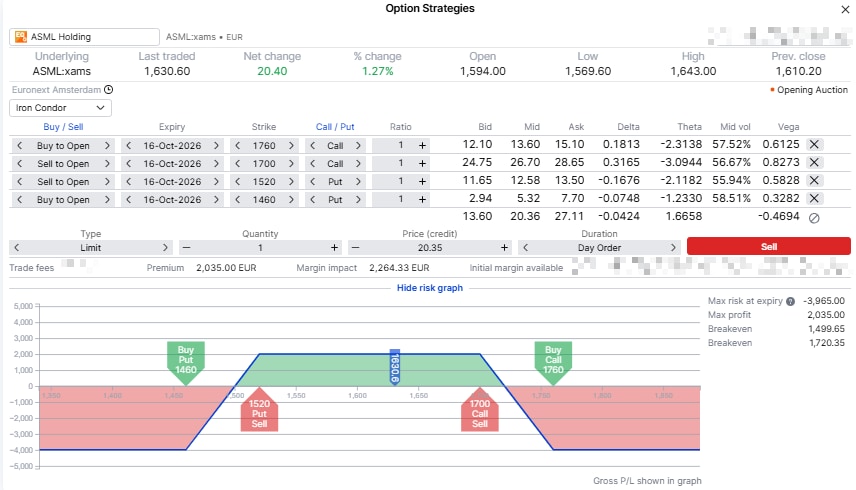 Strategy screen for the ASML iron condor described above, 16 October 2026 expiry. SaxoTrader enters it at a EUR 20.35 limit price, so its figures differ by about EUR 1 from the mid-based figures in the text. Illustrative only, not a trade recommendation. Prices are indicative Saxo mid quotes as of the 8 October 2026 Euronext close and will differ. Past performance is not indicative of future results; figures are illustrative and not predictive. Source: SaxoTrader.
Bearish lean: broken-wing put butterfly
Broken-wing put butterfly (illustrative only, not a trade recommendation)
ASML has fallen after six of its last eight reports, with a median decline of roughly 4% to 5% (Source: Saxo price data, author calculation). A reader leaning towards another decline could use a broken-wing put butterfly, a butterfly with deliberately uneven wings that is entered for a small net credit rather than a debit. The risk comes first: if ASML falls far below 1,460, the maximum loss is about EUR 5,315 (hypothetical, for education only), roughly eight times the credit received, and the short puts carry early-assignment risk because ASML options are American-style. The benefit is that if ASML rises instead, every put expires worthless and the position keeps its small credit of about EUR 685 (hypothetical, for education only). The maximum gain of about EUR 2,685 needs a close at 1,540 exactly.
The following example is hypothetical and for educational purposes only; it is not advice or a trade recommendation.
Example structure (illustrative only, not a trade recommendation)
- Buy 1 16 Oct 2026 1560 put at EUR 22.23
- Sell 2 16 Oct 2026 1540 puts at EUR 17.20 each, EUR 34.40 in total
- Buy 1 16 Oct 2026 1460 put at EUR 5.32
- Net credit: approximately EUR 6.85 per share, made up of EUR 34.40 received for the two short puts, less EUR 22.23 paid for the 1560 put and EUR 5.32 paid for the 1460 put
- Maximum profit: approximately EUR 2,685 (hypothetical, for education only), at an ASML close of 1,540 at expiry
- Maximum risk: approximately EUR 5,315 (hypothetical, for education only), if ASML closes at or below 1,460
- Break-even at expiry: approximately EUR 1,513.15 on the downside; above 1,560 the position keeps its credit of approximately EUR 685
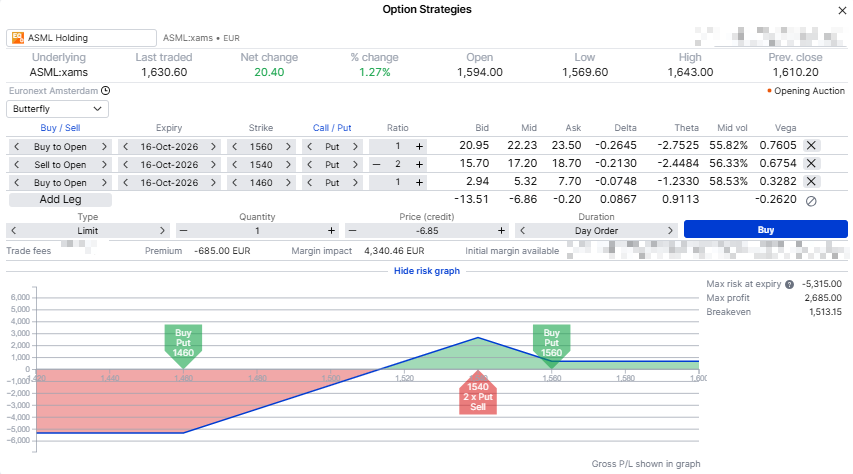 Strategy screen for the ASML broken-wing put butterfly described above, 16 October 2026 expiry. Illustrative only, not a trade recommendation. Prices are indicative Saxo mid quotes as of the 8 October 2026 Euronext close and will differ. Past performance is not indicative of future results; figures are illustrative and not predictive. Source: SaxoTrader.
Bullish lean: bull call spread
Bull call spread (illustrative only, not a trade recommendation)
A reader who expects the report to be received well could buy a call and sell a higher one against it, rather than buy the call outright. The most the position can lose is the premium paid, about EUR 3,250 (hypothetical, for education only), if ASML closes at or below 1,620, and the short call carries early-assignment risk because ASML options are American-style. In return, the cost is lower than for the 1620 call alone, but the gain is capped at about EUR 4,750 (hypothetical, for education only) above 1,700. The break-even sits about 1.3% above the share price, well inside ASML’s 4.7% median reaction,, a useful check on how much of a move a structure needs.
The following example is hypothetical and for educational purposes only; it is not advice or a trade recommendation.
Example structure (illustrative only, not a trade recommendation)
- Buy 1 16 Oct 2026 1620 call at EUR 59.20
- Sell 1 16 Oct 2026 1700 call at EUR 26.70
- Net debit: approximately EUR 32.50 per share, made up of EUR 59.20 paid for the 1620 call, less EUR 26.70 received for the 1700 call
- Maximum profit: approximately EUR 4,750 (hypothetical, for education only), if ASML closes at or above 1,700 at expiry
- Maximum risk: approximately EUR 3,250 (hypothetical, for education only), the net debit paid, if ASML closes at or below 1,620
- Break-even at expiry: approximately EUR 1,652.50, about 1.3% above the share price of EUR 1,630.60
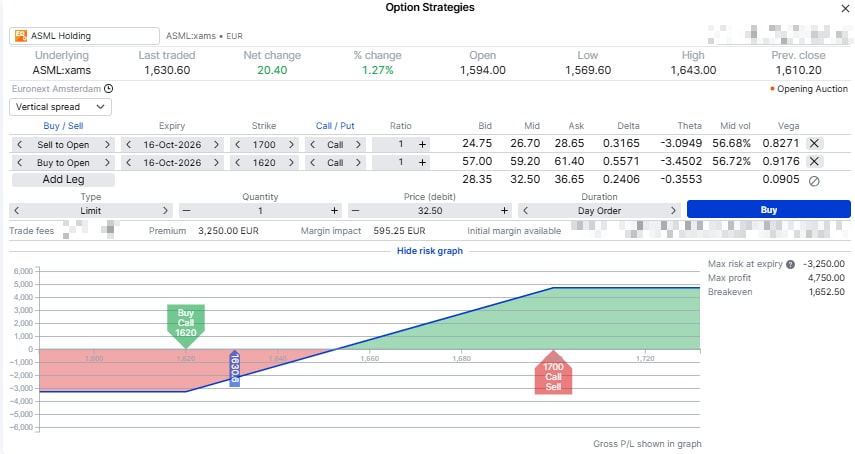 Strategy screen for the ASML bull call spread described above, 16 October 2026 expiry. Illustrative only, not a trade recommendation. Prices are indicative Saxo mid quotes as of the 8 October 2026 Euronext close and will differ. Past performance is not indicative of future results; figures are illustrative and not predictive. Source: SaxoTrader.
A note on the ASML mini contract
A smaller mini contract with the root ASLM also exists on ASML, covering 10 shares instead of 100 at the same strikes and expiries (Source: Saxo instrument data). Premiums are quoted per share, so the same structure on the mini contract carries a tenth of the size at the same per-share price. The bull call spread above would risk about EUR 325 and gain at most about EUR 475 on 10 shares (hypothetical, for education only). The structure does not change; only the step size does. Check the bid/ask spreads on the mini chain, which can differ from the standard chain.
Before placing any trade, check
Bid/ask spreads on the strikes used, volume and open interest, that 14 October is confirmed as the report date and timing, implied volatility relative to realised history, and an exit plan defined before entry. Short legs can be assigned before expiry if they move in the money, so monitor them and understand the platform’s assignment process. Costs and charges apply to each leg and vary by account and venue; check the applicable rates before entering any position.
The author does not hold positions in any of the instruments mentioned in this article.
Final thoughts
ASML’s report gives the options market one clean event to price, isolated by an expiry two sessions later. The three structures read the same 6.5% priced move three ways: as richer than usual, as a lean towards the stock’s more common decline, and as a lower-cost bullish case. None answers whether ASML will move, only how much is already paid for in option prices and what shape of risk a reader might carry. Future outcomes are uncertain and may result in losses, and ASML’s actual move could land well outside the ranges described here. Options carry a high risk of rapid loss and are not suitable for every investor.
The Author is permitted to wait at least 24 hours from the time of the publication before they trade the instruments themselves.
| Related articles/content |
|---|
| Two banks one morning what options price for Goldman Sachs and Wells Fargo earnings | 9 Oct 2026 Same coin different payoffs an options toolkit for earnings season | 7 Oct 2026 Earnings season is close to a coin flip The edge is in what happens next | 5 Oct 2026 Finding unusually expensive or cheap options in the Saxo screener | 18 Sep 2026 Implied volatility rank what it measures and what it misses | 11 Sep 2026 Nine prints later what Q2 earnings season taught us | 11 Aug 2026 What IV crush really means in practice reviewed version | 9 April 2026 Trading earnings with defined | 31 Mar 2026 |
| More from the author |
|---|